
How to See the Jet Stream in Flight Times
On this page
Problem statement
Fly from New York to Los Angeles and back and the return is noticeably shorter. The reason is the jet stream, a band of strong westerly wind at cruising altitude that pushes eastbound aircraft along and holds westbound ones back. It is strongest in winter, when the temperature contrast between the Arctic and the subtropics is largest.
The BTS on-time file contains no wind data, but it has everything needed to see the wind anyway: each flight's great-circle distance and its time in the air. Distance over air time is a ground speed; the airports' coordinates give each flight's heading. This page uses 2.1 million long domestic flights from 2025 to measure the jet stream's effect by direction, by route, by month and by day.
Quick answer
Compute each flight's initial heading with pyproj.Geod.inv, its ground speed as distance over air time, and compare flights heading east with flights heading west:
from pyproj import Geod

geod = Geod(ellps="WGS84")
f = flights[(flights.Cancelled == 0) & (flights.Diverted == 0) & flights.AirTime.notna()].copy()
o, d = airports.reindex(f.Origin), airports.reindex(f.Dest)
f["heading"] = geod.inv(o.lon.values, o.lat.values, d.lon.values, d.lat.values)[0] % 360
f["kmh"] = f.Distance * 1.609344 / (f.AirTime / 60)
long_ = f[(f.Distance >= 1000) & f.kmh.between(300, 1200)]
ew = long_[long_.heading.between(45, 135) | long_.heading.between(225, 315)]
ew = ew.assign(way=np.where(ew.heading < 180, "eastbound", "westbound"))
print(ew.groupby("way").kmh.median().round(0).to_string())
print((ew.groupby([ew.FlightDate.dt.month, "way"]).kmh.median().unstack().loc[[1, 4, 7, 10]]).round(0).to_string())
way
eastbound 814.0
westbound 711.0
way eastbound westbound
FlightDate
1 838.0 684.0
4 815.0 696.0
7 791.0 744.0
10 819.0 716.0
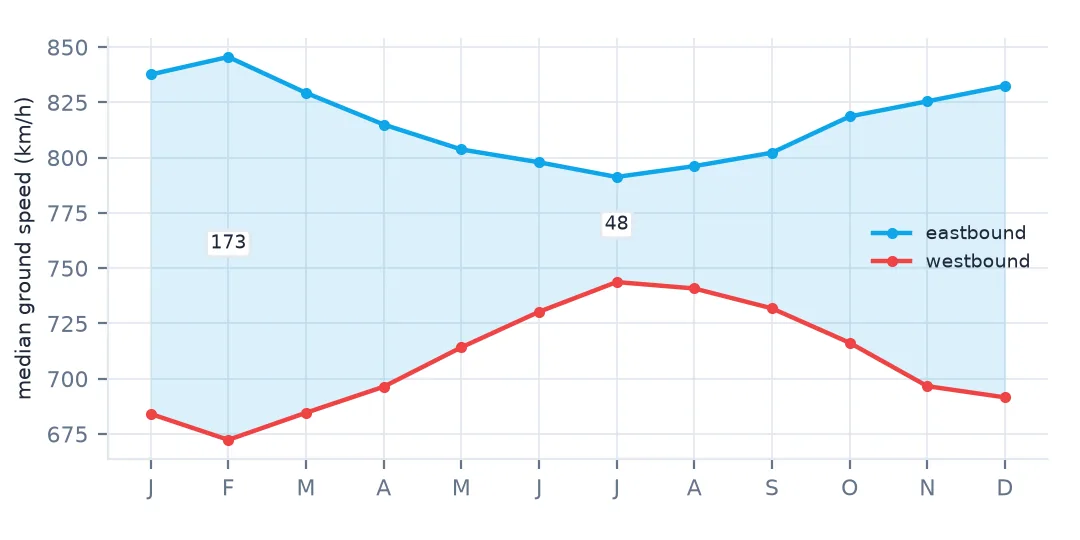
Long eastbound flights average a median 814 km/h over the ground, westbound ones 711 — a difference that comes from the wind, not the aircraft. In January the gap is 154 km/h (838 against 684); in July it shrinks to 47 (791 against 744).
Ground speed, heading and season
1. Speed from the file's own columns
print(f"{len(f):,} flights; ground speed = Distance / AirTime; flights of 1,000+ miles kept: {len(long_):,}")
print(long_.kmh.describe(percentiles=[0.01, 0.5, 0.99]).round(0).to_string())
6,879,484 flights; ground speed = Distance / AirTime; flights of 1,000+ miles kept: 2,064,861
count 2064861.0
mean 751.0
std 72.0
min 384.0
1% 586.0
50% 748.0
99% 913.0
max 1194.0
AirTime runs from wheels off to wheels on, so taxiing is excluded; Distance is the great-circle distance. Keeping flights of 1,000 miles or more leaves 2,064,861, long enough that climb and descent do not dominate. A median of 748 km/h, with 99% between 586 and 913, is a plausible cruise ground speed; the extremes beyond that are timing errors, which the range filter removes.
2. Speed against heading
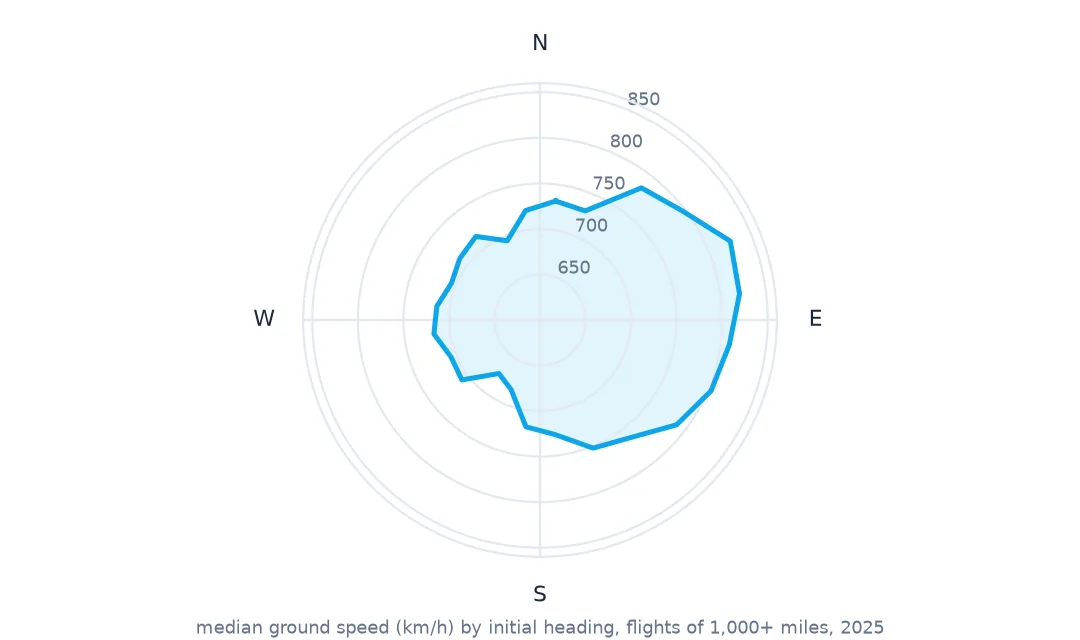
Binning by heading shows the wind's direction without any wind data:
sector = (long_.heading // 30 * 30).astype(int)
print(long_.groupby(sector).kmh.agg(["median", "size"]).round(0).astype(int).T.to_string())
heading 0 30 60 90 120 150 180 210 240 270 300 330
median 730 795 824 807 778 746 687 685 713 710 712 702
size 103922 132500 425080 234062 68103 68547 79633 57870 236945 443523 125047 89629
Flights heading 60–90° — east-north-east — are fastest, at 807–824 km/h; flights heading 180–210°, south and south-west, are slowest, at 685–687. The fastest heading points where the wind blows to, which puts the jet stream over the US coming from the west-south-west. Northbound and southbound flights fall in between, but not symmetrically, because the wind is not purely westerly and because the routes in each sector are different routes.
3. The same route in both directions
pair = {}
for a, b in [("JFK", "LAX"), ("ATL", "SEA"), ("BOS", "SFO"), ("MCO", "DEN")]:
    out = f[(f.Origin == a) & (f.Dest == b)].AirTime.median()
    back = f[(f.Origin == b) & (f.Dest == a)].AirTime.median()
    pair[f"{a}-{b}"] = (out, back, back - out)
print(pd.DataFrame(pair, index=["westbound (min)", "eastbound (min)", "eastbound minus westbound"]).T.round(0).to_string())
westbound (min) eastbound (min) eastbound minus westbound
JFK-LAX 327.0 288.0 -39.0
ATL-SEA 291.0 251.0 -40.0
BOS-SFO 360.0 305.0 -55.0
MCO-DEN 216.0 182.0 -34.0
On the same routes, the eastbound flight is 34–55 minutes shorter in the air. JFK to Los Angeles takes a median 327 minutes, Los Angeles to JFK 288; Boston–San Francisco differs by 55 minutes over a longer distance.
4. The season of the jet stream
gap = ew.groupby([ew.FlightDate.dt.month, "way"]).kmh.median().unstack()
gap["east minus west"] = gap.eastbound - gap.westbound
print(gap["east minus west"].round(0).astype(int).to_dict())
{1: 154, 2: 173, 3: 145, 4: 119, 5: 89, 6: 68, 7: 48, 8: 55, 9: 70, 10: 102, 11: 129, 12: 141}
The gap follows the jet stream's seasonal cycle closely: largest in February (173 km/h), smallest in July (48), and rising again through the autumn. In winter the polar jet is stronger and lies further south, over the routes; in summer it weakens and retreats towards Canada.
Daily variation and the schedule
The data used on this page
The Bureau of Transportation Statistics Reporting Carrier On-Time Performance files for 2025 (Distance, the great-circle distance in miles, and AirTime, wheels-off to wheels-on in minutes), and airport coordinates from OurAirports in a copy saved on 15 October 2026.
from pathlib import Path
import zipfile

import numpy as np
import pandas as pd
import requests

Path("data").mkdir(exist_ok=True)
BTS = "https://transtats.bts.gov/PREZIP/On_Time_Reporting_Carrier_On_Time_Performance_1987_present_2025_{}.zip"
COLS = ["FlightDate", "Reporting_Airline", "Tail_Number", "Flight_Number_Reporting_Airline", "Origin", "Dest",
        "CRSDepTime", "DepTime", "DepDelay", "TaxiOut", "WheelsOff", "WheelsOn", "TaxiIn", "CRSArrTime", "ArrTime",
        "ArrDelay", "Cancelled", "CancellationCode", "Diverted", "CRSElapsedTime", "ActualElapsedTime", "AirTime",
        "Distance", "CarrierDelay", "WeatherDelay", "NASDelay", "SecurityDelay", "LateAircraftDelay"]
TEXT = {c: str for c in ["CRSDepTime", "DepTime", "WheelsOff", "WheelsOn", "CRSArrTime", "ArrTime", "CancellationCode",
                         "Tail_Number"]}


def read_month(m):
    f = Path(f"data/On_Time_Reporting_Carrier_On_Time_Performance_1987_present_2025_{m}.zip")
    if not f.exists():
        f.write_bytes(requests.get(BTS.format(m), timeout=900).content)
    with zipfile.ZipFile(f) as z:
        name = next(n for n in z.namelist() if n.endswith(".csv"))
        return pd.read_csv(z.open(name), usecols=COLS, dtype=TEXT, parse_dates=["FlightDate"], low_memory=False)


flights = pd.concat([read_month(m) for m in range(1, 13)], ignore_index=True)

# OurAirports is edited daily; this is the copy of 15 October 2026
# (live: https://davidmegginson.github.io/ourairports-data/airports.csv).
AIRPORTS = "ourairports-airports-2026-10-15.csv"
if not Path(f"data/{AIRPORTS}").exists():
    Path(f"data/{AIRPORTS}").write_bytes(requests.get(f"https://data.spatialworkflow.io/{AIRPORTS}", timeout=300).content)
ap = pd.read_csv(f"data/{AIRPORTS}", usecols=["ident", "iata_code", "name", "latitude_deg", "longitude_deg"])
by_iata = ap.dropna(subset=["iata_code"]).drop_duplicates("iata_code").set_index("iata_code")
by_ident = ap.set_index("ident")
codes = pd.Index(sorted(set(flights.Origin) | set(flights.Dest)))
KEEP = ["name", "latitude_deg", "longitude_deg"]
airports = by_iata.reindex(codes)[KEEP]
gap = airports.latitude_deg.isna().values
airports.loc[gap, KEEP] = by_ident.reindex("K" + codes[gap])[KEEP].values      # fall back to the US ident, K + code
airports = airports.rename(columns={"latitude_deg": "lat", "longitude_deg": "lon"})
print(f"{len(flights):,} flights, {len(codes)} airports, {airports.lat.isna().sum()} without coordinates")
7,001,619 flights, 352 airports, 0 without coordinates
Example 1: day to day on one route
jl = f[(f.Origin.isin(["JFK", "LAX"])) & (f.Dest.isin(["JFK", "LAX"]))]
daily = jl.groupby(["FlightDate", "Origin"]).AirTime.median().unstack()
daily.columns = ["from JFK", "from LAX"]
print(daily.describe().round(0).to_string())
print(f"day with the biggest difference: {(daily['from JFK'] - daily['from LAX']).idxmax():%d %b}, "
      f"{(daily['from JFK'] - daily['from LAX']).max():.0f} min")
from JFK from LAX
count 365.0 365.0
mean 328.0 288.0
std 16.0 12.0
min 294.0 246.0
25% 315.0 280.0
50% 328.0 289.0
75% 338.0 295.0
max 384.0 321.0
day with the biggest difference: 09 Feb, 134 min
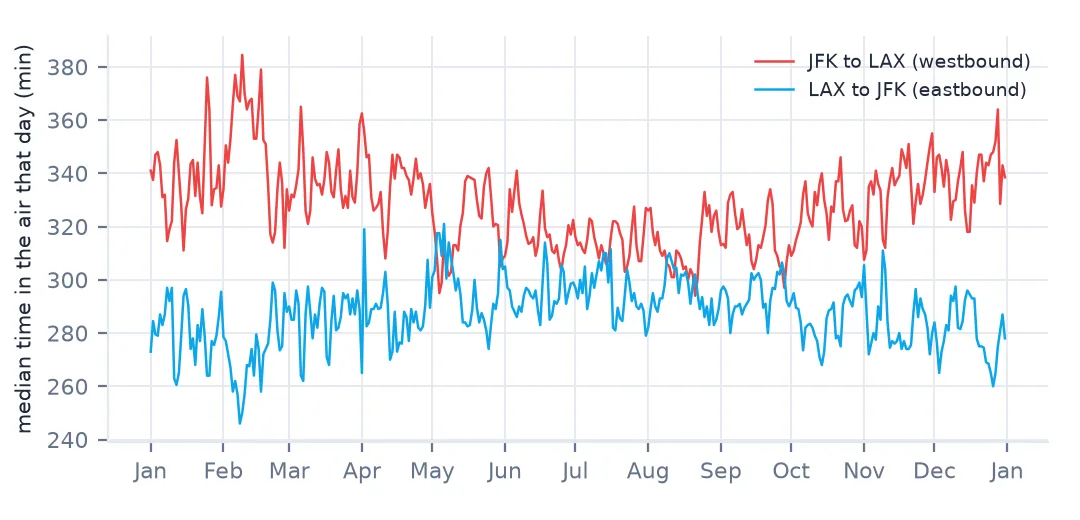
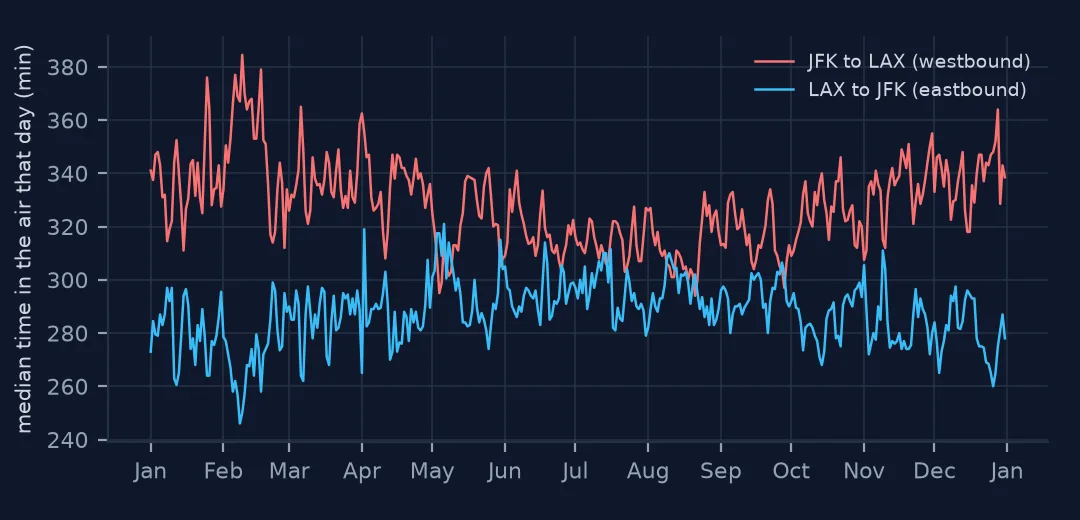
Day to day the westbound time varies more: from 294 to 384 minutes from JFK, from 246 to 321 from Los Angeles. On 9 February the median westbound flight took 134 minutes longer than the median eastbound one — that day's jet stream ran along the route at full strength.
Example 2: the airlines already schedule for it
sched = f[(f.Origin.isin(["JFK", "LAX"])) & (f.Dest.isin(["JFK", "LAX"]))]
s = sched.groupby([sched.FlightDate.dt.month, "Origin"]).CRSElapsedTime.median().unstack()
s.columns = ["JFK to LAX", "LAX to JFK"]
print(s.loc[[1, 4, 7, 10]].to_string())
JFK to LAX LAX to JFK
FlightDate
1 388.0 324.0
4 380.0 329.0
7 370.0 339.0
10 365.0 331.0
The airlines plan for it. In January the scheduled gate-to-gate time from JFK to Los Angeles is a median 388 minutes, 64 more than the return; by July the difference is 31 minutes. Seasonal schedules are, in effect, a forecast of the jet stream.
Measuring a wind with a stopwatch
An aircraft flies through the air at roughly the same airspeed whichever way it goes. Its speed over the ground is that airspeed plus the component of the wind along its track. Average over thousands of flights and the aircraft-to-aircraft differences cancel, leaving the wind: half the difference between eastbound and westbound ground speeds is the mean along-track wind component, about 50 km/h over the year and nearly 80 km/h in winter.
Two simplifications are built in. The heading here is the initial bearing of the great circle, while aircraft follow airways and, on long routes, deliberately use or avoid the jet; and AirTime includes climb and descent, which are slower and wind-independent. Both dilute the signal, so the true winds at altitude are stronger than this method shows. To measure the wind itself, the next step is a reanalysis or forecast model's wind at cruising level along each route.
Pitfalls in flight-time analysis
- Use
AirTime, not departure and arrival clock times. Those are local and cross time zones. - Short flights dilute the signal. Climb and descent dominate under about 1,000 miles.
- Heading is the great-circle bearing at departure, not the track flown.
- Compare like routes. Mixing routes mixes distances and winds.
- Filter impossible speeds. A few records have timing errors.
Internal links
- How to build an airline route network and draw great-circle routes — the routes and their geodesics
- How to calculate haversine distance in Python — distance on a sphere
- How to download GFS wind data — measure the jet stream directly
- Flights that arrive before they depart — why AirTime is the safe duration
FAQ
Why are eastbound flights shorter than westbound flights in the US?
The jet stream blows from west to east at cruising altitude. In 2025, long eastbound domestic flights had a median ground speed of 814 km/h against 711 for westbound ones.
How much longer is a flight from New York to Los Angeles than the return?
In 2025 the median JFK–LAX flight spent 327 minutes in the air and the return 288, a 39-minute difference; airlines schedule up to 64 minutes more westbound in winter.