
NBI Inspection Dates That Will Not Parse: Month and Year Without Leading Zeros
On this page
Problem statement
The National Bridge Inventory records when each bridge was last inspected as a month and two-digit year packed together: 0624 for June 2024. In the delimited file the leading zero is gone for most rows, so 469,935 dates are three characters long, like 223 for February 2023. Hand that column to pd.to_datetime and it refuses outright; parse one value at a time and 1019 becomes the year 1019; read the column as numbers and every date turns into a few nanoseconds after 1970. This page shows each failure, the one-line fix, and what the parsed dates reveal about overdue inspections.
Quick answer
Keep the column as text, zero-pad it to four characters, and parse with an explicit format: pd.to_datetime(s.str.zfill(4), format="%m%y"). Every 2025 inspection date then parses.
raw = nbi.DATE_OF_INSPECT_090.str.strip()
print("lengths:", raw.str.len().value_counts().to_dict(), "| examples:", raw.head(4).tolist())
try:
    pd.to_datetime(raw)
except ValueError as e:
    print("pd.to_datetime without a format:", str(e).split(",")[0])
four = raw[raw.str.len() == 4].iloc[0]
print(f"one value at a time, '{four}' becomes {pd.to_datetime(four):%Y-%m-%d}")
nbi["inspected"] = pd.to_datetime(raw.str.zfill(4), format="%m%y", errors="coerce")
print(f"with format='%m%y' on zero-padded text: {nbi.inspected.notna().mean():.2%} parsed; '{four}' is {pd.to_datetime(four, format='%m%y'):%B %Y}")
lengths: {3.0: 469935, 4.0: 154255} | examples: ['223', '223', '823', '724']
pd.to_datetime without a format: Given date string "223" not likely a datetime
one value at a time, '1019' becomes 1019-01-01
with format='%m%y' on zero-padded text: 100.00% parsed; '1019' is October 2019
Without a format, pandas rejects the column on the first three-digit value ("223" not likely a datetime). On a single four-digit value it guesses a year: 1019 becomes 1 January 1019. With format="%m%y" on zero-padded text, 100.00% of dates parse, and 1019 is October 2019.
Parsing the dates and using them
1. Read as numbers, they become nanoseconds
import io
as_numbers = pd.read_csv(io.StringIO("DATE_OF_INSPECT_090\n0624\n223\n"))["DATE_OF_INSPECT_090"]
print("read without dtype=str:", as_numbers.tolist(), "->", pd.to_datetime(as_numbers).astype(str).tolist())
read without dtype=str: [624, 223] -> ['1970-01-01 00:00:00.000000624', '1970-01-01 00:00:00.000000223']
If the file is read without dtype=str, 0624 and 223 become the integers 624 and 223, and pd.to_datetime takes integers as nanoseconds since 1970: every bridge was inspected in the first microsecond of the Unix epoch. Read the column as text.
2. When bridges were last inspected
print("inspections by year:", nbi.inspected.dt.year.value_counts().sort_index().to_dict())
print(f"latest inspection month in the file: {nbi.inspected.max():%B %Y}")
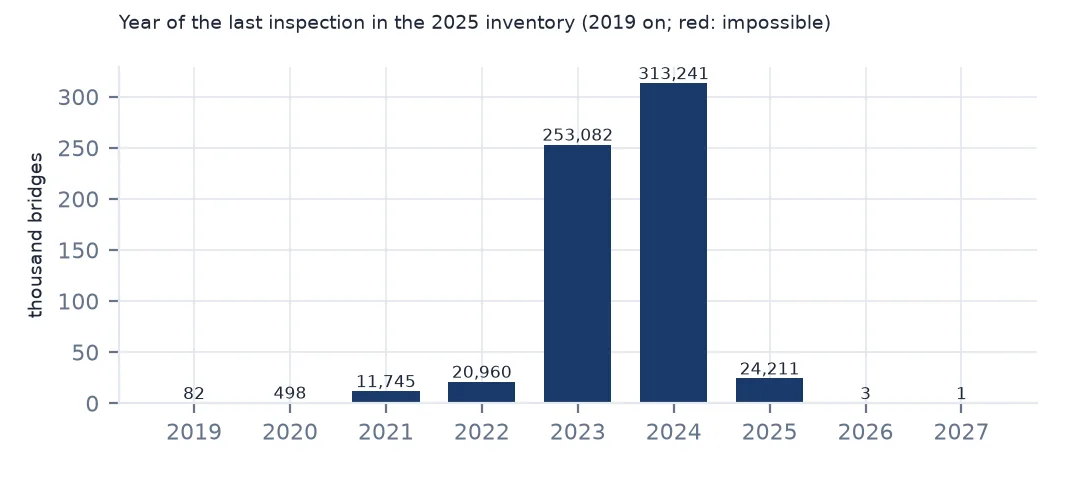
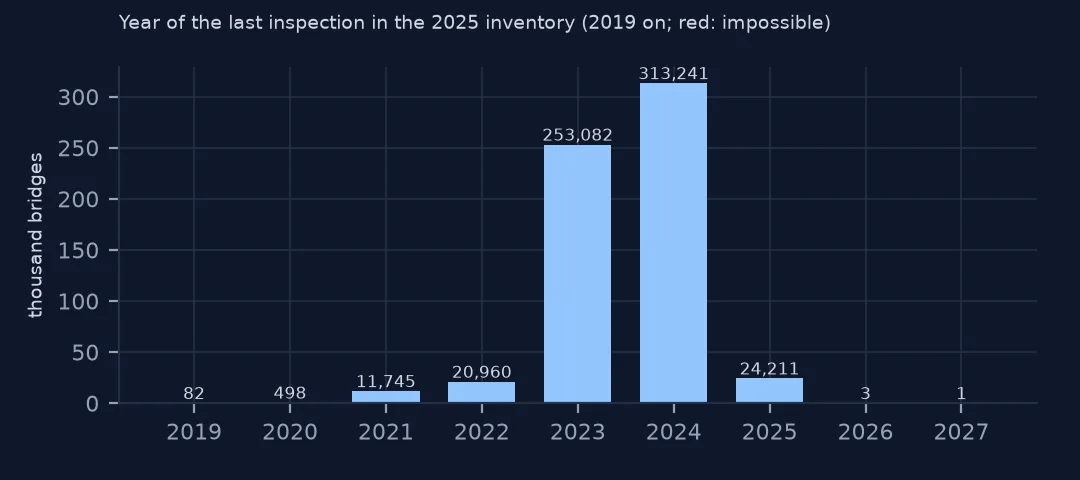
inspections by year: {1991.0: 1, 1992.0: 1, 1993.0: 3, 1995.0: 2, 1998.0: 2, 1999.0: 2, 2000.0: 4, 2001.0: 16, 2003.0: 3, 2004.0: 3, 2005.0: 4, 2006.0: 9, 2007.0: 7, 2008.0: 12, 2009.0: 9, 2010.0: 11, 2011.0: 10, 2012.0: 10, 2013.0: 10, 2014.0: 65, 2015.0: 26, 2016.0: 50, 2017.0: 52, 2018.0: 55, 2019.0: 82, 2020.0: 498, 2021.0: 11745, 2022.0: 20960, 2023.0: 253082, 2024.0: 313241, 2025.0: 24211, 2026.0: 3, 2027.0: 1}
latest inspection month in the file: August 2027
Most bridges were last inspected in 2024 (313,241) or 2023 (253,082), consistent with a two-year cycle before a submission in early 2025; 24,211 were inspected in 2025. A long tail goes back to 1991, and the latest date is August 2027 — in the future.
3. Overdue by their own frequency
freq = pd.to_numeric(nbi.INSPECT_FREQ_MONTHS_091.str.strip(), errors="coerce")
due = nbi.inspected + pd.to_timedelta(freq * 30.44, unit="D")
cut = pd.Timestamp("2025-03-01")                                      # roughly when states submit
print("inspection frequencies, months:", freq.value_counts().head(5).to_dict())
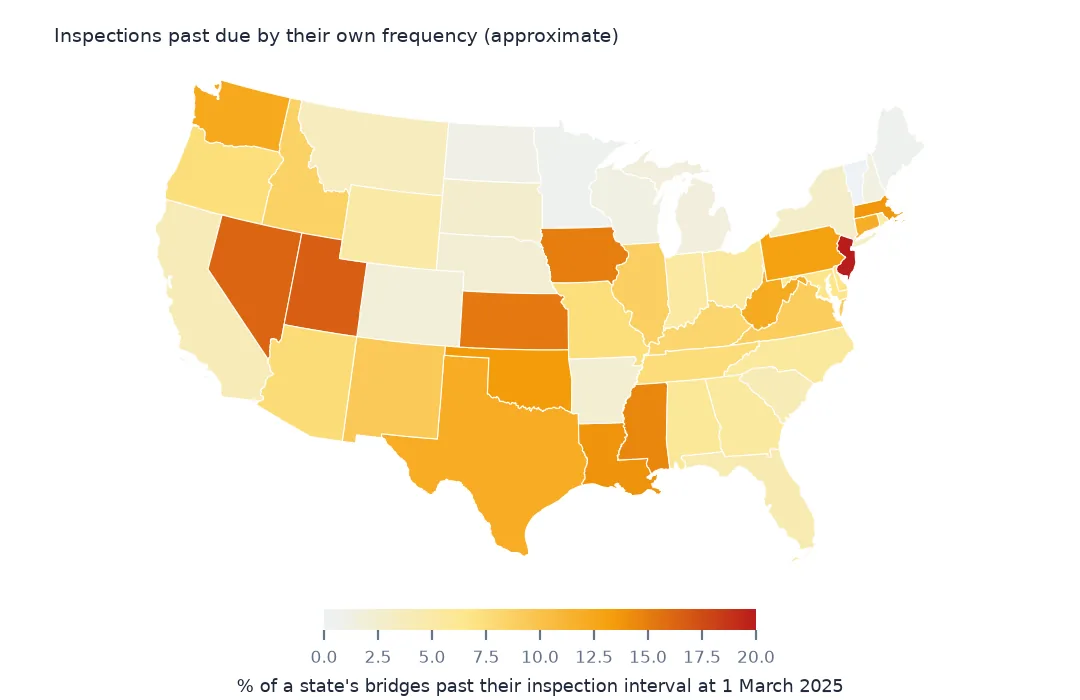
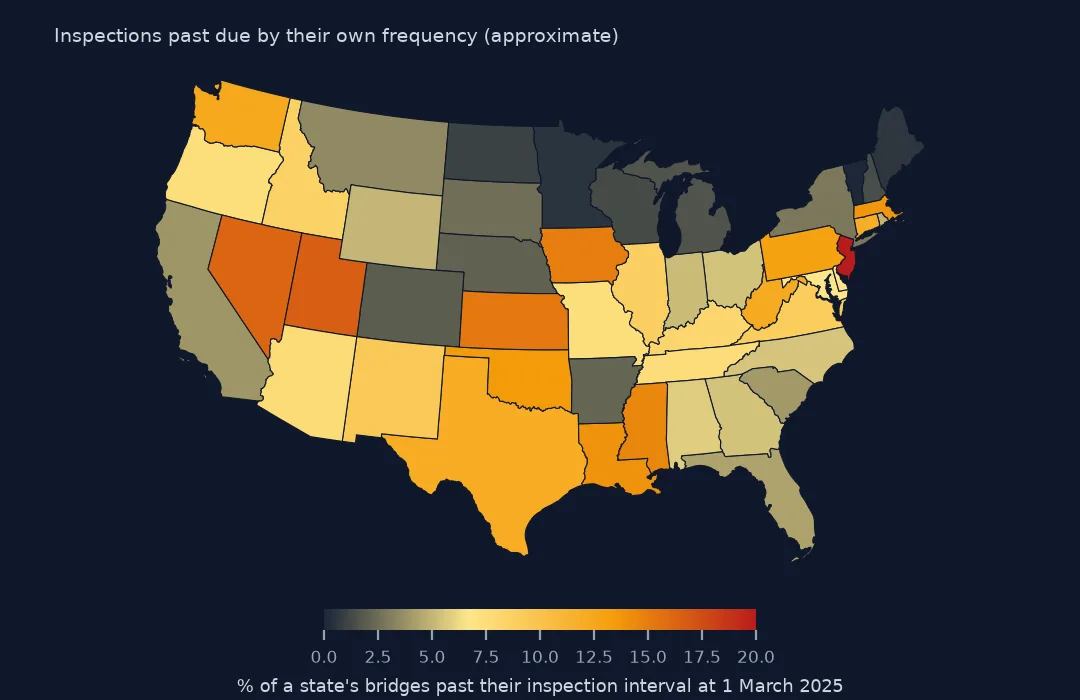
print(f"past due at the start of March 2025: {(due < cut).mean():.2%} of bridges")
inspection frequencies, months: {24.0: 527936, 48.0: 63736, 12.0: 30476, 6.0: 382, 23.0: 362}
past due at the start of March 2025: 8.12% of bridges
Most bridges are on a 24-month cycle (527,936), with 63,736 on 48 months and 30,476 on 12. Adding each bridge's own frequency to its last inspection, 8.12% were past due at the start of March 2025 — an upper bound, since the 30-day month is approximate and some inspections happen between the cut-off and submission.
4. Two-digit years and impossible dates
print(f"years parsed: {nbi.inspected.dt.year.min():.0f} to {nbi.inspected.dt.year.max():.0f}; '%y' puts 69-99 in the 1900s and 00-68 in the 2000s")
future = nbi[nbi.inspected > pd.Timestamp("2025-12-31")]
print(f"inspections dated after 2025, impossible in a 2025 file: {len(future)}; raw values {future.DATE_OF_INSPECT_090.str.strip().tolist()}")
years parsed: 1991 to 2027; '%y' puts 69-99 in the 1900s and 00-68 in the 2000s
inspections dated after 2025, impossible in a 2025 file: 4; raw values ['226', '926', '926', '827']
%y maps 69–99 to the 1900s, so the 1991 dates are read correctly as 1991. Four dates fall after 2025 — 226, 926, 926 and 827 — which cannot be right in a file submitted in 2025; they are typos for other years and should be flagged rather than trusted.
Frequency by condition, and other dates
The data used on this page
The Federal Highway Administration's National Bridge Inventory for 2025: the date of the last inspection (month and year) and the inspection frequency in months.
import zipfile
from pathlib import Path

import geopandas as gpd
import numpy as np
import pandas as pd
import requests

Path("data").mkdir(exist_ok=True)
# FHWA National Bridge Inventory, 2025 submission, highway bridges, all states in one comma-delimited file (53 MB zip).
# The server is slow and drops long downloads, so resume until the file is complete.
URL = "https://www.fhwa.dot.gov/bridge/nbi/2025hwybronefiledel.zip"
f = Path("data/2025hwybronefiledel.zip")
size = int(requests.head(URL, allow_redirects=True, timeout=60).headers["Content-Length"])
while not f.exists() or f.stat().st_size < size:
    have = f.stat().st_size if f.exists() else 0
    try:
        with requests.get(URL, headers={"Range": f"bytes={have}-"}, stream=True, timeout=120) as r, open(f, "ab") as out:
            for chunk in r.iter_content(1 << 20):
                out.write(chunk)
    except requests.RequestException:
        pass                                                   # resume from what arrived
with zipfile.ZipFile(f) as z:
    nbi = pd.read_csv(z.open("2025HwyBridgesDelimitedAllStates.txt"), quotechar="'", dtype=str, low_memory=False)


def dms(s, west=False):
    """NBI packs coordinates as DDMMSSss (latitude) and DDDMMSSss (longitude, positive west)."""
    s = s.str.strip().str.zfill(9 if west else 8)
    d = s.str[:-6].astype(float) + s.str[-6:-4].astype(float) / 60 + s.str[-4:].astype(float) / 100 / 3600
    return -d if west else d


nbi["lat"], nbi["lon"] = dms(nbi.LAT_016), dms(nbi.LONG_017, west=True)
nbi["cond"] = nbi.BRIDGE_CONDITION                                   # G, F or P, derived by FHWA
nbi["adt"] = pd.to_numeric(nbi.ADT_029, errors="coerce")
nbi["built"] = pd.to_numeric(nbi.YEAR_BUILT_027, errors="coerce")
nbi["area"] = pd.to_numeric(nbi.DECK_AREA, errors="coerce")
for name in ["cb_2023_us_state_20m.zip"]:
    if not Path(f"data/{name}").exists():
        Path(f"data/{name}").write_bytes(requests.get(f"https://www2.census.gov/geo/tiger/GENZ2023/shp/{name}", timeout=300).content)
states = gpd.read_file("data/cb_2023_us_state_20m.zip").to_crs(4326)
nbi["state"] = nbi.STATE_CODE_001.map(states.set_index("STATEFP").STUSPS)
print(f"{len(nbi):,} highway bridges, {nbi.shape[1]} fields, {nbi.STATE_CODE_001.nunique()} state codes")
624,193 highway bridges, 130 fields, 53 state codes
Example 1: frequency by condition
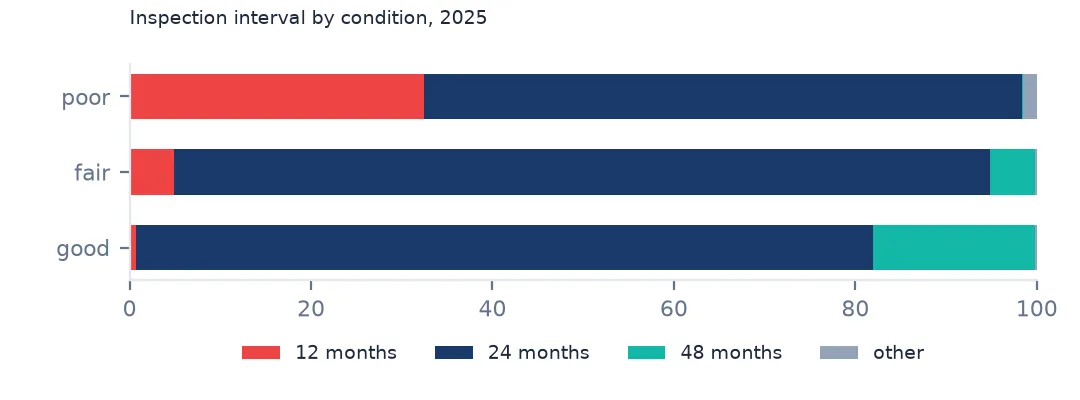
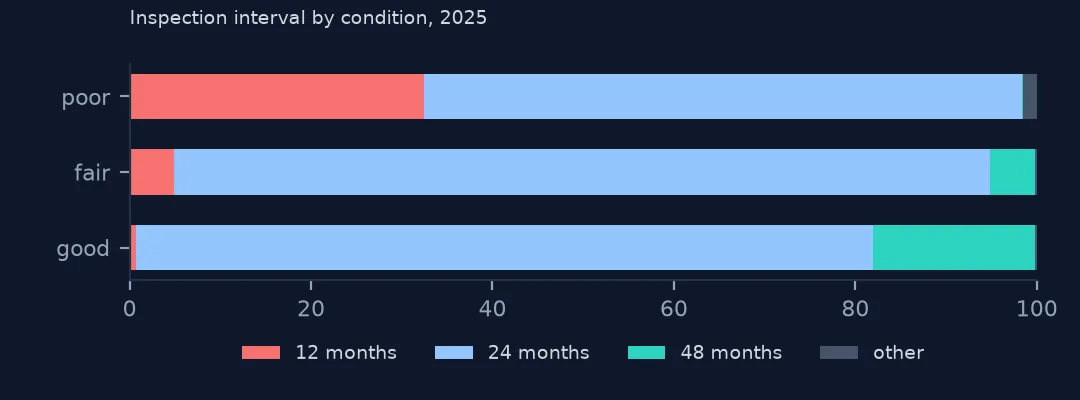
print(pd.crosstab(nbi.cond, freq.where(freq.isin([12, 24, 48]), other=0), normalize="index").round(3).rename(columns={0: "other"}).to_string())INSPECT_FREQ_MONTHS_091 other 12.0 24.0 48.0
cond
F 0.002 0.049 0.900 0.049
G 0.002 0.007 0.813 0.178
P 0.016 0.324 0.660 0.000
Inspection frequency follows condition: 32.4% of poor bridges are inspected every 12 months, against 0.7% of good ones, while 17.8% of good bridges qualify for a 48-month cycle and no poor bridge does.
Example 2: other packed dates
for c in ["FRACTURE_LAST_DATE_093A", "UNDWATER_LAST_DATE_093B", "SPEC_LAST_DATE_093C"]:
    v = nbi[c].str.strip()
    print(f"{c}: filled {(v.str.len() > 0).mean():.1%}; lengths {v.str.len().value_counts().head(3).to_dict()}")
FRACTURE_LAST_DATE_093A: filled 2.6%; lengths {4.0: 16402}
UNDWATER_LAST_DATE_093B: filled 5.2%; lengths {4.0: 32630}
SPEC_LAST_DATE_093C: filled 2.3%; lengths {4.0: 14607}
The dates of fracture-critical, underwater and special inspections use the same month-year packing but keep the leading zero (all four characters); they are filled only for the 2–5% of bridges that need those inspections. The same format="%m%y" parses them.
Why the dates look like this
The coding guide defines the inspection date as four digits, month then year, like other items in the fixed-width record. The delimited file was produced from those records by a process that dropped leading zeros, so January to September lost a digit and October to December did not — which is why both lengths appear. Nothing about the data is wrong; the format is simply not one that general-purpose date parsers expect.
Explicit formats are the general cure for any coded date: they turn a silent guess into a strict rule, and with errors="coerce" the values that do not fit become missing and visible instead of becoming the year 1019.
Date pitfalls in the NBI
- Two-digit years need a century rule;
%y's cut-off at 69 suits these files, but check the minimum and maximum after parsing. - Day of month is not recorded; parsed dates fall on the 1st, so durations are approximate to a month.
- Frequency has trailing spaces (
"6 "); strip before converting. - Other years in the file — year built, year reconstructed, year of ADT — are four digits and parse as plain integers.
Internal links
- NBI coordinates land in the wrong place — the other packed field
- How to map the National Bridge Inventory — reading the file as text
- Bridge condition ratings explained — what inspectors rate
FAQ
How do I parse NBI inspection dates in pandas?
pd.to_datetime(df.DATE_OF_INSPECT_090.str.strip().str.zfill(4), format="%m%y"), with the column read as text.
How often are US bridges inspected?
Most every 24 months; in the 2025 inventory 63,736 bridges were on a 48-month cycle and 30,476 on 12 months.