
Bridge Condition Ratings Explained: Good, Fair, Poor and the 0-9 Scale
On this page
Problem statement
News stories say that a bridge is "in poor condition" or "structurally deficient", and readers hear "unsafe". The National Bridge Inventory's ratings mean something narrower. Inspectors rate each major component — deck, superstructure, substructure, or the culvert — from 9 (excellent) to 0 (failed), and FHWA classifies the bridge by its lowest rating: Good, Fair or Poor. This page rebuilds that classification from the 2025 inventory, shows how the 0–9 ratings are distributed, which component usually decides, and what happens to bridges rated poor.
Quick answer
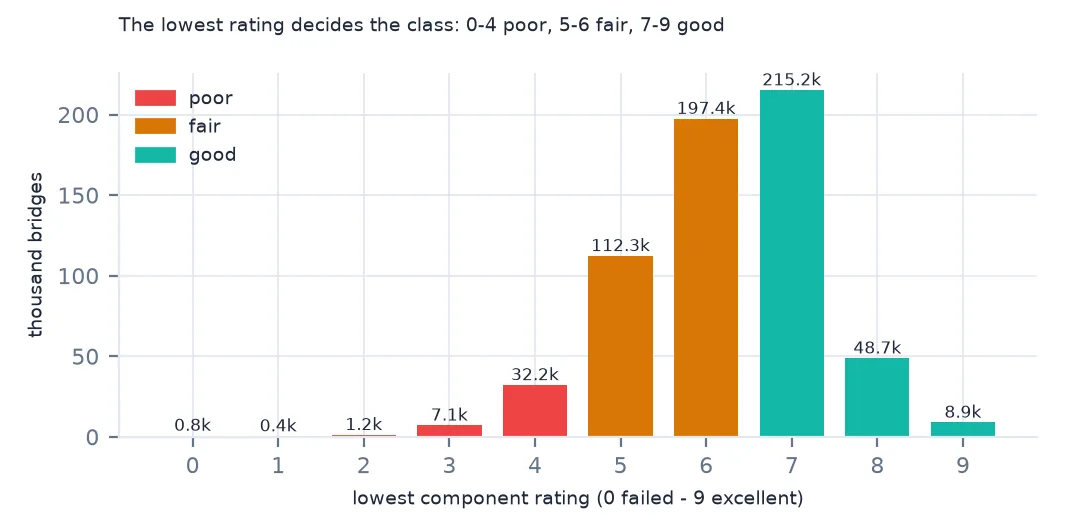
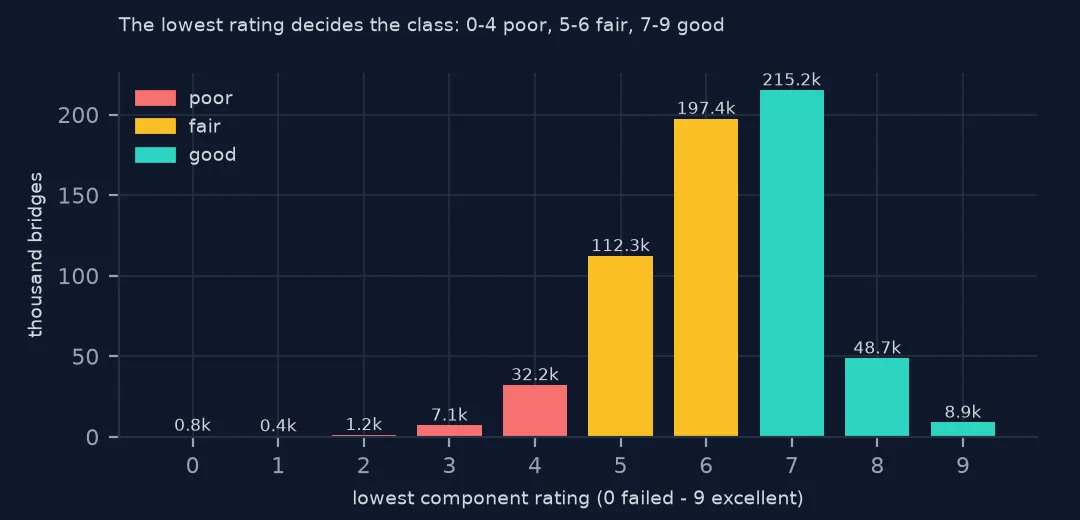
A bridge is Poor if its lowest component rating is 4 or below, Fair at 5 or 6, Good at 7 or above. The rule reproduces FHWA's BRIDGE_CONDITION for every bridge in the 2025 file. Poor means a component has advanced deterioration, not that the bridge is closed or about to fail.
comp = ["DECK_COND_058", "SUPERSTRUCTURE_COND_059", "SUBSTRUCTURE_COND_060", "CULVERT_COND_062"]
r = nbi[comp].apply(pd.to_numeric, errors="coerce")
lowest = r.min(axis=1)
mine = pd.cut(lowest, [-1, 4, 6, 9], labels=["P", "F", "G"]).astype(str)
print(f"Good/Fair/Poor rebuilt from the lowest component rating matches FHWA's BRIDGE_CONDITION for {(mine == nbi.cond).mean():.2%} of bridges")
print(pd.crosstab(lowest, nbi.cond).to_string())
Good/Fair/Poor rebuilt from the lowest component rating matches FHWA's BRIDGE_CONDITION for 100.00% of bridges
cond F G P
row_0
0.0 0 0 764
1.0 0 0 431
2.0 0 0 1209
3.0 0 0 7118
4.0 0 0 32163
5.0 112281 0 0
6.0 197448 0 0
7.0 0 215162 0
8.0 0 48728 0
9.0 0 8889 0
The rule matches FHWA's classification for 100.00% of bridges: every bridge with a lowest rating of 0–4 is Poor, 5–6 Fair and 7–9 Good, with no exceptions. Ratings of 5 and 6 are by far the commonest among fair bridges, 7 among good ones.
The ratings behind Good, Fair and Poor
1. Four components, one scale
print("share of bridges by rating (N = not applicable):")
print(nbi[comp].apply(lambda s: s.value_counts(normalize=True)).reindex(list("9876543210N")).round(3).to_string())
share of bridges by rating (N = not applicable):
DECK_COND_058 SUPERSTRUCTURE_COND_059 SUBSTRUCTURE_COND_060 CULVERT_COND_062
9 0.018 0.022 0.018 0.004
8 0.095 0.137 0.110 0.023
7 0.325 0.291 0.303 0.102
6 0.201 0.190 0.197 0.082
5 0.090 0.093 0.099 0.022
4 0.019 0.023 0.026 0.004
3 0.003 0.004 0.006 0.001
2 0.000 0.001 0.001 0.000
1 0.000 0.000 0.000 0.000
0 0.001 0.001 0.001 0.000
N 0.247 0.238 0.238 0.762
Most components are rated 6 to 8. Ratings of 3 or below — serious to critical deterioration — are rare: 0.3% to 0.6% of each component. About a quarter of bridges have N for deck, superstructure and substructure, and three quarters have N for culvert: each bridge is rated either as a bridge or as a culvert.
2. Bridges or culverts
culvert = nbi.CULVERT_COND_062 != "N"
print(f"culverts: {culvert.sum():,} ({culvert.mean():.1%}); their deck, superstructure and substructure are N: "
      f"{(nbi.loc[culvert, comp[:3]] == 'N').all(axis=1).mean():.1%}")
culverts: 148,555 (23.8%); their deck, superstructure and substructure are N: 99.9%
148,555 structures (23.8%) are culverts — buried pipes or boxes that carry a road over a stream — and for 99.9% of them the three bridge components are N. A culvert's condition comes from item 62 alone.
3. Which component decides
rp = r[nbi.cond == "P"].dropna(how="all")
low = rp.idxmin(axis=1)
print("component with the lowest rating on poor bridges:", low.value_counts(normalize=True).round(3).to_dict())
component with the lowest rating on poor bridges: {'SUBSTRUCTURE_COND_060': 0.352, 'DECK_COND_058': 0.321, 'SUPERSTRUCTURE_COND_059': 0.243, 'CULVERT_COND_062': 0.084}
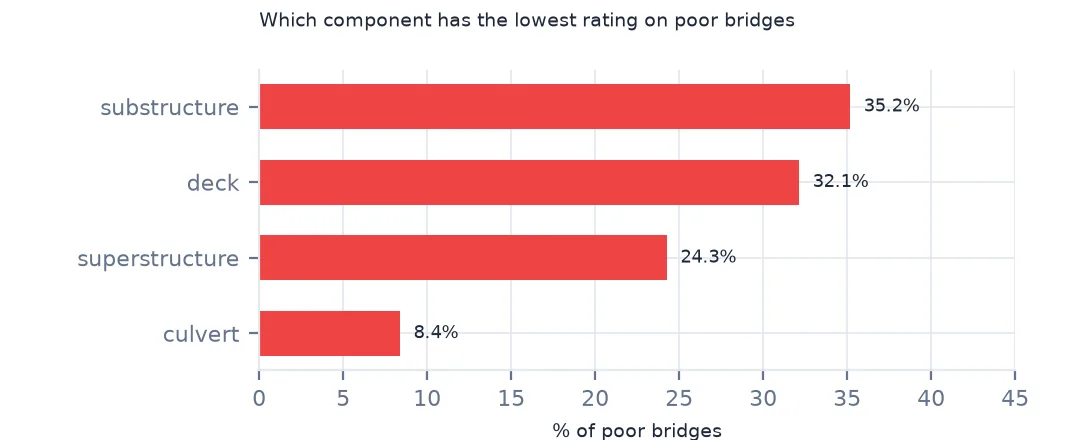
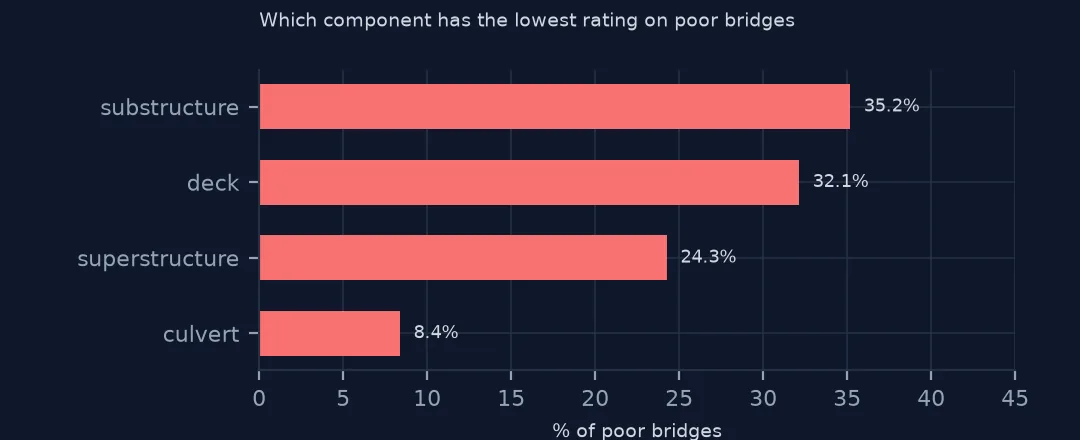
On poor bridges the substructure is most often the lowest-rated component (35.2%), then the deck (32.1%) and the superstructure (24.3%); culverts make up the rest. The substructure — piers, abutments, foundations — is where water, scour and de-icing salt do their damage.
4. Poor is not unsafe
post = nbi.OPEN_CLOSED_POSTED_041
print("poor bridges by status:", post[nbi.cond == "P"].value_counts(normalize=True).head(4).round(3).to_dict())
print(f"closed (K) among all bridges: {(post == 'K').sum():,}; among poor bridges: {((post == 'K') & (nbi.cond == 'P')).sum():,}")
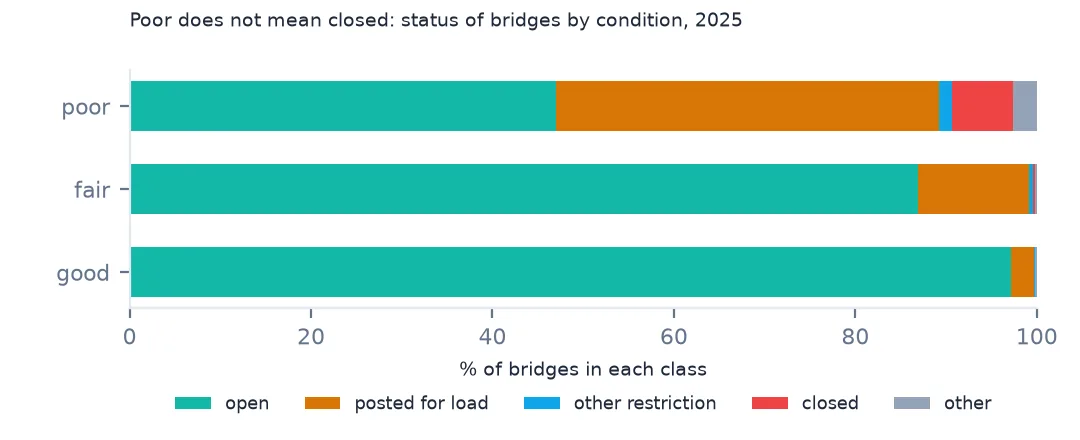
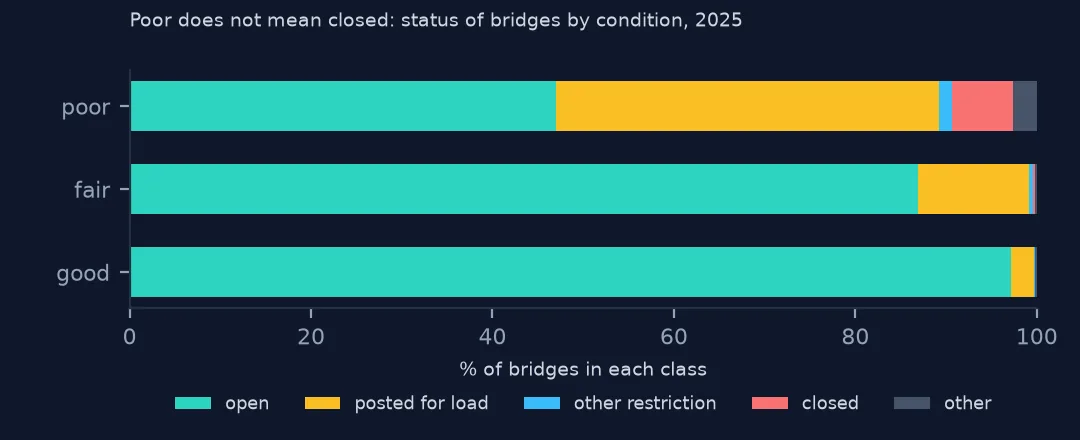
poor bridges by status: {'A': 0.47, 'P': 0.422, 'K': 0.068, 'R': 0.015}
closed (K) among all bridges: 3,587; among poor bridges: 2,820
47.0% of poor bridges are open without restriction, 42.2% are posted with a weight limit and 6.8% are closed. Closures are concentrated among poor bridges — 2,820 of the 3,587 closed bridges are rated poor — but most poor bridges carry traffic, under inspection.
Age and the line between Fair and Poor
The data used on this page
The Federal Highway Administration's National Bridge Inventory for 2025 (highway bridges, all states); rating definitions from FHWA's Recording and Coding Guide, items 58 to 62.
import zipfile
from pathlib import Path

import geopandas as gpd
import numpy as np
import pandas as pd
import requests

Path("data").mkdir(exist_ok=True)
# FHWA National Bridge Inventory, 2025 submission, highway bridges, all states in one comma-delimited file (53 MB zip).
# The server is slow and drops long downloads, so resume until the file is complete.
URL = "https://www.fhwa.dot.gov/bridge/nbi/2025hwybronefiledel.zip"
f = Path("data/2025hwybronefiledel.zip")
size = int(requests.head(URL, allow_redirects=True, timeout=60).headers["Content-Length"])
while not f.exists() or f.stat().st_size < size:
    have = f.stat().st_size if f.exists() else 0
    try:
        with requests.get(URL, headers={"Range": f"bytes={have}-"}, stream=True, timeout=120) as r, open(f, "ab") as out:
            for chunk in r.iter_content(1 << 20):
                out.write(chunk)
    except requests.RequestException:
        pass                                                   # resume from what arrived
with zipfile.ZipFile(f) as z:
    nbi = pd.read_csv(z.open("2025HwyBridgesDelimitedAllStates.txt"), quotechar="'", dtype=str, low_memory=False)


def dms(s, west=False):
    """NBI packs coordinates as DDMMSSss (latitude) and DDDMMSSss (longitude, positive west)."""
    s = s.str.strip().str.zfill(9 if west else 8)
    d = s.str[:-6].astype(float) + s.str[-6:-4].astype(float) / 60 + s.str[-4:].astype(float) / 100 / 3600
    return -d if west else d


nbi["lat"], nbi["lon"] = dms(nbi.LAT_016), dms(nbi.LONG_017, west=True)
nbi["cond"] = nbi.BRIDGE_CONDITION                                   # G, F or P, derived by FHWA
nbi["adt"] = pd.to_numeric(nbi.ADT_029, errors="coerce")
nbi["built"] = pd.to_numeric(nbi.YEAR_BUILT_027, errors="coerce")
nbi["area"] = pd.to_numeric(nbi.DECK_AREA, errors="coerce")
for name in ["cb_2023_us_state_20m.zip"]:
    if not Path(f"data/{name}").exists():
        Path(f"data/{name}").write_bytes(requests.get(f"https://www2.census.gov/geo/tiger/GENZ2023/shp/{name}", timeout=300).content)
states = gpd.read_file("data/cb_2023_us_state_20m.zip").to_crs(4326)
nbi["state"] = nbi.STATE_CODE_001.map(states.set_index("STATEFP").STUSPS)
print(f"{len(nbi):,} highway bridges, {nbi.shape[1]} fields, {nbi.STATE_CODE_001.nunique()} state codes")
624,193 highway bridges, 130 fields, 53 state codes
Example 1: ratings by age
age = 2025 - nbi.built
print("median lowest rating by age band:", lowest.groupby(pd.cut(age, [0, 10, 25, 50, 75, 100, 330])).median().to_dict())
median lowest rating by age band: {Interval(0, 10, closed='right'): 8.0, Interval(10, 25, closed='right'): 7.0, Interval(25, 50, closed='right'): 6.0, Interval(50, 75, closed='right'): 6.0, Interval(75, 100, closed='right'): 6.0, Interval(100, 330, closed='right'): 5.0}
The median lowest rating falls from 8 for bridges up to ten years old to 6 for those of 25 to 100 and 5 for bridges over a century old: deterioration is slow, and maintenance keeps most bridges fair for decades.
Example 2: one notch either side of the line
print(f"bridges rated exactly 5 (fair, one step above poor): {(lowest == 5).sum():,}; exactly 4 (poor): {(lowest == 4).sum():,}")bridges rated exactly 5 (fair, one step above poor): 112,281; exactly 4 (poor): 32,163
112,281 bridges sit at 5, one step above poor, against 32,163 at exactly 4. A one-point change on a later inspection moves a bridge between categories, so year-to-year counts of poor bridges move with inspection judgement as well as with real change.
What a rating measures
Condition ratings describe the physical state of each component as an inspector sees it: 9 excellent, 7 good with minor problems, 5 fair with section loss or cracking that has not affected strength, 4 poor with advanced section loss or deterioration, 3 serious, 2 critical, 1 imminent failure, 0 failed. They are not load ratings — how much weight the bridge can carry is a separate engineering calculation (items 64 and 66) — and they say nothing about whether the bridge is too narrow or too low for modern traffic.
FHWA's Good/Fair/Poor classification, used in federal performance measures since 2017, takes the minimum of the component ratings. Before that the headline measure was "structurally deficient", which also counted low structural or waterway evaluations; reports quoting it are not directly comparable with Poor counts.
Reading ratings correctly
- N is not zero. Convert ratings with
pd.to_numeric(errors="coerce")so N becomes missing; see bridge rating averages that come out too low. - Count and area differ. Poor bridges are a larger share by count than by deck area; FHWA's performance measures use deck area.
- Inspection dates differ. Each rating is from that bridge's last inspection, up to two or four years old.
- Channel condition (item 61) is rated too but does not enter Good/Fair/Poor.
Internal links
- How to map the National Bridge Inventory — the whole file
- bridge rating averages that come out too low — not-applicable codes
- How to analyse load-posted and closed bridges — what happens to poor bridges
FAQ
What does a poor bridge rating mean?
That at least one major component is rated 4 or lower: advanced deterioration. In 2025 most poor bridges were open (47.0%) or weight-posted (42.2%).
How is Good, Fair or Poor decided?
By the lowest of the deck, superstructure, substructure and culvert ratings: 7–9 Good, 5–6 Fair, 0–4 Poor.