
How to Map the National Bridge Inventory in Python
On this page
Problem statement
Every highway bridge in the United States longer than 20 feet is inspected at least every few years, and the results go to the Federal Highway Administration as the National Bridge Inventory: 624,193 bridges in the 2025 file, each with a location, owner, age, traffic, materials and four condition ratings. It is one of the richest open infrastructure datasets anywhere, and one of the most awkward to read: more than a hundred coded fields, coordinates packed as degrees-minutes-seconds with west longitudes stored as positive numbers, and codes that only make sense with FHWA's coding guide. This guide reads the 2025 file, decodes the coordinates, checks them against state boundaries and maps the bridges by condition.
Quick answer
Read the delimited file with quotechar="'" and dtype=str, convert LAT_016 and LONG_017 from packed DDMMSSss to decimal degrees (negating the longitude), and check the points fall in the state their STATE_CODE_001 says. BRIDGE_CONDITION already holds FHWA's Good, Fair or Poor.
pts = gpd.GeoDataFrame(nbi, geometry=gpd.points_from_xy(nbi.lon, nbi.lat), crs=4326)
inside = gpd.sjoin(pts[["STATE_CODE_001", "geometry"]], states[["STATEFP", "geometry"]], predicate="within", how="left")
ok = inside.STATEFP == inside.STATE_CODE_001
print(f"{len(pts):,} bridges; inside their own state's boundary: {ok.mean():.2%}")
print("condition:", nbi.cond.value_counts(normalize=True).round(3).to_dict())
print(f"bridges by deck area in poor condition: {nbi.loc[nbi.cond == 'P', 'area'].sum() / nbi.area.sum():.1%}")
624,193 bridges; inside their own state's boundary: 99.64%
condition: {'F': 0.496, 'G': 0.437, 'P': 0.067}
bridges by deck area in poor condition: 4.9%
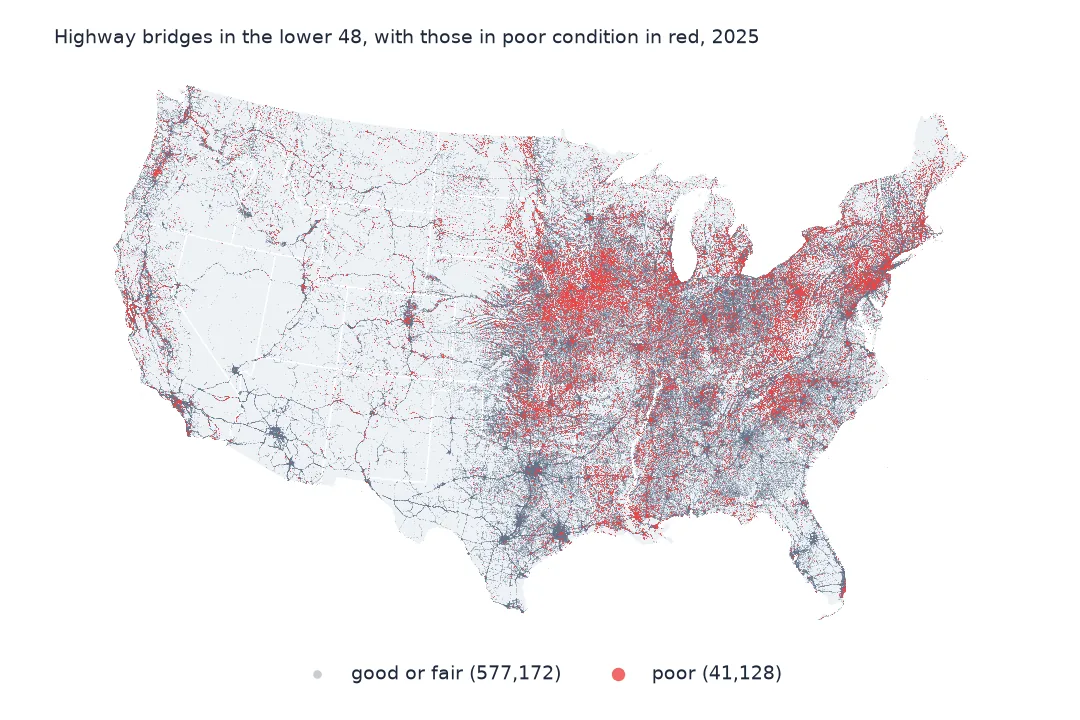
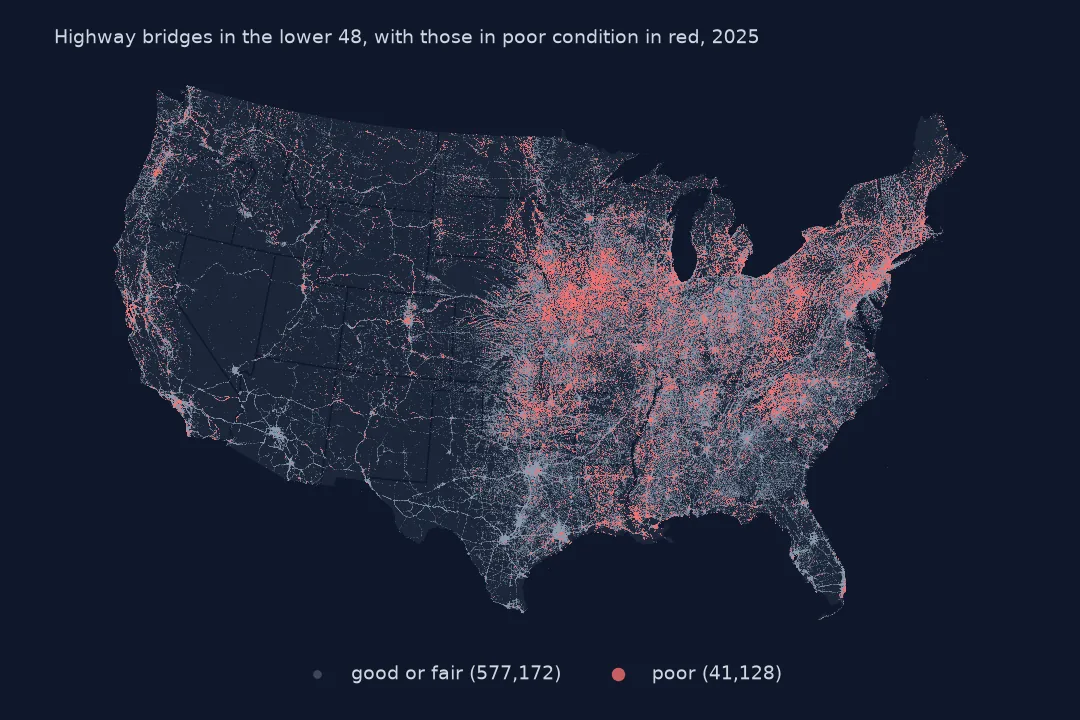
99.64% of the 624,193 bridges fall inside their own state once the coordinates are decoded. 43.7% are in good condition, 49.6% fair and 6.7% poor; by deck area poor bridges are 4.9%, because poor bridges tend to be small.
Reading, decoding and checking
1. Read the delimited file as text
print(f"{nbi.shape[1]} columns, all read as text; structure numbers with leading zeros or spaces: "
      f"{(nbi.STRUCTURE_NUMBER_008.str.strip() != nbi.STRUCTURE_NUMBER_008).sum():,}")
print("example structure numbers:", nbi.STRUCTURE_NUMBER_008.head(3).tolist())
130 columns, all read as text; structure numbers with leading zeros or spaces: 231,380
example structure numbers: ['00000000000S702', '00000000000S703', '0000000000M0022']
Everything is read as text on purpose. Structure numbers are 15-character codes padded with zeros and spaces — 231,380 of them would be mangled or lose leading zeros if read as numbers — and many coded fields mix digits with letters such as N.
2. Decode the coordinates
print(nbi[["LAT_016", "LONG_017", "lat", "lon"]].head(3).to_string(index=False))
print(f"latitude range {nbi.lat.min():.2f} to {nbi.lat.max():.2f}; longitude range {nbi.lon.min():.2f} to {nbi.lon.max():.2f}")
LAT_016 LONG_017 lat lon
31061094 087341348 31.103039 -87.570411
31062020 087340890 31.105611 -87.569139
32174330 084583799 32.295361 -84.977219
latitude range 0.00 to 100.68; longitude range -1000.68 to 74.53
The first bridge's latitude 31061094 is degrees, minutes, seconds and hundredths run together, and decodes to 31.103039°; its longitude 087341348 decodes to −87.570411°, west. The decoded ranges show the file still holds some broken values — latitudes up to 100.68 and longitudes as far as −1000.68 — so the state check below is not optional.
3. Check every bridge falls in its own state
bad = inside[~ok]
print(f"bridges outside their state: {len(bad):,}; with no state at all (sea, zero coordinates): {bad.STATEFP.isna().sum():,}")
print("worst states:", nbi.loc[bad.index].state.value_counts().head(5).to_dict())
bridges outside their state: 2,243; with no state at all (sea, zero coordinates): 995
worst states: {'MD': 551, 'OH': 178, 'CA': 90, 'NC': 87, 'MN': 66}
2,243 bridges fall outside their state, 995 of them outside every state (zeros, typos, points in the sea). Maryland has the most (551), then Ohio and California. For a national map these can be left out; for state work they should be fixed or flagged.
4. One row per bridge, many per state
by = nbi.groupby("state").agg(bridges=("cond", "size"), poor=("cond", lambda s: (s == "P").mean()))
print("most bridges:", by.bridges.nlargest(5).to_dict())
print("highest share in poor condition:", by.poor.nlargest(5).round(3).to_dict())
most bridges: {'TX': 56951, 'IL': 26927, 'OH': 26713, 'CA': 25975, 'KS': 24891}
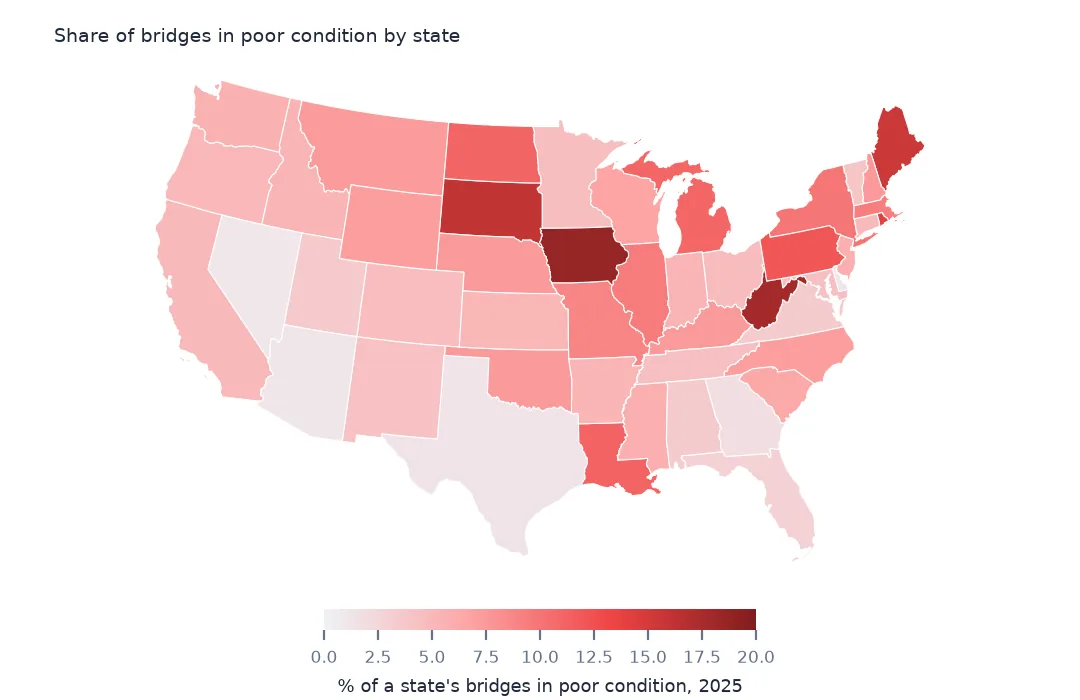
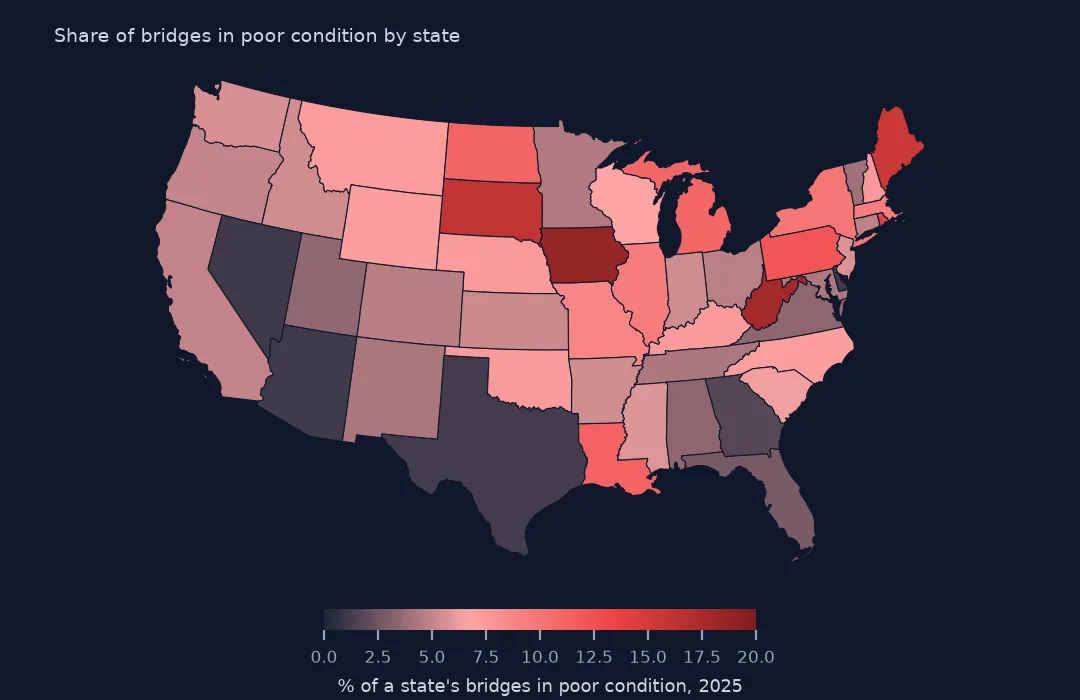
highest share in poor condition: {'IA': 0.186, 'WV': 0.178, 'SD': 0.161, 'ME': 0.154, 'PR': 0.141}
Texas has the most bridges (56,951), ahead of Illinois and Ohio. Iowa has the highest share in poor condition (18.6%), followed by West Virginia, South Dakota and Maine — rural states with many small, old county bridges.
Materials and lengths
The data used on this page
The Federal Highway Administration's National Bridge Inventory for 2025, the comma-delimited file of highway bridges in all states (one row per bridge, coded as in FHWA's Recording and Coding Guide), and Census Bureau 2023 cartographic boundary states.
import zipfile
from pathlib import Path

import geopandas as gpd
import numpy as np
import pandas as pd
import requests

Path("data").mkdir(exist_ok=True)
# FHWA National Bridge Inventory, 2025 submission, highway bridges, all states in one comma-delimited file (53 MB zip).
# The server is slow and drops long downloads, so resume until the file is complete.
URL = "https://www.fhwa.dot.gov/bridge/nbi/2025hwybronefiledel.zip"
f = Path("data/2025hwybronefiledel.zip")
size = int(requests.head(URL, allow_redirects=True, timeout=60).headers["Content-Length"])
while not f.exists() or f.stat().st_size < size:
    have = f.stat().st_size if f.exists() else 0
    try:
        with requests.get(URL, headers={"Range": f"bytes={have}-"}, stream=True, timeout=120) as r, open(f, "ab") as out:
            for chunk in r.iter_content(1 << 20):
                out.write(chunk)
    except requests.RequestException:
        pass                                                   # resume from what arrived
with zipfile.ZipFile(f) as z:
    nbi = pd.read_csv(z.open("2025HwyBridgesDelimitedAllStates.txt"), quotechar="'", dtype=str, low_memory=False)


def dms(s, west=False):
    """NBI packs coordinates as DDMMSSss (latitude) and DDDMMSSss (longitude, positive west)."""
    s = s.str.strip().str.zfill(9 if west else 8)
    d = s.str[:-6].astype(float) + s.str[-6:-4].astype(float) / 60 + s.str[-4:].astype(float) / 100 / 3600
    return -d if west else d


nbi["lat"], nbi["lon"] = dms(nbi.LAT_016), dms(nbi.LONG_017, west=True)
nbi["cond"] = nbi.BRIDGE_CONDITION                                   # G, F or P, derived by FHWA
nbi["adt"] = pd.to_numeric(nbi.ADT_029, errors="coerce")
nbi["built"] = pd.to_numeric(nbi.YEAR_BUILT_027, errors="coerce")
nbi["area"] = pd.to_numeric(nbi.DECK_AREA, errors="coerce")
for name in ["cb_2023_us_state_20m.zip"]:
    if not Path(f"data/{name}").exists():
        Path(f"data/{name}").write_bytes(requests.get(f"https://www2.census.gov/geo/tiger/GENZ2023/shp/{name}", timeout=300).content)
states = gpd.read_file("data/cb_2023_us_state_20m.zip").to_crs(4326)
nbi["state"] = nbi.STATE_CODE_001.map(states.set_index("STATEFP").STUSPS)
print(f"{len(nbi):,} highway bridges, {nbi.shape[1]} fields, {nbi.STATE_CODE_001.nunique()} state codes")
624,193 highway bridges, 130 fields, 53 state codes
Example 1: what the bridges are made of
KIND = {"1": "concrete", "2": "concrete continuous", "3": "steel", "4": "steel continuous", "5": "prestressed concrete",
        "6": "prestressed concrete continuous", "7": "wood or timber", "8": "masonry", "9": "aluminium, wrought or cast iron", "0": "other"}
k = nbi.STRUCTURE_KIND_043A.map(KIND)
print("share by material:", k.value_counts(normalize=True).round(3).to_dict())
print("share poor by material:", nbi.cond.eq("P").groupby(k).mean().sort_values(ascending=False).round(3).to_dict())
share by material: {'concrete': 0.291, 'prestressed concrete': 0.231, 'steel': 0.191, 'concrete continuous': 0.126, 'steel continuous': 0.082, 'prestressed concrete continuous': 0.048, 'wood or timber': 0.024, 'aluminium, wrought or cast iron': 0.004, 'masonry': 0.002, 'other': 0.001}
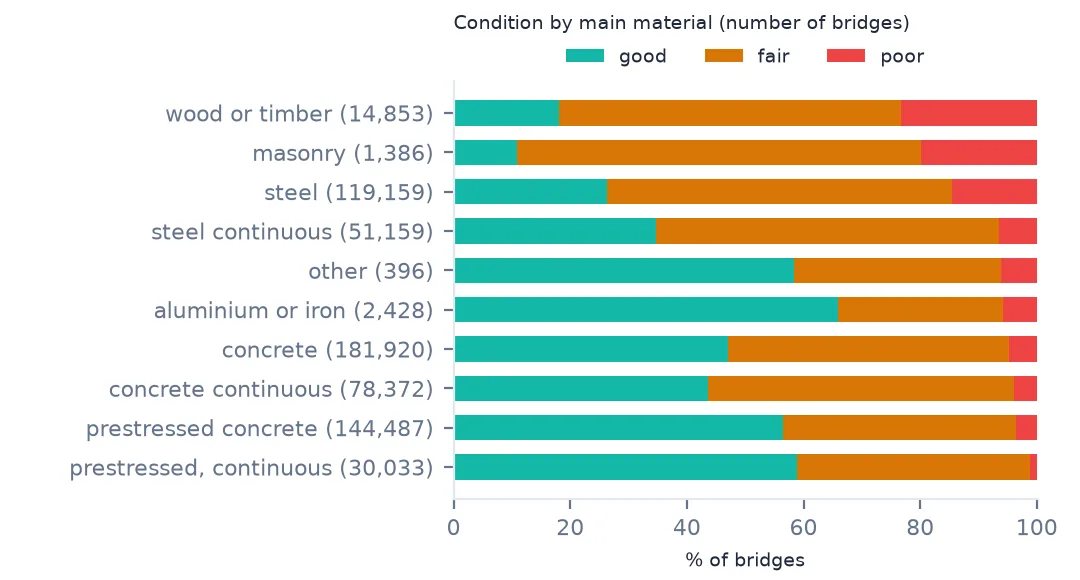
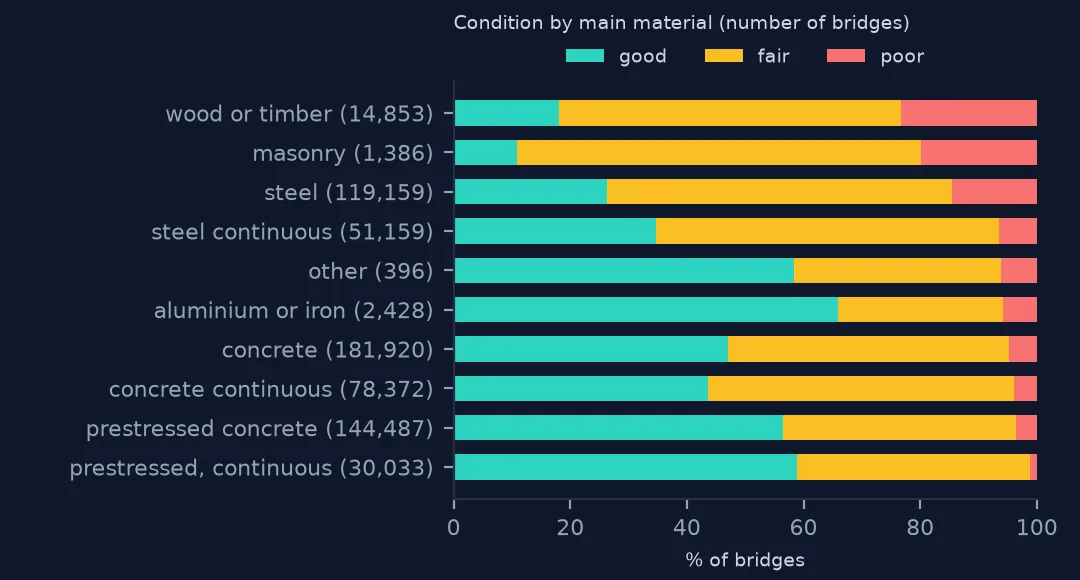
share poor by material: {'wood or timber': 0.233, 'masonry': 0.199, 'steel': 0.146, 'steel continuous': 0.064, 'other': 0.061, 'aluminium, wrought or cast iron': 0.058, 'concrete': 0.047, 'concrete continuous': 0.038, 'prestressed concrete': 0.036, 'prestressed concrete continuous': 0.012}
Concrete (29.1%), prestressed concrete (23.1%) and steel (19.1%) are the commonest main materials. Timber bridges are only 2.4% of the inventory but 23.3% of them are poor, against 1.2% of continuous prestressed concrete spans.
Example 2: how long they are
L = pd.to_numeric(nbi.STRUCTURE_LEN_MT_049, errors="coerce")
print(f"median length {L.median():.1f} m; longest: {nbi.loc[L.idxmax(), 'FACILITY_CARRIED_007'].strip()} over "
      f"{nbi.loc[L.idxmax(), 'FEATURES_DESC_006A'].strip()} ({L.max():,.0f} m)")
median length 20.1 m; longest: CSWY BRIDGE N. B. over LAKE PONTCHARTRAIN (38,792 m)
The median bridge is 20.1 m long. The longest is the northbound Lake Pontchartrain Causeway in Louisiana, 38,792 m.
What the inventory is
The NBI exists because federal law requires every public highway bridge longer than 20 feet to be inventoried and inspected, usually every 24 months, after the Silver Bridge collapse of 1967. States collect the data and submit it to FHWA each year, coded item by item according to the Recording and Coding Guide; the item numbers in the column names (_001, _058) are those items. The BRIDGE_CONDITION, LOWEST_RATING and DECK_AREA columns at the end are added by FHWA.
The file covers highway bridges and large culverts, not rail bridges or footbridges, and its coordinates are whatever the state recorded — accurate for most, approximate for some, wrong for a few. FHWA is moving the inventory to a new specification (SNBI) with different fields, so code written for this format will need adapting for later years.
Things to watch in the file
- The quote character is a single quote. Names such as
'MON CO RT 19/25'are quoted with'; setquotechar="'". - Puerto Rico and DC are among the 53 state codes; filter if you want the 50 states.
- Highway bridges only. This file has one record per highway bridge; FHWA's all-records file adds non-highway bridges and the records for routes passing under bridges.
- Units. Lengths and widths are in metres in the delimited file (
_MT_), even though US practice is feet.
Internal links
- Bridge condition ratings explained — what Good, Fair and Poor mean
- NBI coordinates land in the wrong place — the coordinate format
- How to analyse UK traffic count data — another national road dataset
FAQ
How many bridges are there in the United States?
624,193 highway bridges in FHWA's 2025 National Bridge Inventory, including culverts longer than 20 feet.
What share of US bridges are in poor condition?
6.7% by count in 2025, and 4.9% by deck area.