
How Old Are America's Bridges? Year Built, Reconstruction and Condition
On this page
Problem statement
"The average American bridge is about half a century old" is a common line in infrastructure reports. The National Bridge Inventory lets you check it and go further: every bridge has a year built and, if it has been rebuilt, a year of reconstruction, so you can see when the stock was built, how much has been renewed, and how condition falls with age. This guide does that for the 624,193 highway bridges of the 2025 file, including the Interstate-era bridges that make up the largest cohort.
Quick answer
Age is the inventory year minus the year built; the year-reconstructed field is 0 when a bridge has never been rebuilt, so replace 0 with missing before using it. Group condition by age band to see how bridges age.
age = 2025 - nbi.built
rec = pd.to_numeric(nbi.YEAR_RECONSTRUCTED_106, errors="coerce").replace(0, np.nan)
print(f"median age {age.median():.0f} years; built before 1950: {(nbi.built < 1950).mean():.1%}; reconstructed at some point: {rec.notna().mean():.1%}")
dec = (nbi.built // 10 * 10).clip(lower=1900)
print("bridges built by decade (1900 = 1900 or earlier):", dec.value_counts().sort_index().loc[1900:2020].to_dict())
median age 46 years; built before 1950: 13.9%; reconstructed at some point: 15.0%
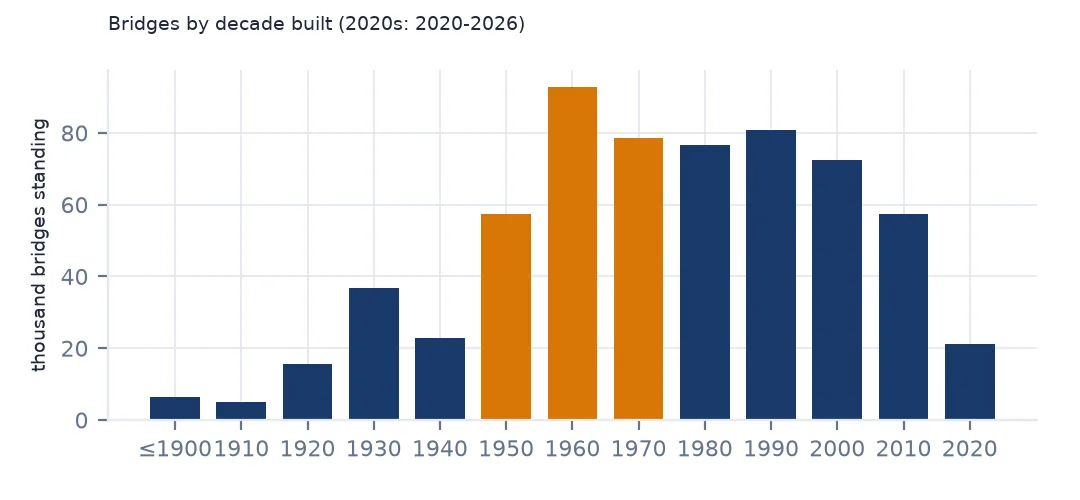
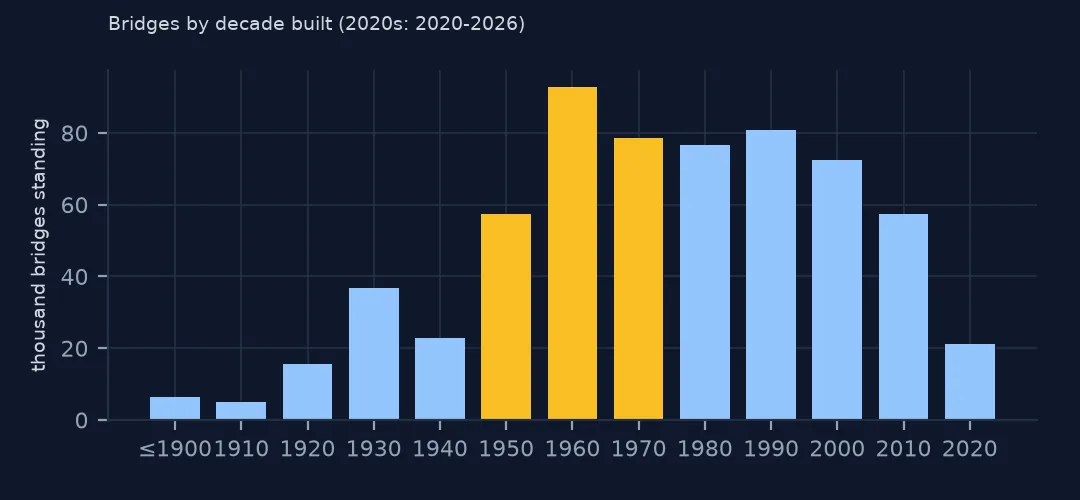
bridges built by decade (1900 = 1900 or earlier): {1900: 6523, 1910: 4885, 1920: 15577, 1930: 36902, 1940: 22743, 1950: 57500, 1960: 92892, 1970: 78587, 1980: 76607, 1990: 80858, 2000: 72584, 2010: 57413, 2020: 21122}
The median bridge is 46 years old. 13.9% were built before 1950, and 15.0% have been reconstructed at some point. Bridge building peaked in the 1960s (92,892 bridges still standing from that decade) and has slowed since: 57,413 from the 2010s.
Building, rebuilding and wearing out
1. Year built is recorded for every bridge
print(f"year built missing: {nbi.built.isna().sum()}; earliest {nbi.built.min():.0f}; latest {nbi.built.max():.0f}")
old = nbi[nbi.built == nbi.built.min()].iloc[0]
print(f"oldest: {old.FACILITY_CARRIED_007.strip()} over {old.FEATURES_DESC_006A.strip()}, {old.state}")
year built missing: 0; earliest 1697; latest 2026
oldest: FRANKFORD AVENUE over PENNYPACK CREEK, PA
Every bridge has a year built, from 1697 to 2026. The oldest is the Frankford Avenue bridge over Pennypack Creek in Philadelphia, a stone arch still carrying traffic; 2026 is a bridge completed after the inventory's reference date.
2. Reconstruction resets the clock, partly
eff = rec.fillna(nbi.built)
print(f"median age by year built {age.median():.0f}; by the later of built and reconstructed {(2025 - eff).median():.0f}")
print(f"median gap between building and reconstruction: {(rec - nbi.built).median():.0f} years")
median age by year built 46; by the later of built and reconstructed 38
median gap between building and reconstruction: 39 years
Counting reconstruction as a new start lowers the median age from 46 to 38 years. Reconstruction comes late: a median of 39 years after the bridge was built.
3. Condition by age
band = pd.cut(age, [-1, 10, 25, 50, 75, 100, 400], labels=["0-10", "11-25", "26-50", "51-75", "76-100", "100+"])
print(nbi.cond.groupby(band, observed=True).value_counts(normalize=True).unstack()[["G", "F", "P"]].round(3).to_string())
cond G F P
built
0-10 0.933 0.065 0.002
11-25 0.752 0.240 0.008
26-50 0.453 0.505 0.042
51-75 0.250 0.660 0.089
76-100 0.179 0.669 0.151
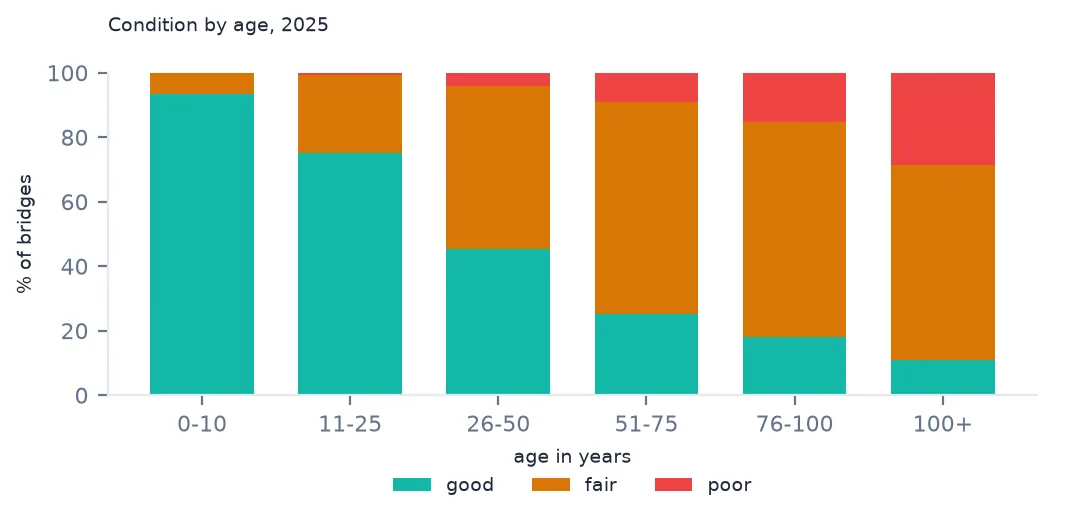
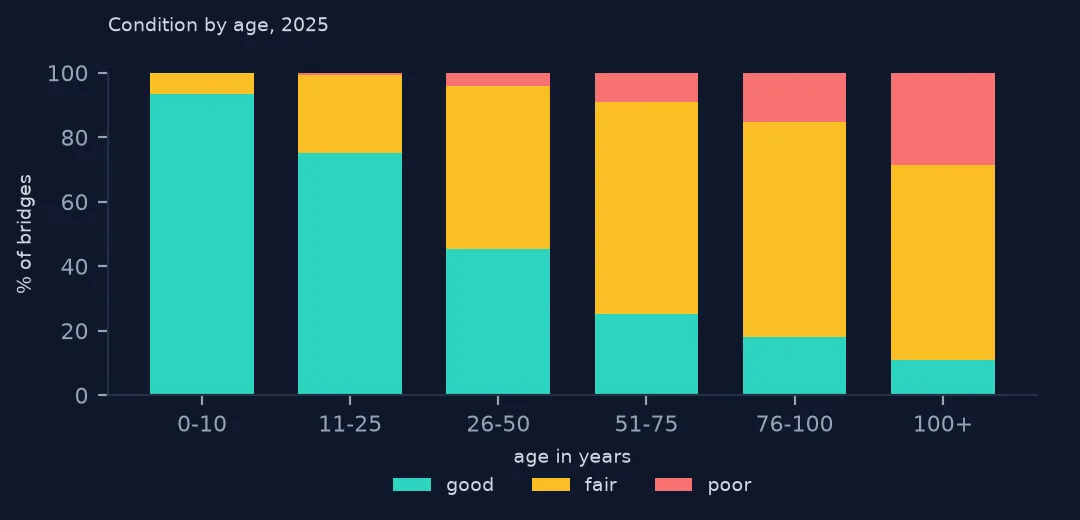
100+ 0.109 0.604 0.287
Condition falls steadily with age. 93.3% of bridges up to ten years old are good and 0.2% poor; at 51–75 years, 25.0% are good and 8.9% poor; past a century, 28.7% are poor. Most old bridges are fair rather than poor — maintenance keeps them in service — but the poor share rises with every band.
4. The Interstate generation
inter = nbi.ROUTE_PREFIX_005B == "1"
print(f"Interstate bridges: {inter.sum():,}; median year built {nbi.built[inter].median():.0f}; "
      f"built 1956-1975: {nbi.built[inter].between(1956, 1975).mean():.1%}")
Interstate bridges: 58,838; median year built 1970; built 1956-1975: 57.8%
The 58,838 Interstate bridges have a median build year of 1970, and 57.8% were built between 1956, when the Interstate system was authorised, and 1975. That cohort turns 50 to 70 years old during the 2020s.
States and new construction
The data used on this page
The Federal Highway Administration's National Bridge Inventory for 2025: the year-built and year-reconstructed items.
import zipfile
from pathlib import Path

import geopandas as gpd
import numpy as np
import pandas as pd
import requests

Path("data").mkdir(exist_ok=True)
# FHWA National Bridge Inventory, 2025 submission, highway bridges, all states in one comma-delimited file (53 MB zip).
# The server is slow and drops long downloads, so resume until the file is complete.
URL = "https://www.fhwa.dot.gov/bridge/nbi/2025hwybronefiledel.zip"
f = Path("data/2025hwybronefiledel.zip")
size = int(requests.head(URL, allow_redirects=True, timeout=60).headers["Content-Length"])
while not f.exists() or f.stat().st_size < size:
    have = f.stat().st_size if f.exists() else 0
    try:
        with requests.get(URL, headers={"Range": f"bytes={have}-"}, stream=True, timeout=120) as r, open(f, "ab") as out:
            for chunk in r.iter_content(1 << 20):
                out.write(chunk)
    except requests.RequestException:
        pass                                                   # resume from what arrived
with zipfile.ZipFile(f) as z:
    nbi = pd.read_csv(z.open("2025HwyBridgesDelimitedAllStates.txt"), quotechar="'", dtype=str, low_memory=False)


def dms(s, west=False):
    """NBI packs coordinates as DDMMSSss (latitude) and DDDMMSSss (longitude, positive west)."""
    s = s.str.strip().str.zfill(9 if west else 8)
    d = s.str[:-6].astype(float) + s.str[-6:-4].astype(float) / 60 + s.str[-4:].astype(float) / 100 / 3600
    return -d if west else d


nbi["lat"], nbi["lon"] = dms(nbi.LAT_016), dms(nbi.LONG_017, west=True)
nbi["cond"] = nbi.BRIDGE_CONDITION                                   # G, F or P, derived by FHWA
nbi["adt"] = pd.to_numeric(nbi.ADT_029, errors="coerce")
nbi["built"] = pd.to_numeric(nbi.YEAR_BUILT_027, errors="coerce")
nbi["area"] = pd.to_numeric(nbi.DECK_AREA, errors="coerce")
for name in ["cb_2023_us_state_20m.zip"]:
    if not Path(f"data/{name}").exists():
        Path(f"data/{name}").write_bytes(requests.get(f"https://www2.census.gov/geo/tiger/GENZ2023/shp/{name}", timeout=300).content)
states = gpd.read_file("data/cb_2023_us_state_20m.zip").to_crs(4326)
nbi["state"] = nbi.STATE_CODE_001.map(states.set_index("STATEFP").STUSPS)
print(f"{len(nbi):,} highway bridges, {nbi.shape[1]} fields, {nbi.STATE_CODE_001.nunique()} state codes")
624,193 highway bridges, 130 fields, 53 state codes
Example 1: age by state
st = age.groupby(nbi.state).median().sort_values()
print("youngest median age:", st.head(4).to_dict(), "| oldest:", st.tail(4).to_dict())
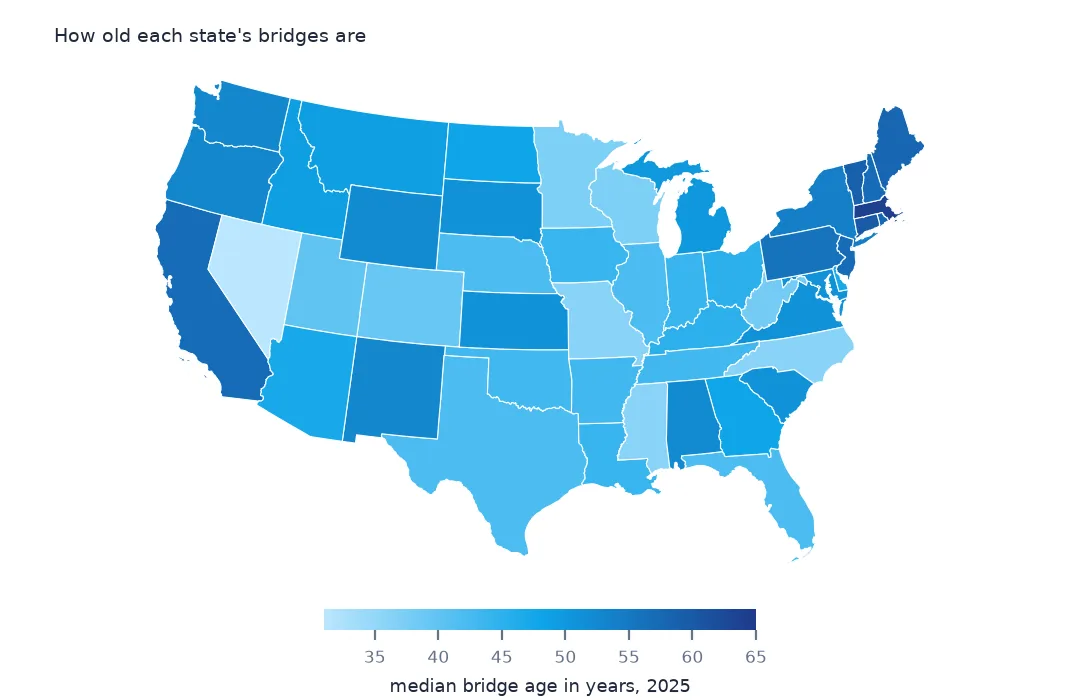
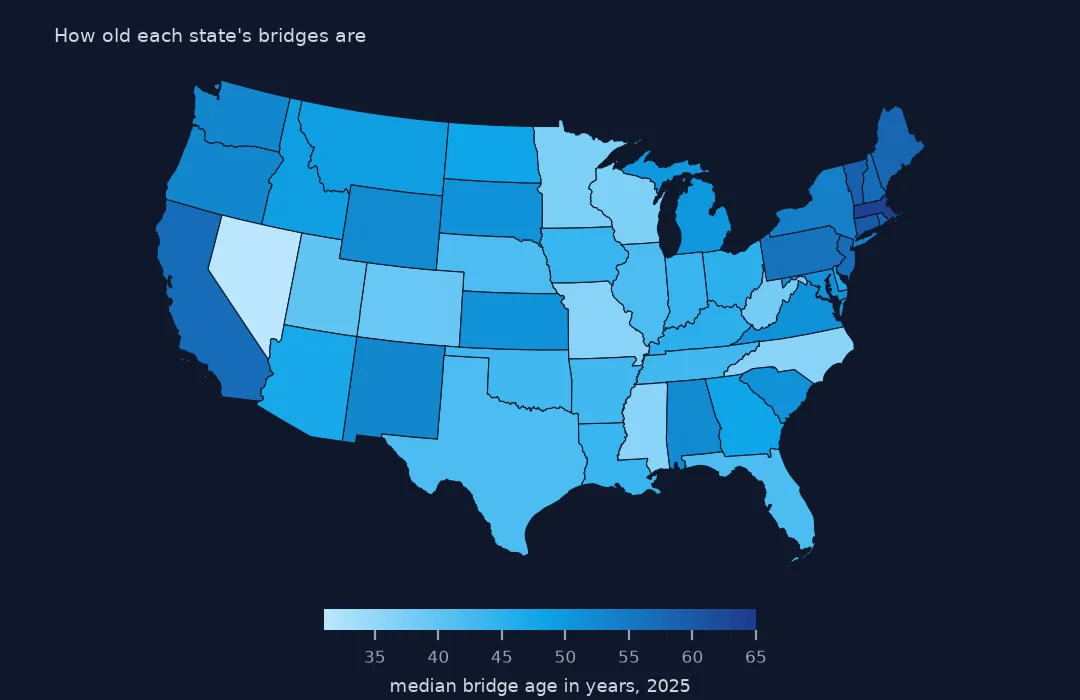
youngest median age: {'NV': 31.0, 'NC': 36.0, 'MS': 36.0, 'MO': 36.0} | oldest: {'HI': 60.0, 'CT': 60.0, 'MA': 64.0, 'DC': 65.0}
Nevada's bridges are the youngest (median 31 years), with North Carolina, Mississippi and Missouri next; DC's are the oldest (65), with Massachusetts, Connecticut and Hawaii around 60.
Example 2: what is being built now
new = nbi[nbi.built >= 2015]
KIND = {"1": "concrete", "2": "concrete", "3": "steel", "4": "steel", "5": "prestressed concrete", "6": "prestressed concrete",
        "7": "timber", "8": "masonry", "9": "other metal", "0": "other"}
print("bridges built 2015 or later by material:", new.STRUCTURE_KIND_043A.map(KIND).value_counts(normalize=True).round(3).to_dict())
bridges built 2015 or later by material: {'prestressed concrete': 0.445, 'concrete': 0.338, 'steel': 0.194, 'other metal': 0.014, 'timber': 0.007, 'other': 0.002}
Bridges built since 2015 are mostly prestressed concrete (44.5%) and concrete (33.8%), with steel at 19.4%; timber is under 1%.
Age is a proxy, not a cause
Bridges deteriorate from use, water, salt and freeze–thaw cycles, and age stands in for the accumulated exposure. Design life for a modern bridge is typically 75 years or more, older bridges were designed to lighter loads, and materials matter: timber and older steel deteriorate faster than prestressed concrete. That is why condition falls with age on average but varies widely within each age band.
The year built is when the original structure opened; a bridge with a new deck may keep its year built and record the work as reconstruction, or not, depending on the state's interpretation. Treat the reconstruction year as a lower bound on renewal.
Pitfalls with years
- Zero means never. A reconstruction year of 0 is not year zero; replace it before computing gaps.
- Inventory year. Age is relative to the file's year; use 2025 for the 2025 file.
- Survivorship. The decades count bridges still standing; demolished bridges from the 1930s are not in the file, so older decades look smaller than they were.
- Culverts are in the counts; filter
CULVERT_COND_062 == "N"for bridges only.
Internal links
- Bridge condition ratings explained — the scale behind Good, Fair and Poor
- How to analyse power plant retirements — the age of another infrastructure fleet
- How to find the counties with the most poor bridges — where the old bridges are
FAQ
How old is the average US bridge?
The median highway bridge in the 2025 inventory is 46 years old, or 38 if reconstruction counts as a new start.
What is the oldest bridge in the National Bridge Inventory?
The Frankford Avenue bridge over Pennypack Creek in Philadelphia, built in 1697.