
How to Find the Counties with the Most Bridges in Poor Condition
On this page
Problem statement
Which places have the worst bridges? The answer depends on the measure. Ranked by the number of poor bridges, big urban counties lead because they have so many bridges; ranked by share, small rural counties lead; per person, it is farm counties with hundreds of bridges and few residents. This guide aggregates the 2025 National Bridge Inventory to counties, joins Census boundaries and population, and compares the rankings — and the county codes that do not join.
Quick answer
Build a five-digit county FIPS code from STATE_CODE_001 and the zero-padded COUNTY_CODE_003, group by it, and compute the count and share of bridges whose BRIDGE_CONDITION is P. Show the share only for counties with enough bridges to be stable.
nbi["fips"] = nbi.STATE_CODE_001 + nbi.COUNTY_CODE_003.str.zfill(3)
cty = nbi.groupby("fips").agg(bridges=("cond", "size"), poor=("cond", lambda s: (s == "P").sum()),
                              poor_area=("area", lambda a: a[nbi.loc[a.index, "cond"] == "P"].sum()), area=("area", "sum"))
cty["share"] = cty.poor / cty.bridges
cty = cty.join(counties.set_index("GEOID")[["NAME", "STUSPS"]], how="left")
print(f"{len(cty):,} counties with bridges; median share poor {cty.share.median():.1%}")
print(cty[cty.bridges >= 100].nlargest(6, "share")[["NAME", "STUSPS", "bridges", "poor", "share"]].round(3).to_string())
3,216 counties with bridges; median share poor 5.3%
NAME STUSPS bridges poor share
fips
19003 Adams IA 185 85 0.459
19127 Marshall IA 303 130 0.429
19159 Ringgold IA 215 88 0.409
19053 Decatur IA 199 78 0.392
19157 Poweshiek IA 243 95 0.391
19173 Taylor IA 220 81 0.368
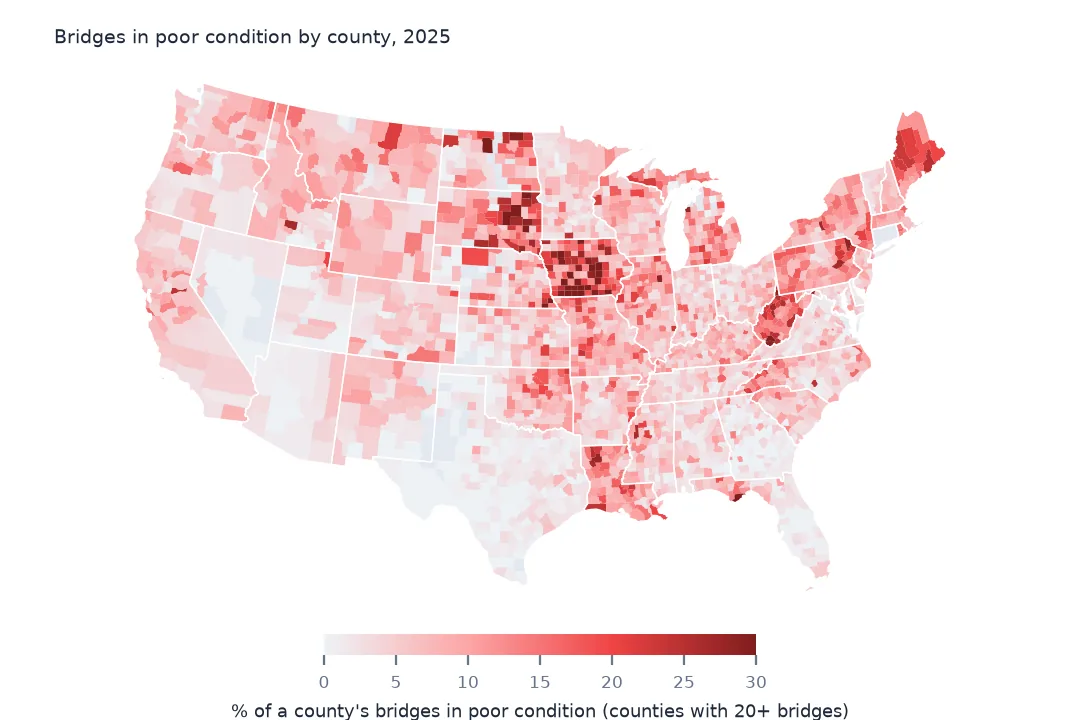
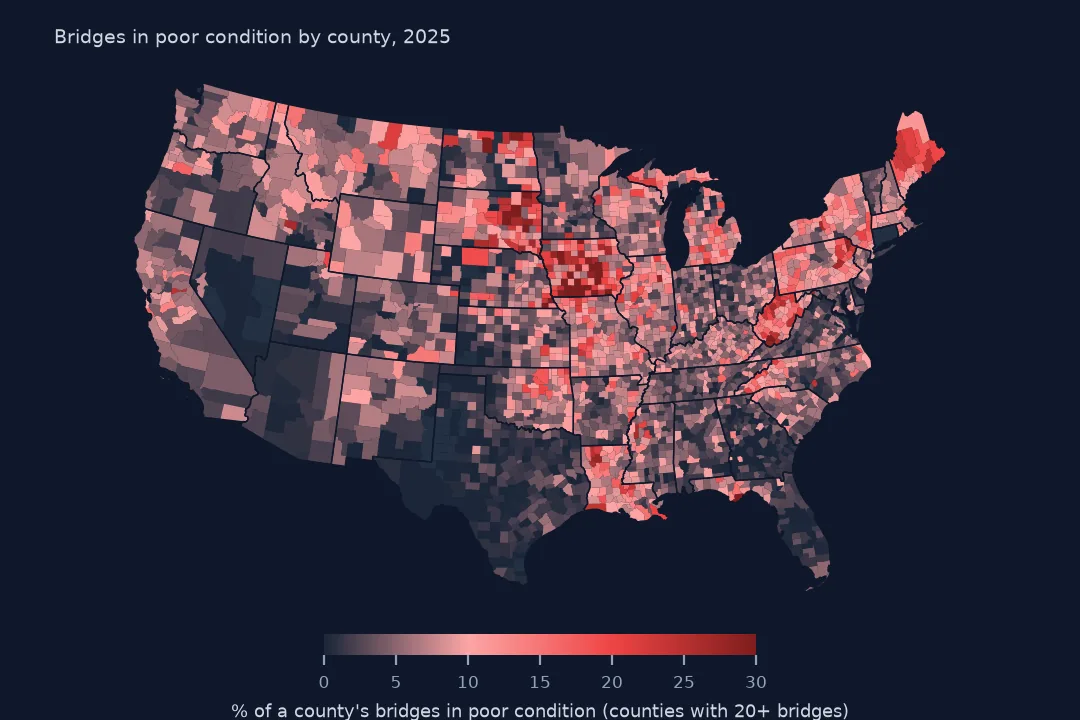
The median county has 5.3% of its bridges in poor condition. Among counties with at least 100 bridges, the six highest shares are all in Iowa, led by Adams County with 85 of 185 bridges poor (0.459).
Counting, sharing and normalising
1. Build the county code
print(f"county codes matching a Census county: {cty.index.isin(counties.GEOID).mean():.1%}")
print("unmatched examples:", cty.index[~cty.index.isin(counties.GEOID)][:6].tolist())
county codes matching a Census county: 99.7%
unmatched examples: ['09001', '09003', '09005', '09007', '09009', '09011']
99.7% of the county codes match a 2023 Census county. The exceptions are Connecticut's: the bridge file still uses the eight historic counties, while the Census Bureau switched to planning regions in 2022. Connecticut needs a crosswalk or a state-level treatment.
2. Count, share or area
rank = pd.DataFrame({"count": cty.poor.rank(ascending=False), "share": cty.share.rank(ascending=False),
                     "area": (cty.poor_area / cty.area).rank(ascending=False)})
print(f"rank correlation, share against count: {rank['count'].corr(rank['share'], method='spearman'):.2f}; share against area share: "
      f"{rank['share'].corr(rank['area'], method='spearman'):.2f}")
print("most poor bridges by count:", cty.nlargest(5, "poor")[["NAME", "STUSPS", "poor"]].values.tolist())
rank correlation, share against count: 0.74; share against area share: 0.82
most poor bridges by count: [['Cook', 'IL', 246], ['Marshall', 'IA', 130], ['Allegheny', 'PA', 120], ['Wayne', 'MI', 116], ['Jasper', 'IA', 108]]
Ranking by count picks different counties from ranking by share (rank correlation 0.74): Cook County, Illinois, has the most poor bridges (246) because it has so many bridges, while its share is unremarkable. Share by count and share by deck area agree more closely (0.82).
3. Small counties swing
small = cty[cty.bridges < 20]
print(f"counties with fewer than 20 bridges: {len(small):,}; share of them at 0% or above 30% poor: "
      f"{((small.share == 0) | (small.share > 0.3)).mean():.1%}")
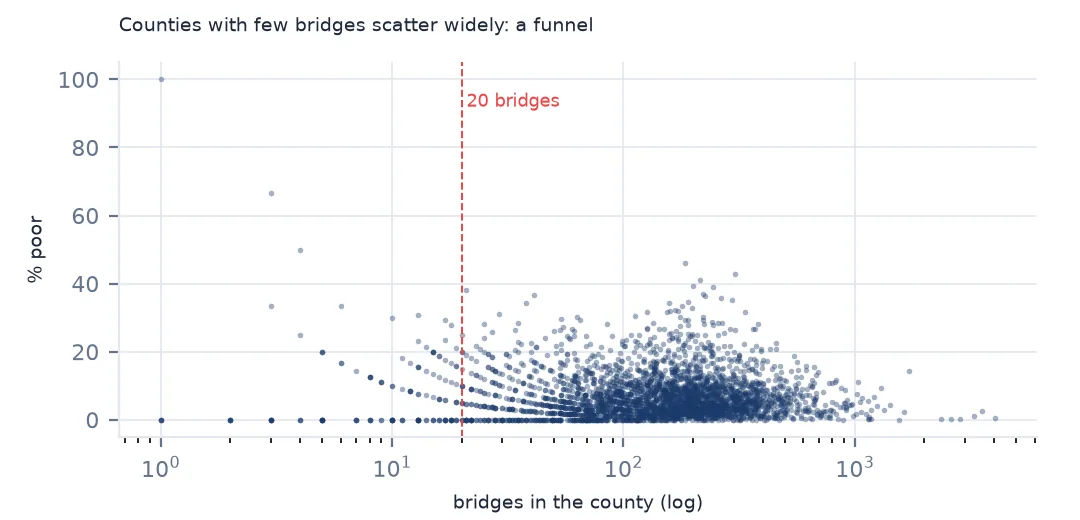
counties with fewer than 20 bridges: 143; share of them at 0% or above 30% poor: 57.3%
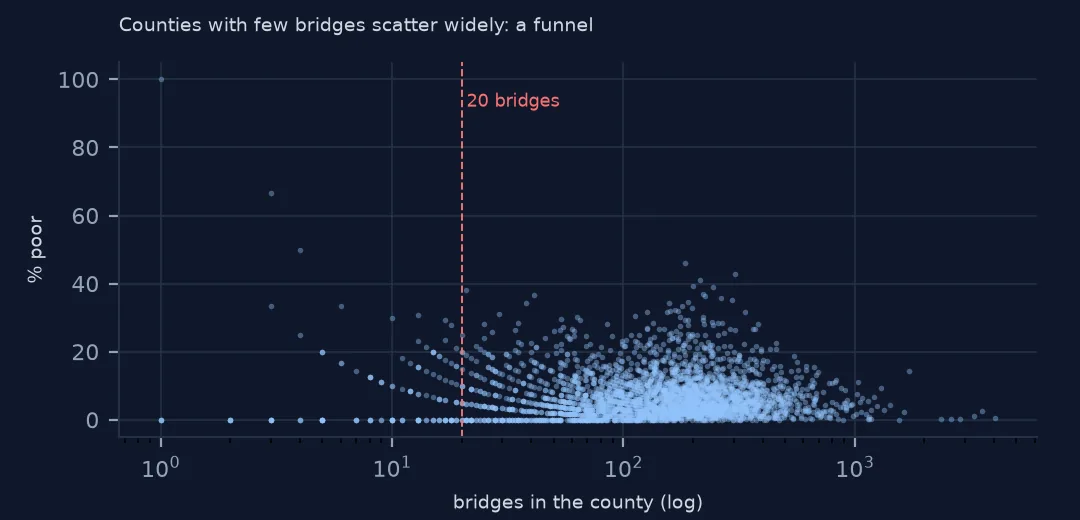
Among the 143 counties with fewer than 20 bridges, 57.3% sit at the extremes — no poor bridges at all, or more than 30% poor. With so few bridges, one inspection changes the share by several points; map shares only above a minimum count.
4. Per person
pop = pd.read_csv("data/co-est2024-alldata.csv", encoding="latin-1", dtype={"STATE": str, "COUNTY": str})
pop = pop[pop.SUMLEV == 50].assign(fips=lambda d: d.STATE + d.COUNTY).set_index("fips").POPESTIMATE2024
cty = cty.join(pop.rename("pop"))
cty["poor_per_10k"] = cty.poor / cty["pop"] * 1e4
print("poor bridges per 10,000 people, highest (counties over 10,000 people):",
      cty[cty["pop"] > 10_000].nlargest(5, "poor_per_10k")[["NAME", "STUSPS", "poor_per_10k"]].round(1).values.tolist())
poor bridges per 10,000 people, highest (counties over 10,000 people): [['Guthrie', 'IA', 87.2], ['Cass', 'IA', 79.9], ['Chickasaw', 'IA', 68.3], ['Tama', 'IA', 63.9], ['Grundy', 'IA', 62.1]]
Per person the picture is again Iowa: Guthrie County has 87.2 poor bridges per 10,000 residents, and the next four are Iowa counties too. These are farm counties with dense grids of county roads crossing creeks, many small old bridges, and few people to pay for them.
States, and rural against urban
The data used on this page
The Federal Highway Administration's National Bridge Inventory for 2025, Census Bureau 2023 cartographic boundary counties and states, and the Census Bureau's July 2024 county population estimates.
import zipfile
from pathlib import Path

import geopandas as gpd
import numpy as np
import pandas as pd
import requests

Path("data").mkdir(exist_ok=True)
# FHWA National Bridge Inventory, 2025 submission, highway bridges, all states in one comma-delimited file (53 MB zip).
# The server is slow and drops long downloads, so resume until the file is complete.
URL = "https://www.fhwa.dot.gov/bridge/nbi/2025hwybronefiledel.zip"
f = Path("data/2025hwybronefiledel.zip")
size = int(requests.head(URL, allow_redirects=True, timeout=60).headers["Content-Length"])
while not f.exists() or f.stat().st_size < size:
    have = f.stat().st_size if f.exists() else 0
    try:
        with requests.get(URL, headers={"Range": f"bytes={have}-"}, stream=True, timeout=120) as r, open(f, "ab") as out:
            for chunk in r.iter_content(1 << 20):
                out.write(chunk)
    except requests.RequestException:
        pass                                                   # resume from what arrived
with zipfile.ZipFile(f) as z:
    nbi = pd.read_csv(z.open("2025HwyBridgesDelimitedAllStates.txt"), quotechar="'", dtype=str, low_memory=False)


def dms(s, west=False):
    """NBI packs coordinates as DDMMSSss (latitude) and DDDMMSSss (longitude, positive west)."""
    s = s.str.strip().str.zfill(9 if west else 8)
    d = s.str[:-6].astype(float) + s.str[-6:-4].astype(float) / 60 + s.str[-4:].astype(float) / 100 / 3600
    return -d if west else d


nbi["lat"], nbi["lon"] = dms(nbi.LAT_016), dms(nbi.LONG_017, west=True)
nbi["cond"] = nbi.BRIDGE_CONDITION                                   # G, F or P, derived by FHWA
nbi["adt"] = pd.to_numeric(nbi.ADT_029, errors="coerce")
nbi["built"] = pd.to_numeric(nbi.YEAR_BUILT_027, errors="coerce")
nbi["area"] = pd.to_numeric(nbi.DECK_AREA, errors="coerce")
for name in ["cb_2023_us_state_20m.zip"]:
    if not Path(f"data/{name}").exists():
        Path(f"data/{name}").write_bytes(requests.get(f"https://www2.census.gov/geo/tiger/GENZ2023/shp/{name}", timeout=300).content)
states = gpd.read_file("data/cb_2023_us_state_20m.zip").to_crs(4326)
nbi["state"] = nbi.STATE_CODE_001.map(states.set_index("STATEFP").STUSPS)
for name, url in {"cb_2023_us_county_20m.zip": "https://www2.census.gov/geo/tiger/GENZ2023/shp/cb_2023_us_county_20m.zip",
                  "co-est2024-alldata.csv": "https://www2.census.gov/programs-surveys/popest/datasets/2020-2024/counties/totals/co-est2024-alldata.csv"}.items():
    if not Path(f"data/{name}").exists():
        Path(f"data/{name}").write_bytes(requests.get(url, timeout=300).content)
counties = gpd.read_file("data/cb_2023_us_county_20m.zip")
print(f"{len(nbi):,} highway bridges, {nbi.shape[1]} fields, {nbi.STATE_CODE_001.nunique()} state codes")
624,193 highway bridges, 130 fields, 53 state codes
Example 1: states
st = nbi.groupby("state").cond.apply(lambda s: (s == "P").mean()).sort_values()
print("lowest share poor:", st.head(4).round(3).to_dict(), "| highest:", st.tail(4).round(3).to_dict())
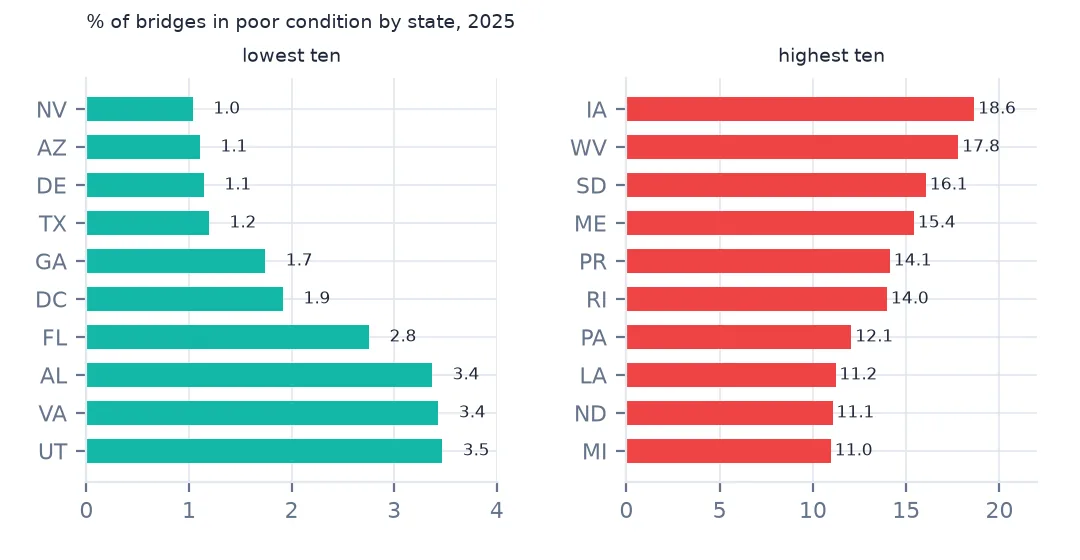
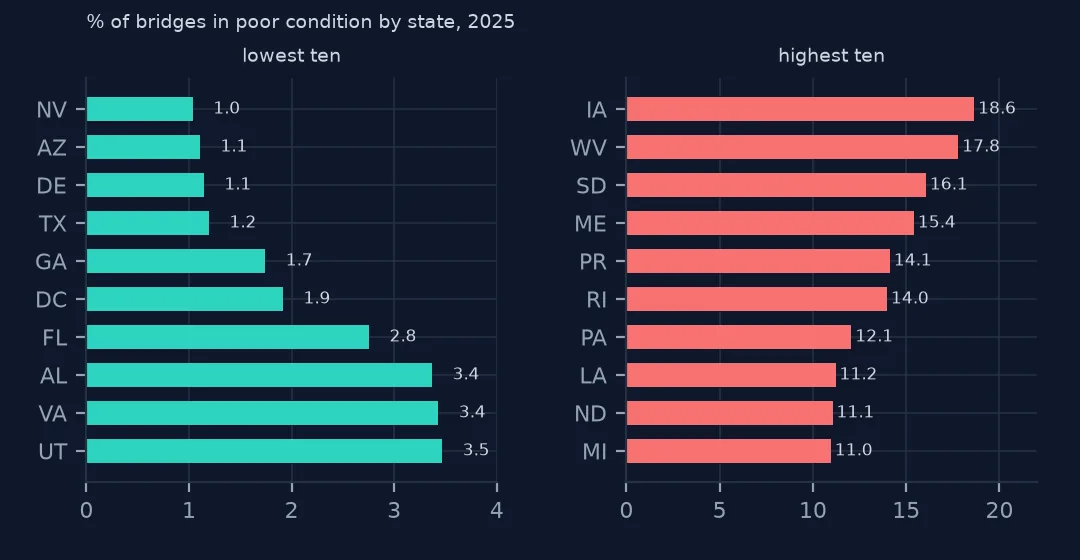
lowest share poor: {'NV': 0.01, 'AZ': 0.011, 'DE': 0.011, 'TX': 0.012} | highest: {'ME': 0.154, 'SD': 0.161, 'WV': 0.178, 'IA': 0.186}
Nevada (1.0%), Arizona, Delaware and Texas (1.2%) have the lowest shares of poor bridges; Iowa (18.6%), West Virginia, South Dakota and Maine the highest. Climate, age and ownership all plausibly contribute; Nevada also has the youngest bridges by median age (how old America's bridges are).
Example 2: rural or urban
fc = pd.to_numeric(nbi.FUNCTIONAL_CLASS_026, errors="coerce")
urban = fc >= 11                                           # 01-09 rural, 11-19 urban
print("share poor, rural bridges:", round((nbi.cond[~urban] == "P").mean(), 3), "| urban:", round((nbi.cond[urban] == "P").mean(), 3))
share poor, rural bridges: 0.076 | urban: 0.046
Rural bridges are poor more often than urban ones: 7.6% against 4.6%.
Which ranking to publish
Each measure answers a different question. The count of poor bridges is the size of the repair backlog a county faces; the share describes the condition of its stock; poor bridges per person is a rough measure of the burden on local taxpayers, since county and township roads are paid for locally. A responsible map shows the share, with a minimum number of bridges, and gives the count alongside.
The Iowa result is robust across all three per-bridge and per-person measures and is well known to the state: a dense network of small county bridges on low-traffic farm roads, many of them old.
Pitfalls in county aggregation
- Zero-pad the county code.
COUNTY_CODE_003may come without leading zeros;zfill(3)before concatenating. - Connecticut's counties no longer exist in Census geography; aggregate Connecticut by state, or map bridge points to planning regions spatially.
- Independent cities in Virginia have their own codes and are often tiny; they swing in share rankings.
- Bridges on borders are coded to one county even when they cross to another.
Internal links
- Bridge condition ratings explained — what Poor means
- How to weigh bridge condition by traffic — crossings, not counts
- How to count the people living in drought — another county exposure measure
FAQ
Which county has the most bridges in poor condition?
By count, Cook County, Illinois (246 in 2025). By share among counties with 100 or more bridges, Adams County, Iowa (0.459).
Which state has the worst bridges?
Iowa had the highest share in poor condition in 2025 (18.6%), then West Virginia, South Dakota and Maine.