
How to Analyse Load-Posted and Closed Bridges in the NBI
On this page
Problem statement
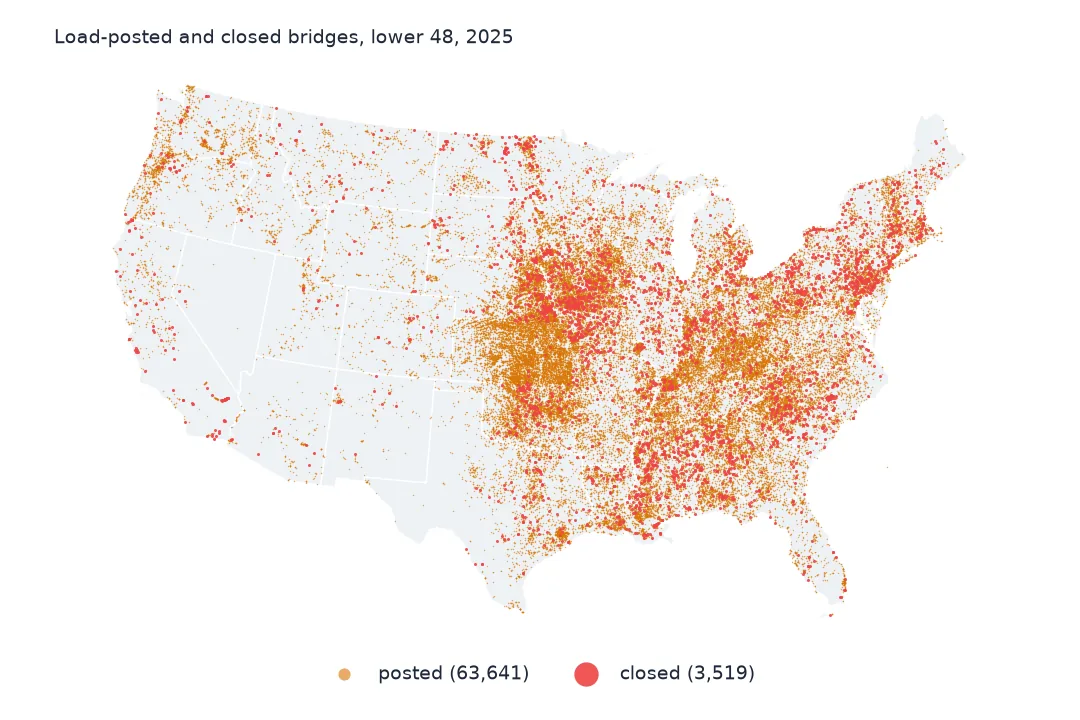
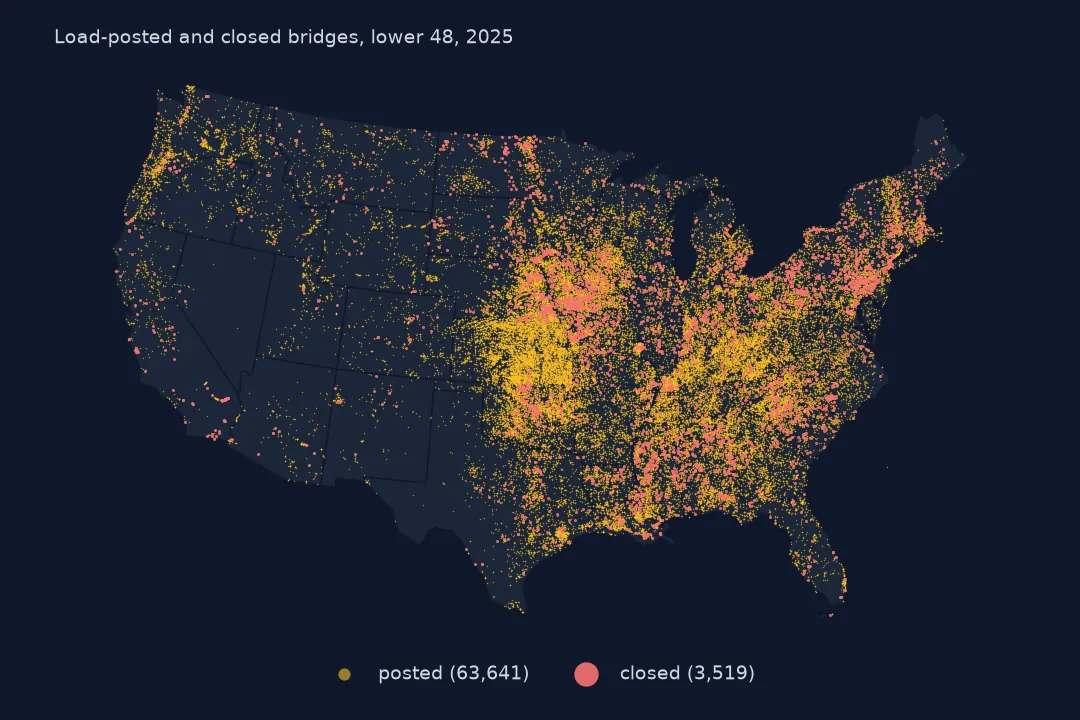
A bridge that cannot safely carry legal truck loads gets a sign: a weight limit, a lane restriction, or a closure. The National Bridge Inventory records which state each bridge is in, open, posted or closed, in a one-letter code. Posted bridges matter for freight routes, school buses, fire engines and farm equipment, and the detour when one closes can be long in rural areas. This guide counts posted and closed bridges in the 2025 inventory by owner, state and material, measures their traffic and detours, and relates posting to condition.
Quick answer
Map OPEN_CLOSED_POSTED_041 (upper-cased) through its code list: A open, P posted for load, R other restriction, K closed, and four rarer codes. Posted bridges are P and R together.
POST = {"A": "open", "B": "open, would be posted", "D": "open, temporary shoring", "E": "open, temporary structure",
        "G": "new, not yet open", "K": "closed", "P": "posted for load", "R": "posted, other restriction"}
s = nbi.OPEN_CLOSED_POSTED_041.str.upper().map(POST)
t = s.value_counts()
print(pd.DataFrame({"bridges": t, "share": (t / t.sum()).round(4)}).to_string())
bridges share
OPEN_CLOSED_POSTED_041
open 553840 0.8873
posted for load 62441 0.1000
closed 3587 0.0057
posted, other restriction 2112 0.0034
open, temporary shoring 791 0.0013
open, would be posted 605 0.0010
open, temporary structure 465 0.0007
new, not yet open 352 0.0006
88.73% of bridges are open without restriction. 62,441 (10.00%) are posted for load and 2,112 have other restrictions; 3,587 are closed. A few hundred carry temporary shoring or are temporary structures, and 352 are new and not yet open.
Who posts bridges, and what it costs
1. Codes and a lower-case one
print("raw codes:", nbi.OPEN_CLOSED_POSTED_041.value_counts().to_dict())raw codes: {'A': 553839, 'P': 62441, 'K': 3587, 'R': 2112, 'D': 791, 'B': 605, 'E': 465, 'G': 352, 'a': 1}
One bridge is coded with a lower-case a; without .str.upper() it would fall out of every count. Small as it is, it is the kind of inconsistency that makes a total disagree with a published one.
2. Posted bridges by owner
OWN = {"01": "state highway agency", "02": "county", "03": "town or township", "04": "city or municipal"}
own = nbi.OWNER_022.str.strip().map(OWN).fillna("other")
posted = nbi.OPEN_CLOSED_POSTED_041.str.upper().isin(["P", "R"])
print("share posted by owner:", posted.groupby(own).mean().sort_values(ascending=False).round(3).to_dict())
print("posted bridges by owner:", posted.groupby(own).sum().sort_values(ascending=False).to_dict())
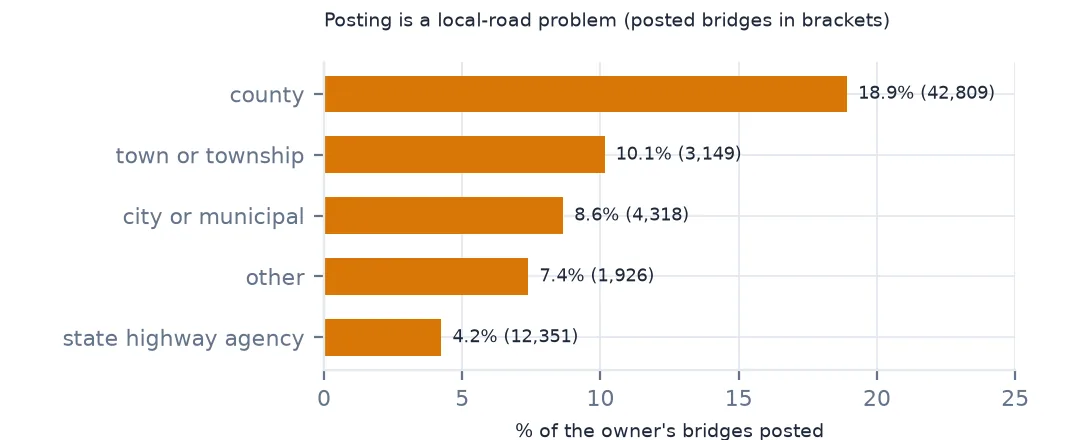
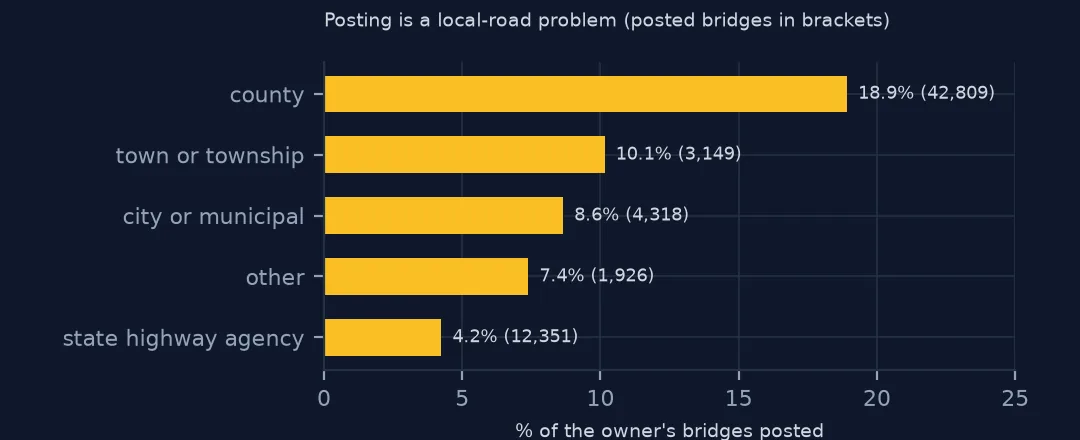
share posted by owner: {'county': 0.189, 'town or township': 0.101, 'city or municipal': 0.086, 'other': 0.074, 'state highway agency': 0.042}
posted bridges by owner: {'county': 42809, 'state highway agency': 12351, 'city or municipal': 4318, 'town or township': 3149, 'other': 1926}
Posting is a local-road problem. 18.9% of county-owned bridges are posted, against 4.2% of state-owned ones; counties own 42,809 of the posted bridges, states 12,351.
3. Posted bridges and detours
det = pd.to_numeric(nbi.DETOUR_KILOS_019, errors="coerce")
print(f"median detour if a posted bridge were closed: {det[posted].median():.0f} km; over 30 km: {(det[posted] > 30).mean():.1%}")
print(f"posted bridges' median daily traffic: {nbi.adt[posted].median():.0f} vehicles (all bridges: {nbi.adt.median():.0f})")
median detour if a posted bridge were closed: 6 km; over 30 km: 14.3%
posted bridges' median daily traffic: 115 vehicles (all bridges: 954)
If a posted bridge had to close, the median detour would be 6 km, but 14.3% would force a detour of more than 30 km. Posted bridges carry little traffic — a median of 115 vehicles a day, against 954 for all bridges — which is why many stay posted for years rather than being replaced.
4. Condition of posted and closed bridges
k = nbi.OPEN_CLOSED_POSTED_041.str.upper()
print(pd.crosstab(k.where(k.isin(["A", "P", "K"])), nbi.cond, normalize="index").round(3).to_string())
cond F G P
OPEN_CLOSED_POSTED_041
A 0.486 0.479 0.035
K 0.169 0.045 0.786
P 0.608 0.111 0.281
78.6% of closed bridges are rated poor, and 28.1% of posted bridges; most posted bridges (60.8%) are fair. A bridge is posted because its load rating — a structural calculation — falls below legal loads, which can happen to a fair bridge built for lighter trucks.
States and timber
The data used on this page
The Federal Highway Administration's National Bridge Inventory for 2025: the open/posted/closed status, owner, detour length and traffic items, and Census Bureau 2023 states.
import zipfile
from pathlib import Path

import geopandas as gpd
import numpy as np
import pandas as pd
import requests

Path("data").mkdir(exist_ok=True)
# FHWA National Bridge Inventory, 2025 submission, highway bridges, all states in one comma-delimited file (53 MB zip).
# The server is slow and drops long downloads, so resume until the file is complete.
URL = "https://www.fhwa.dot.gov/bridge/nbi/2025hwybronefiledel.zip"
f = Path("data/2025hwybronefiledel.zip")
size = int(requests.head(URL, allow_redirects=True, timeout=60).headers["Content-Length"])
while not f.exists() or f.stat().st_size < size:
    have = f.stat().st_size if f.exists() else 0
    try:
        with requests.get(URL, headers={"Range": f"bytes={have}-"}, stream=True, timeout=120) as r, open(f, "ab") as out:
            for chunk in r.iter_content(1 << 20):
                out.write(chunk)
    except requests.RequestException:
        pass                                                   # resume from what arrived
with zipfile.ZipFile(f) as z:
    nbi = pd.read_csv(z.open("2025HwyBridgesDelimitedAllStates.txt"), quotechar="'", dtype=str, low_memory=False)


def dms(s, west=False):
    """NBI packs coordinates as DDMMSSss (latitude) and DDDMMSSss (longitude, positive west)."""
    s = s.str.strip().str.zfill(9 if west else 8)
    d = s.str[:-6].astype(float) + s.str[-6:-4].astype(float) / 60 + s.str[-4:].astype(float) / 100 / 3600
    return -d if west else d


nbi["lat"], nbi["lon"] = dms(nbi.LAT_016), dms(nbi.LONG_017, west=True)
nbi["cond"] = nbi.BRIDGE_CONDITION                                   # G, F or P, derived by FHWA
nbi["adt"] = pd.to_numeric(nbi.ADT_029, errors="coerce")
nbi["built"] = pd.to_numeric(nbi.YEAR_BUILT_027, errors="coerce")
nbi["area"] = pd.to_numeric(nbi.DECK_AREA, errors="coerce")
for name in ["cb_2023_us_state_20m.zip"]:
    if not Path(f"data/{name}").exists():
        Path(f"data/{name}").write_bytes(requests.get(f"https://www2.census.gov/geo/tiger/GENZ2023/shp/{name}", timeout=300).content)
states = gpd.read_file("data/cb_2023_us_state_20m.zip").to_crs(4326)
nbi["state"] = nbi.STATE_CODE_001.map(states.set_index("STATEFP").STUSPS)
print(f"{len(nbi):,} highway bridges, {nbi.shape[1]} fields, {nbi.STATE_CODE_001.nunique()} state codes")
624,193 highway bridges, 130 fields, 53 state codes
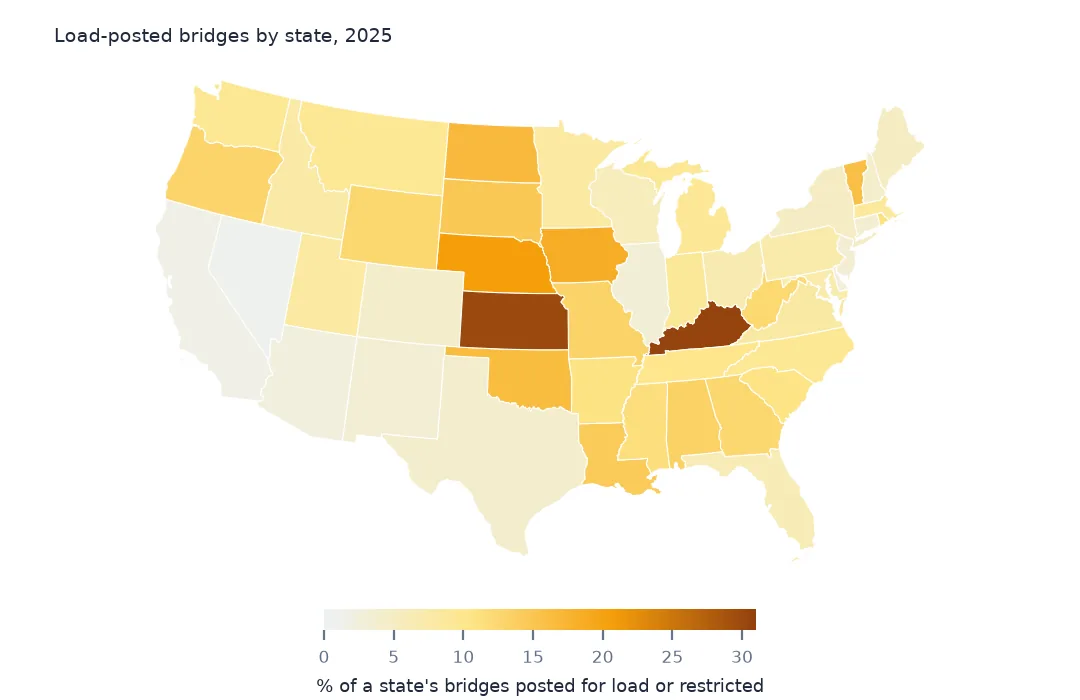
Example 1: states with the most posted bridges
st = posted.groupby(nbi.state).agg(["sum", "mean"]).sort_values("sum", ascending=False)
print(st.head(6).round(3).to_string())
sum mean
state
KS 7461 0.300
KY 4443 0.305
IA 4378 0.185
OK 3769 0.164
MO 3198 0.130
NE 3179 0.206
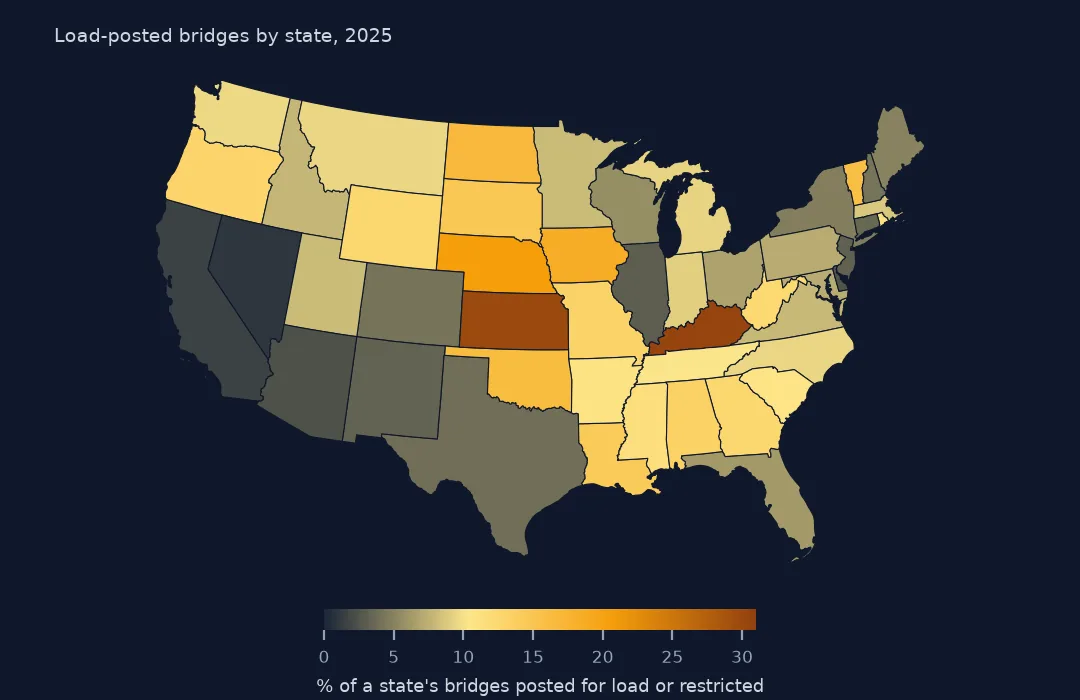
Kansas has the most posted bridges (7,461, 30.0% of its bridges) and Kentucky the highest share in this list (30.5%), followed by Iowa, Oklahoma, Missouri and Nebraska — Plains and Midwest states with large county road networks.
Example 2: timber bridges
timber = nbi.STRUCTURE_KIND_043A == "7"
print(f"timber bridges: {timber.sum():,}; share posted {posted[timber].mean():.1%} against {posted[~timber].mean():.1%} for the rest")
timber bridges: 14,853; share posted 45.7% against 9.5% for the rest
Timber bridges are posted far more often: 45.7% of the 14,853 timber bridges, against 9.5% of the rest.
Posting is about load, not condition
Every bridge has a load rating: the heaviest vehicle it can carry safely, calculated from its design and current condition. When that rating falls below the legal load limits for the road, the owner must post a lower limit or close the bridge. Posting therefore follows strength, which depends on original design as much as deterioration — a 1930s bridge designed for lighter trucks may be posted while in fair condition.
That is why posting is concentrated on county roads and older, smaller structures, and why the count of posted bridges is a useful complement to Good/Fair/Poor: it measures how much of the network cannot carry today's legal loads.
Pitfalls with item 41
- Upper-case the codes before mapping them.
- B ("would be posted") marks bridges that should be posted but are not; include it in a strict count.
- Detour length is coded in kilometres and is 0 or very large for some bridges; check the distribution before averaging.
- G (new, not yet open) bridges are in the inventory; leave them out of condition statistics.
Internal links
- Bridge condition ratings explained — condition against posting
- How to find scour-critical bridges — another reason to close a bridge
- How to map the National Bridge Inventory — the whole fleet
FAQ
How many US bridges are load posted?
62,441 posted for load in the 2025 inventory (10.00%), plus 2,112 with other restrictions; 3,587 were closed.
Who owns most posted bridges?
Counties: 42,809 of the posted bridges, against 12,351 owned by state highway agencies.