
How to Map Toxic Air Releases per Resident by County
On this page
Problem statement
Most of the toxic releases in EPA's inventory never leave the site: mine waste on land, injection wells, landfills. What reaches people most directly is air. A county map of air releases per resident shows where industrial emissions are large relative to the people living nearby, and it looks very different from a map of total releases. This page sums stack and fugitive air releases for 2024, places each facility in a county by its coordinates, divides by the 2025 population and maps the result.
Quick answer
Add stack and fugitive air, total by facility, place the facilities in counties with a spatial join, and divide by residents:
t24["air"] = pounds(t24, "5.1 - FUGITIVE AIR") + pounds(t24, "5.2 - STACK AIR")
fac = t24.groupby("TRIFD").agg(air=("air", "sum"), lat=("LATITUDE", "first"), lon=("LONGITUDE", "first"))
pts = gpd.GeoDataFrame(fac, geometry=gpd.points_from_xy(fac.lon, fac.lat), crs=4269)
j = gpd.sjoin(pts, counties.to_crs(4269)[["GEOID", "geometry"]], predicate="within")
c = pop.set_index("GEOID")[["STNAME", "CTYNAME", "POPESTIMATE2025"]].join(j.groupby("GEOID").air.sum())
c["per_person"] = c.air.fillna(0) / c.POPESTIMATE2025
print(f"air releases 2024: {t24.air.sum() / 1e6:.1f} million lb; joined to counties: {c.air.sum() / 1e6:.1f}; US per person {c.air.sum() / c.POPESTIMATE2025.sum():.2f} lb")
air releases 2024: 530.3 million lb; joined to counties: 528.0; US per person 1.54 lb
Facilities released 530.3 million lb of listed chemicals to air in 2024; 528.0 million of it falls in a county with a population estimate. That is 1.54 lb per US resident.
Air, not land, and per person
1. Air is a small part of the total
print(f"stack {pounds(t24, '5.2 - STACK AIR').sum() / 1e6:.1f}M lb, fugitive {pounds(t24, '5.1 - FUGITIVE AIR').sum() / 1e6:.1f}M lb, all releases {pounds(t24).sum() / 1e6:.1f}M lb")
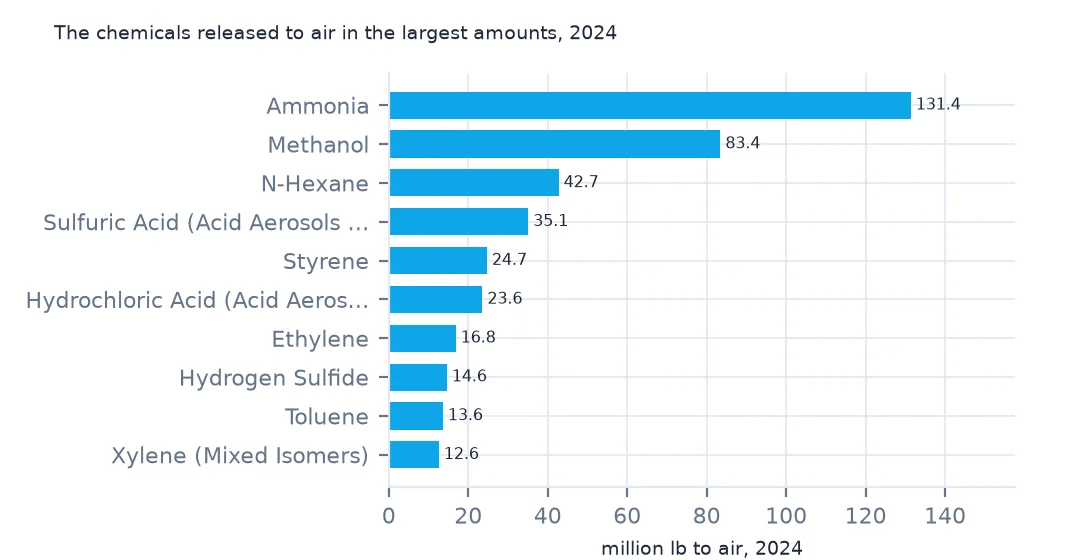
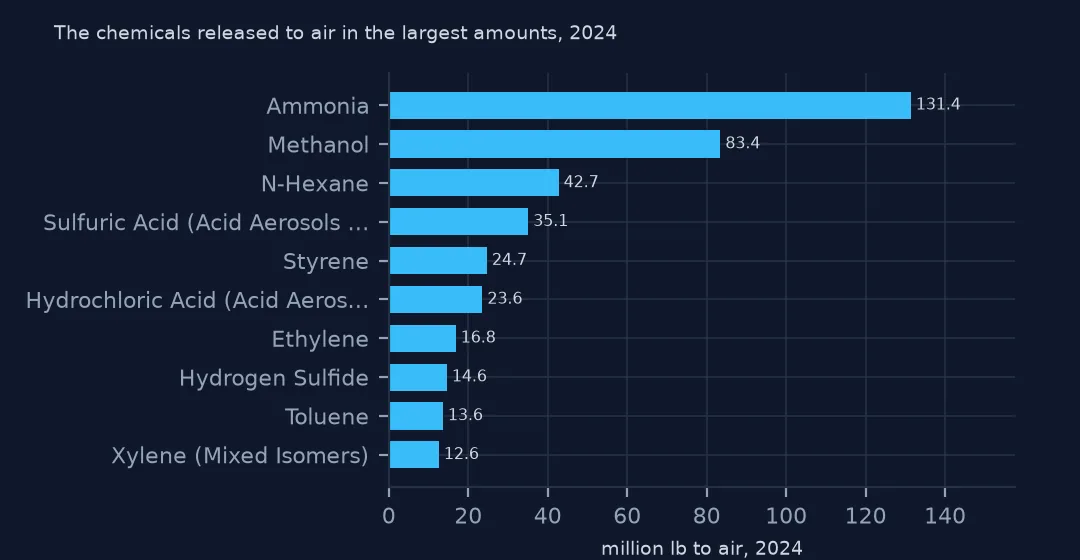
print((t24.groupby("CHEMICAL").air.sum().nlargest(5) / 1e6).round(1).to_string())
stack 383.9M lb, fugitive 146.4M lb, all releases 3290.5M lb
CHEMICAL
Ammonia 131.4
Methanol 83.4
n-Hexane 42.7
Sulfuric acid (acid aerosols including mists, vapors, gas, fog, and other airborne forms of any particle size) 35.1
Styrene 24.7
Air is 530.3 million of the 3,290.5 million lb released, stack emissions 383.9 million and fugitive leaks 146.4 million. Ammonia and methanol lead, then n-hexane, sulfuric acid aerosols and styrene.
2. The highest counties per person
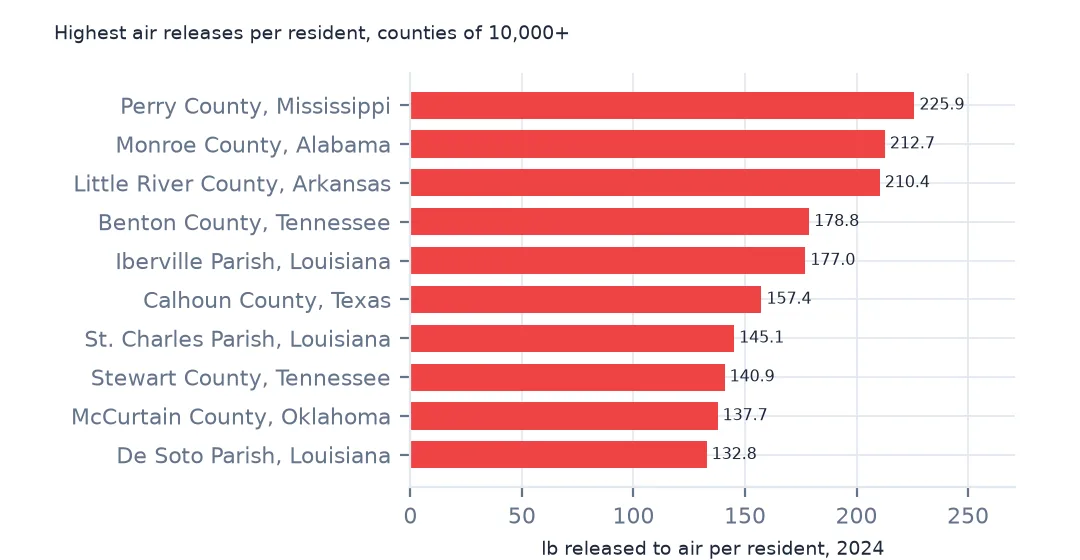
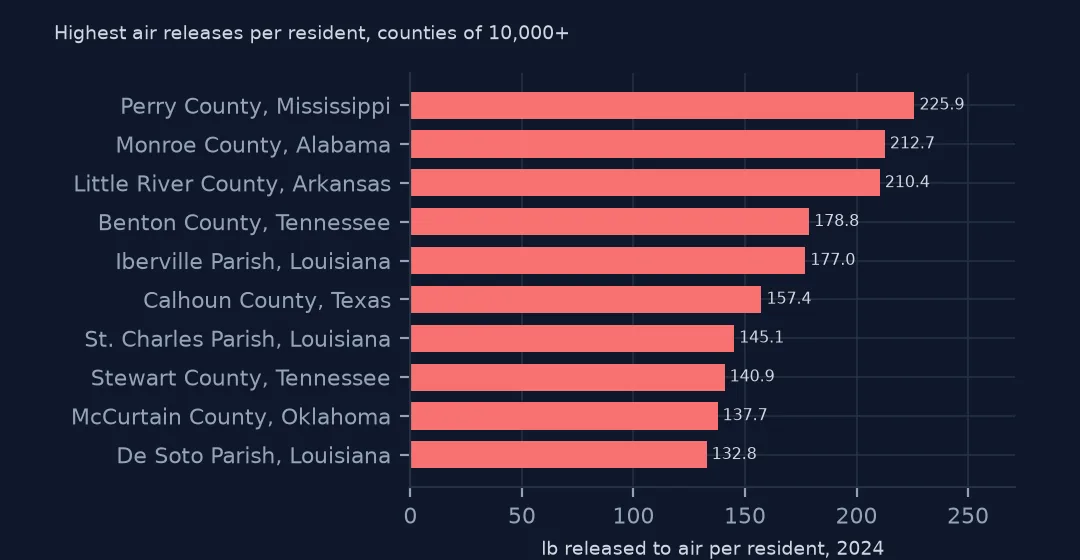
print(c[c.POPESTIMATE2025 >= 10_000].nlargest(8, "per_person")[["CTYNAME", "STNAME", "air", "per_person"]].round(1).to_string()) CTYNAME STNAME air per_person
GEOID
28111 Perry County Mississippi 2615777.3 225.9
01099 Monroe County Alabama 4033863.8 212.7
05081 Little River County Arkansas 2475423.1 210.4
47005 Benton County Tennessee 2892855.0 178.8
22047 Iberville Parish Louisiana 5236228.7 177.0
48057 Calhoun County Texas 3084767.3 157.4
22089 St. Charles Parish Louisiana 7340321.4 145.1
47161 Stewart County Tennessee 2033841.1 140.9
Among counties of 10,000 or more people, Perry County, Mississippi, has 225.9 lb per resident, Monroe County, Alabama, 212.7 and Little River County, Arkansas, 210.4, all small rural counties. Iberville and St. Charles parishes in Louisiana, on the Mississippi, also make the list.
3. Most people live where little is released
srt = c.sort_values("per_person", ascending=False)
share = srt.air.fillna(0).cumsum() / srt.air.sum()
print(f"counties holding half of air releases: {(share < 0.5).sum() + 1}, home to {srt.POPESTIMATE2025[share < 0.5].sum() / c.POPESTIMATE2025.sum():.1%} of residents")
print(f"counties with no TRI air release: {(c.air.fillna(0) == 0).sum():,}")
counties holding half of air releases: 168, home to 1.6% of residents
counties with no TRI air release: 902
Half of all air releases come from 168 counties that are home to 1.6% of US residents, and 902 counties have no reported air release at all.
States and the map
The data used on this page
The US EPA's Toxics Release Inventory basic data files for 2014 and 2024, public domain, downloaded on 16 October 2026 and saved on this site, because EPA revises past years when facilities resubmit. With them come the Census Bureau's Vintage 2025 county population estimates and 2024 county boundaries.
from pathlib import Path
import re
import zipfile

import geopandas as gpd
import numpy as np
import pandas as pd
import requests

Path("data").mkdir(exist_ok=True)
# EPA Toxics Release Inventory basic data files, reporting years 2014 and 2024, all states, xz-compressed and
# otherwise unchanged; Census Vintage 2025 county estimates and 2024 cartographic boundary counties.
# Downloaded 16 October 2026 and saved here, because EPA revises past years.
# Live: https://data.epa.gov/efservice/downloads/tri/mv_tri_basic_download/2024_US/csv (and 2014_US)
ARCHIVE = "epa-tri-2014-2024-2026-10-16.zip"
if not Path(f"data/{ARCHIVE}").exists():
    Path(f"data/{ARCHIVE}").write_bytes(requests.get(f"https://data.spatialworkflow.io/{ARCHIVE}", timeout=600).content)
Z = zipfile.ZipFile(f"data/{ARCHIVE}")


def tri(year):
    """One year's TRI file: a row per facility and chemical, columns numbered '1. YEAR' to '122. ...'."""
    d = pd.read_csv(Z.open(f"tri_{year}_us.csv.xz"), compression="xz", dtype=str, low_memory=False)
    d.columns = [re.sub(r"^\d+\.\s*", "", c) for c in d.columns]
    amounts = list(d.columns[d.columns.get_loc("5.1 - FUGITIVE AIR"):d.columns.get_loc("8.8 - ONE-TIME RELEASE") + 1])
    d[amounts + ["LATITUDE", "LONGITUDE"]] = d[amounts + ["LATITUDE", "LONGITUDE"]].apply(pd.to_numeric, errors="coerce")
    return d


def pounds(d, col="TOTAL RELEASES"):
    """A quantity in pounds: dioxin and dioxin-like compounds are reported in grams."""
    return d[col].where(d["UNIT OF MEASURE"] == "Pounds", d[col] / 453.59237)


t24 = tri(2024)
pop = pd.read_csv(Z.open("co-est2025-alldata.csv"), encoding="latin-1", dtype={"STATE": str, "COUNTY": str})
pop = pop[pop.SUMLEV == 50].assign(GEOID=lambda p: p.STATE + p.COUNTY)
Path("data/cb_2024_us_county_20m.zip").write_bytes(Z.read("cb_2024_us_county_20m.zip"))
counties = gpd.read_file("data/cb_2024_us_county_20m.zip")
print(f"TRI 2024: {len(t24):,} facility-chemical rows from {t24.TRIFD.nunique():,} facilities; {pounds(t24).sum() / 1e9:.2f} billion lb released")
TRI 2024: 77,295 facility-chemical rows from 21,482 facilities; 3.29 billion lb released
Example 1: by state
s = c.groupby("STNAME")[["air", "POPESTIMATE2025"]].sum()
s["per_person"] = s.air / s.POPESTIMATE2025
print("highest:", ", ".join(f"{k} {v:.1f}" for k, v in s.per_person.nlargest(5).items()))
print("lowest:", ", ".join(f"{k} {v:.2f}" for k, v in s.per_person.nsmallest(4).items()))
highest: North Dakota 28.2, Louisiana 11.5, Iowa 5.7, Alabama 5.4, Arkansas 4.7
lowest: District of Columbia 0.00, Vermont 0.08, New Hampshire 0.08, Massachusetts 0.09
North Dakota releases 28.2 lb of listed chemicals to air per resident, two and a half times Louisiana's 11.5; Iowa, Alabama and Arkansas follow. Vermont, New Hampshire and Massachusetts release less than a tenth of a pound per person, and Washington, DC, none.
Example 2: the map
low48 = counties[~counties.STUSPS.isin(["AK", "HI", "PR"])].to_crs(5070)
m = low48.merge(c[["per_person"]], left_on="GEOID", right_index=True, how="left")
m["cls"] = pd.cut(m.per_person, [-0.1, 0, 0.1, 1, 5, 20, 1e4])
print(m.cls.value_counts(sort=False).to_string())
ax = m.plot(column="cls", cmap="OrRd", legend=True, figsize=(10, 6))
ax.set_axis_off()
cls
(-0.1, 0.0] 887
(0.0, 0.1] 686
(0.1, 1.0] 631
(1.0, 5.0] 510
(5.0, 20.0] 246
(20.0, 10000.0] 149
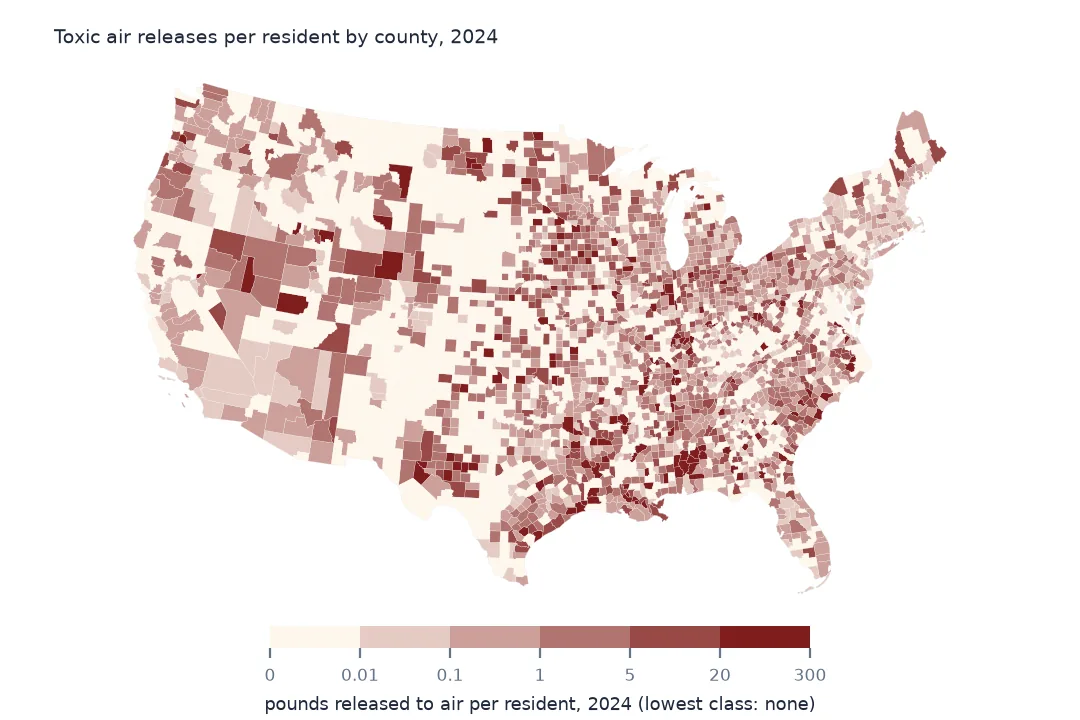
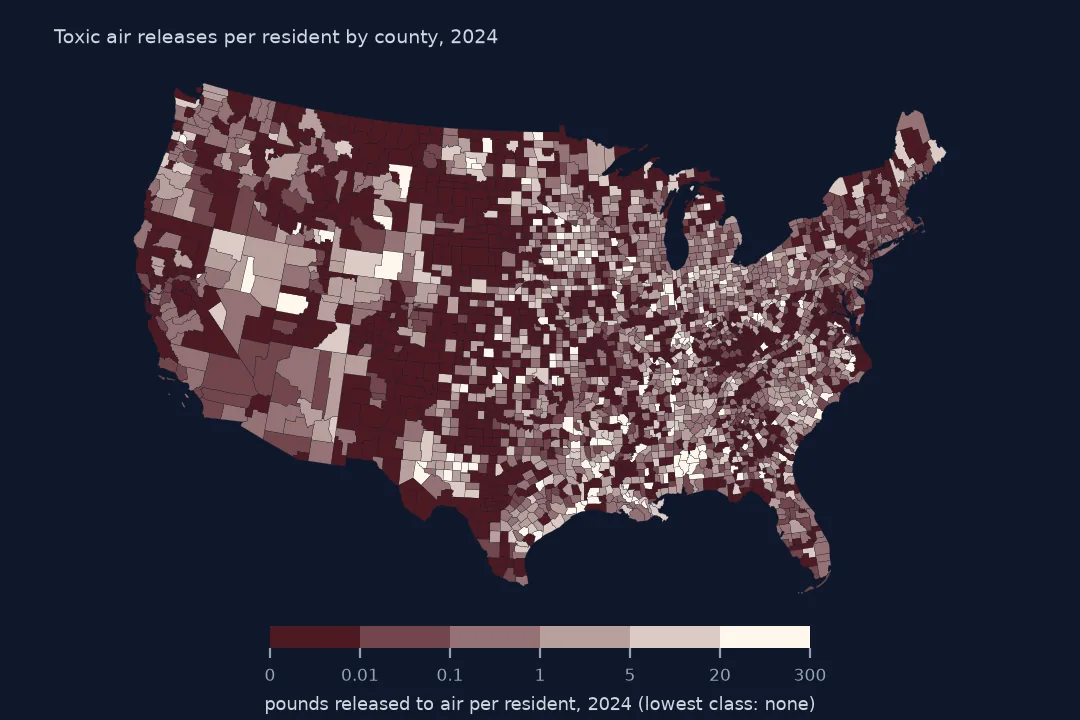
149 counties release more than 20 lb per resident and 887 none. The high counties are scattered through the rural South, the Gulf Coast and the northern Plains rather than in the big industrial cities, where large releases are divided by many people.
Internal links
- Release totals explained — air among the other routes
- Carcinogen releases — the subset that matters most for health
- Facilities by amount released — the points behind the county totals
- County names — the spatial join used here