
How to Read EPA Toxics Release Inventory Data in Python
On this page
Problem statement
Every year, US industrial facilities above a size threshold report to the Environmental Protection Agency how much of each listed toxic chemical they released to air, water and land, or sent elsewhere for disposal. The Toxics Release Inventory publishes it as one CSV per year: a row per facility and chemical, with the facility's location, industry and parent company and about seventy amount columns. The column names come numbered, the units are not all pounds, and a facility appears once per chemical. This page reads the 2024 file and shows what is in it.
Quick answer
Read everything as text, strip the numbers from the column names, convert the amount columns to numbers, and convert grams to pounds when summing. The setup below does it in tri() and pounds():
t24 = tri(2024)
print(t24[["TRIFD", "FACILITY NAME", "ST", "CHEMICAL", "UNIT OF MEASURE", "TOTAL RELEASES"]].head(3).to_string(index=False))
print(f"{len(t24):,} rows, {t24.TRIFD.nunique():,} facilities, {t24.CHEMICAL.nunique()} chemicals")
TRIFD FACILITY NAME ST CHEMICAL UNIT OF MEASURE TOTAL RELEASES
77522CHVRN9500I CHEVRON PHILLIPS CHEMICAL CO LP TX Benzene Pounds 50592.0
60110MCWHR400EA POLYNT COMPOSITES USA INC. (FORMERLY PCCR USA) IL Toluene Pounds 1119.0
03222FRDNBPOBOX FREUDENBERG-NOK SEALING TECHNOLOGIES NH Zinc compounds Pounds 2571.0
77,295 rows, 21,482 facilities, 577 chemicals
The 2024 file has 77,295 rows from 21,482 facilities and 577 chemicals. The first row is benzene from a Chevron Phillips chemical plant in Texas, 50,592 lb released.
Numbered columns, one row per chemical
1. The column names
raw = pd.read_csv(Z.open("tri_2024_us.csv.xz"), compression="xz", nrows=0)
print(list(raw.columns[:4]), list(raw.columns[50:53]), len(raw.columns))
['1. YEAR', '2. TRIFD', '3. FRS ID', '4. FACILITY NAME'] ['51. 5.1 - FUGITIVE AIR', '52. 5.2 - STACK AIR', '53. 5.3 - WATER'] 122
Every column name starts with its position, 1. YEAR to 122., and many carry the section number of EPA's Form R as well, such as 5.1 - FUGITIVE AIR. Stripping the leading position keeps the section numbers, which say what the column is.
2. Rows are facility-chemical pairs
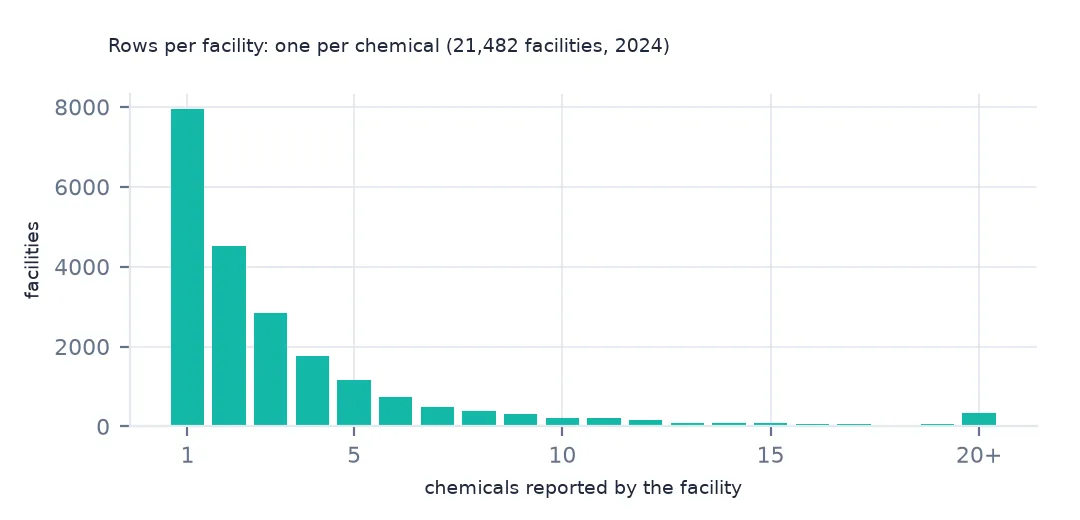
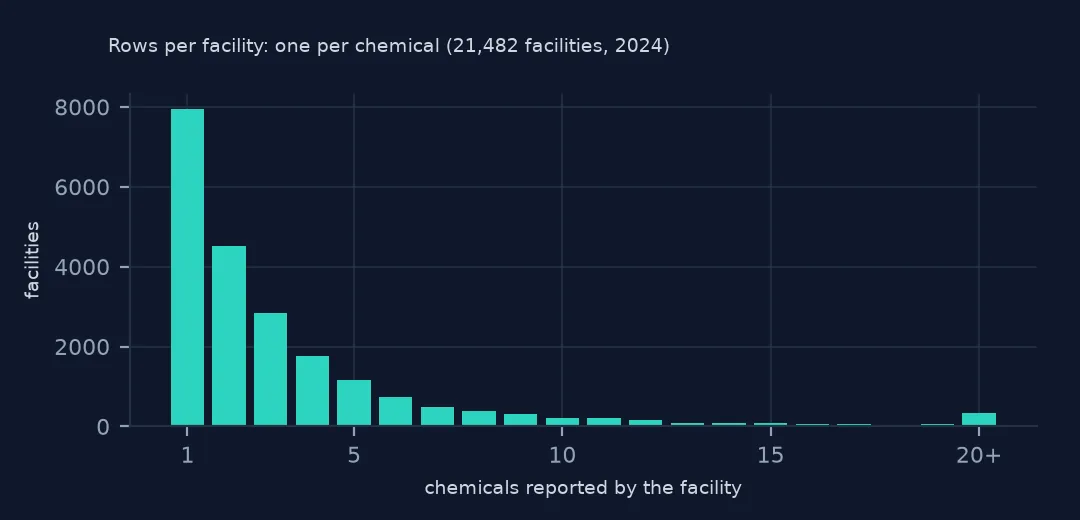
per = t24.groupby("TRIFD").CHEMICAL.nunique()
print(f"chemicals per facility: median {per.median():.0f}, max {per.max()}; facilities reporting one chemical: {(per == 1).mean():.1%}")
chemicals per facility: median 2, max 218; facilities reporting one chemical: 36.9%
A facility reports each chemical separately: the median facility has 2 rows and one has 218, while 36.9% report a single chemical. Count facilities with TRIFD, never rows.
3. Where the pounds go
lb = pounds(t24)
parts = {"on-site": pounds(t24, "ON-SITE RELEASE TOTAL").sum(), "off-site": pounds(t24, "OFF-SITE RELEASE TOTAL").sum()}
print({k: f"{v / 1e9:.2f} billion lb" for k, v in parts.items()}, f"total {lb.sum() / 1e9:.2f}")
{'on-site': '2.84 billion lb', 'off-site': '0.45 billion lb'} total 3.29
On-site releases are 2.84 billion lb and off-site releases 0.45 billion, together the 3.29 billion of TOTAL RELEASES.
Industries, states and a facility map
The data used on this page
The US EPA's Toxics Release Inventory basic data files for 2014 and 2024, public domain, downloaded on 16 October 2026 and saved on this site, because EPA revises past years when facilities resubmit. With them come the Census Bureau's Vintage 2025 county population estimates and 2024 county boundaries.
from pathlib import Path
import re
import zipfile

import geopandas as gpd
import numpy as np
import pandas as pd
import requests

Path("data").mkdir(exist_ok=True)
# EPA Toxics Release Inventory basic data files, reporting years 2014 and 2024, all states, xz-compressed and
# otherwise unchanged; Census Vintage 2025 county estimates and 2024 cartographic boundary counties.
# Downloaded 16 October 2026 and saved here, because EPA revises past years.
# Live: https://data.epa.gov/efservice/downloads/tri/mv_tri_basic_download/2024_US/csv (and 2014_US)
ARCHIVE = "epa-tri-2014-2024-2026-10-16.zip"
if not Path(f"data/{ARCHIVE}").exists():
    Path(f"data/{ARCHIVE}").write_bytes(requests.get(f"https://data.spatialworkflow.io/{ARCHIVE}", timeout=600).content)
Z = zipfile.ZipFile(f"data/{ARCHIVE}")


def tri(year):
    """One year's TRI file: a row per facility and chemical, columns numbered '1. YEAR' to '122. ...'."""
    d = pd.read_csv(Z.open(f"tri_{year}_us.csv.xz"), compression="xz", dtype=str, low_memory=False)
    d.columns = [re.sub(r"^\d+\.\s*", "", c) for c in d.columns]
    amounts = list(d.columns[d.columns.get_loc("5.1 - FUGITIVE AIR"):d.columns.get_loc("8.8 - ONE-TIME RELEASE") + 1])
    d[amounts + ["LATITUDE", "LONGITUDE"]] = d[amounts + ["LATITUDE", "LONGITUDE"]].apply(pd.to_numeric, errors="coerce")
    return d


def pounds(d, col="TOTAL RELEASES"):
    """A quantity in pounds: dioxin and dioxin-like compounds are reported in grams."""
    return d[col].where(d["UNIT OF MEASURE"] == "Pounds", d[col] / 453.59237)


t24 = tri(2024)
pop = pd.read_csv(Z.open("co-est2025-alldata.csv"), encoding="latin-1", dtype={"STATE": str, "COUNTY": str})
pop = pop[pop.SUMLEV == 50].assign(GEOID=lambda p: p.STATE + p.COUNTY)
Path("data/cb_2024_us_county_20m.zip").write_bytes(Z.read("cb_2024_us_county_20m.zip"))
counties = gpd.read_file("data/cb_2024_us_county_20m.zip")
print(f"TRI 2024: {len(t24):,} facility-chemical rows from {t24.TRIFD.nunique():,} facilities; {pounds(t24).sum() / 1e9:.2f} billion lb released")
TRI 2024: 77,295 facility-chemical rows from 21,482 facilities; 3.29 billion lb released
Example 1: by industry
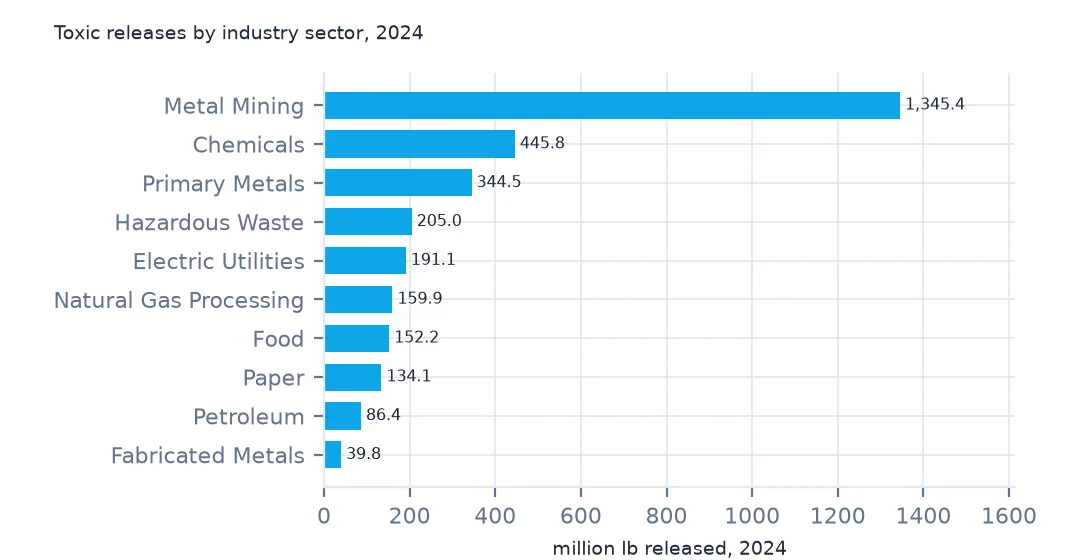
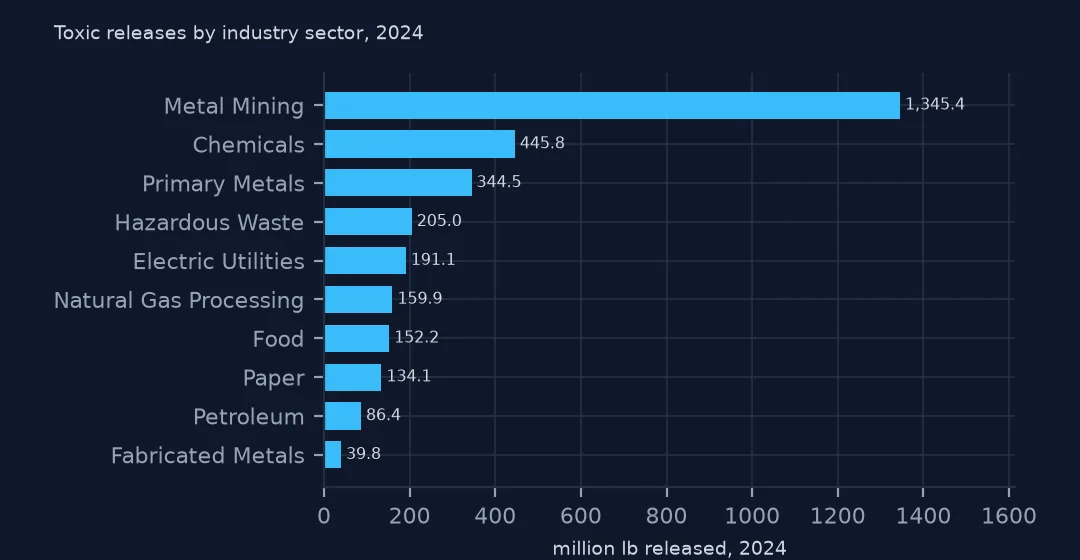
print((t24.assign(lb=lb).groupby("INDUSTRY SECTOR").lb.sum().nlargest(6) / 1e6).round(1).to_string())INDUSTRY SECTOR
Metal Mining 1345.4
Chemicals 445.8
Primary Metals 344.5
Hazardous Waste 205.0
Electric Utilities 191.1
Natural Gas Processing 159.9
Metal mining released 1,345.4 million lb, more than the next two sectors together: most of it is waste rock and tailings placed on the mine site, which counts as a release to land.
Example 2: facilities on a map
fac = t24.assign(lb=lb).groupby("TRIFD").agg(lb=("lb", "sum"), lat=("LATITUDE", "first"), lon=("LONGITUDE", "first"), st=("ST", "first"))
g = gpd.GeoDataFrame(fac, geometry=gpd.points_from_xy(fac.lon, fac.lat), crs=4269)
print(f"facilities: {len(g):,}; outside the 50 states and DC: {(~g.st.isin(counties.STUSPS) | g.st.isin(['PR'])).sum()}; releasing nothing: {(g.lb == 0).sum():,}")
ax = g[~g.st.isin(["AK", "HI", "PR", "GU", "VI", "MP", "AS"])].to_crs(5070).plot(markersize=1, figsize=(10, 6))
ax.set_axis_off()
facilities: 21,482; outside the 50 states and DC: 123; releasing nothing: 4,104
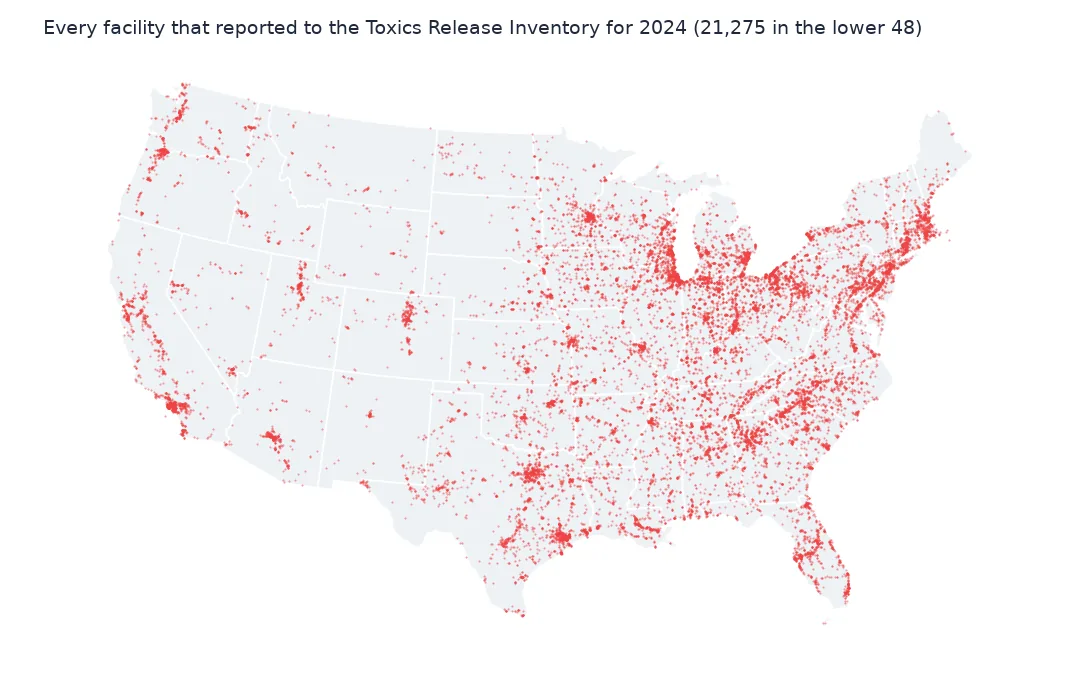
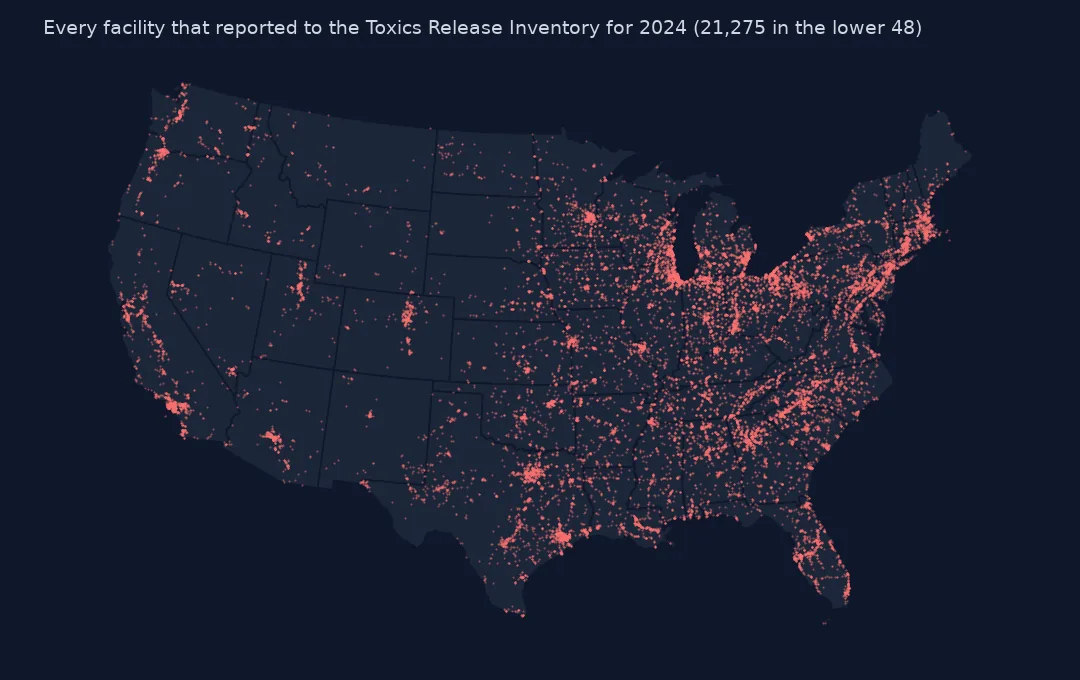
Of the 21,482 facilities, 123 are outside the 50 states and DC, in Puerto Rico and the island territories, and 4,104 released nothing in 2024. The points crowd the industrial Midwest, the Gulf Coast and the Southeast.
Internal links
- Facilities by amount released — the map sized by pounds
- Release totals explained — what on-site and off-site add up
- Pounds and grams — why
pounds()exists - Form A — rows that report no amount
- County names — joining facilities to counties
FAQ
Where do I download Toxics Release Inventory data?
From EPA's TRI basic data files page: one CSV per year for the whole US, or per state. The basic file has about 120 columns, one row per facility and chemical.