
How to Find the Few Facilities Behind Most Toxic Releases
On this page
Problem statement
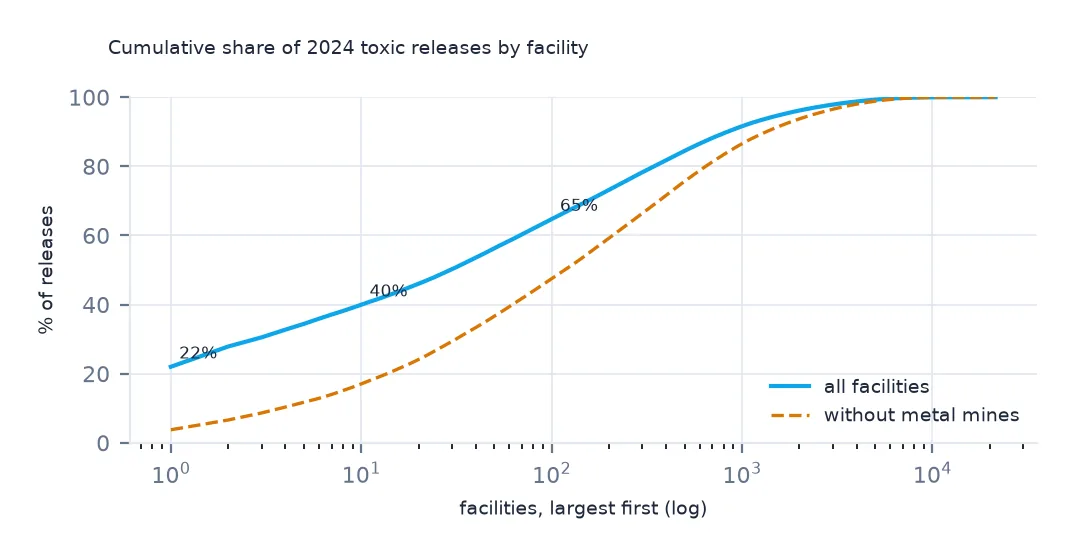
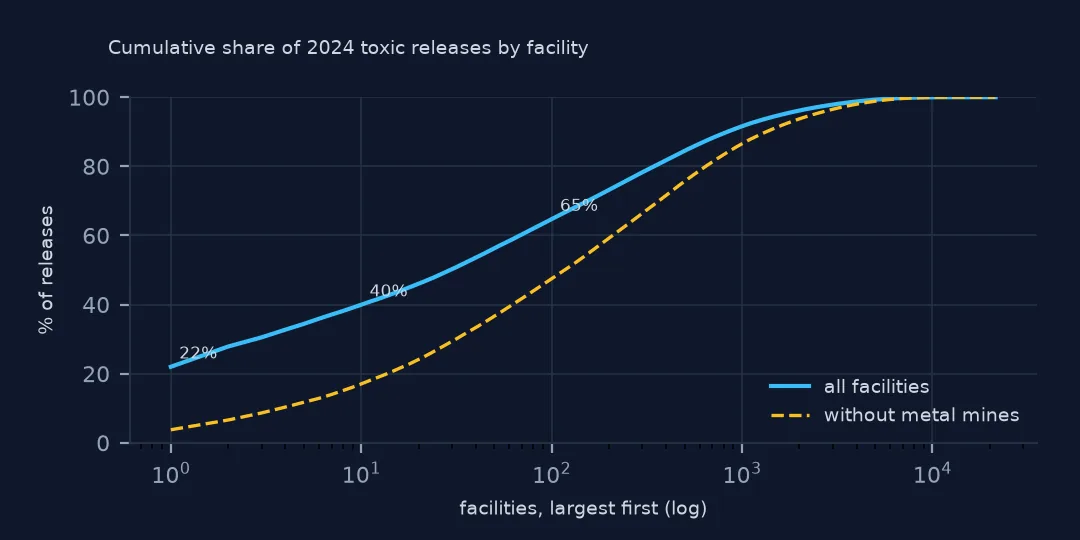
National totals from the Toxics Release Inventory hide how concentrated they are. More than twenty thousand facilities report, but a handful of them, mostly metal mines, account for a large share of the pounds, so a national trend or a state ranking can be a story about one site. This page measures that concentration in the 2024 file: the share of the largest facility, the top 10 and the top 100, what those facilities release and where, the curve without the mines, and the states where one facility is most of the total.
Quick answer
Total by facility, sort, and take the cumulative share:
fac = t24.assign(lb=pounds(t24)).groupby("TRIFD").agg(name=("FACILITY NAME", "first"), st=("ST", "first"), sector=("INDUSTRY SECTOR", "first"), lb=("lb", "sum"))
fac = fac.sort_values("lb", ascending=False)
share = fac.lb.cumsum() / fac.lb.sum()
print(f"facilities: {len(fac):,}; the largest one {share.iloc[0]:.1%}; top 10 {share.iloc[9]:.1%}; top 100 {share.iloc[99]:.1%}; half the total from {(share < 0.5).sum() + 1}")
facilities: 21,482; the largest one 22.0%; top 10 39.9%; top 100 64.7%; half the total from 30
The single largest facility released 22.0% of everything reported in 2024. The top 10 released 39.9%, the top 100 64.7%, and 30 facilities account for half of the 3.29 billion lb.
A concentration curve and what drives it
1. The top ten
print(fac.head(10).assign(mlb=lambda d: (d.lb / 1e6).round(1))[["name", "st", "sector", "mlb"]].to_string(index=False)) name st sector mlb
RED DOG OPERATIONS AK Metal Mining 723.9
KENNECOTT UTAH COPPER MINE CONCENTRATORS & POWER PLANT UT Metal Mining 192.7
HECLA GREENS CREEK MINING CO AK Metal Mining 87.6
MIDWAY GAS PLANT TX Natural Gas Processing 73.3
ASARCO LLC RAY COMPLEX/ HAYDEN SMELTER & CONCENTRATOR AZ Primary Metals 55.0
NEVADA GOLD MINES LLC - GOLDSTRIKE MINES INC NV Metal Mining 49.1
ELEMENTAL ENVIRONMENTAL SOLUTIONS LLC AR Hazardous Waste 39.8
BASIN ELECTRIC ANTELOPE VALLEY STATION ND Chemicals 33.2
MONTANA RESOURCES LLC MT Metal Mining 31.7
NEVADA GOLD MINES LLC - CARLIN SOUTH AREA NV Metal Mining 28.1
Seven of the top ten are metal mines or smelters, led by Red Dog in Alaska with 723.9 million lb, Kennecott in Utah and Greens Creek in Alaska. A Texas gas plant, an Arkansas hazardous-waste site and a Basin Electric station in North Dakota, filed under chemicals, fill the rest.
2. What they release, and where
top = t24[t24.TRIFD.isin(fac.index[:10])]
land = sum(pounds(top, c).sum() for c in top.columns if c.startswith("5.5"))
print(f"top 10: on-site land {land / fac.lb.head(10).sum():.1%} of their releases; air {(pounds(top, '5.1 - FUGITIVE AIR') + pounds(top, '5.2 - STACK AIR')).sum() / fac.lb.head(10).sum():.1%}")
print((top.assign(lb=pounds(top)).groupby("CHEMICAL").lb.sum().nlargest(4) / 1e6).round(1).to_string())
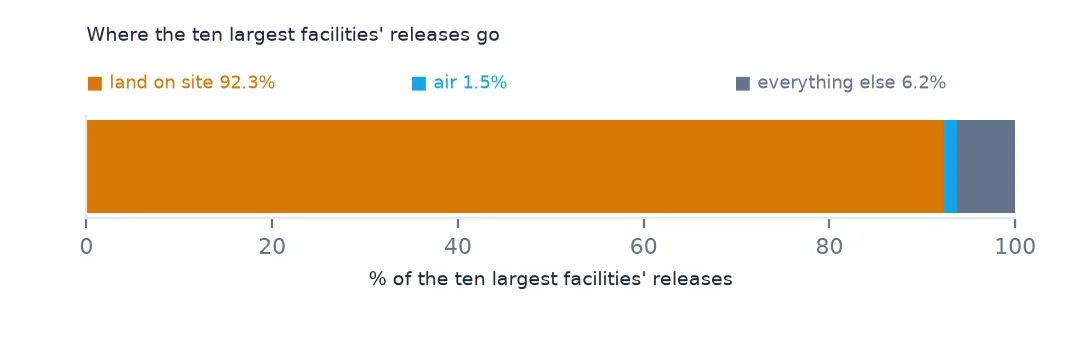
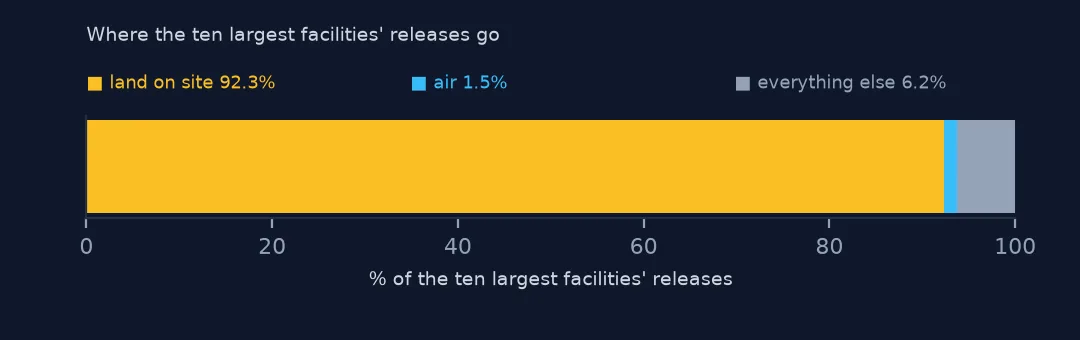
top 10: on-site land 92.3% of their releases; air 1.5%
CHEMICAL
Lead And Lead Compounds 451.6
Zinc compounds 441.1
Copper And Copper Compounds 73.9
Hydrogen sulfide 73.1
92.3% of what the top ten release goes onto land on their own sites, and 1.5% to air. Their releases are mostly lead and zinc compounds, 451.6 and 441.1 million lb: metals in waste rock and tailings.
3. Without the mines
nm = fac[fac.sector != "Metal Mining"]
s2 = nm.lb.cumsum() / nm.lb.sum()
print(f"metal mines: {(fac.sector == 'Metal Mining').sum()} facilities, {fac[fac.sector == 'Metal Mining'].lb.sum() / fac.lb.sum():.1%} of releases")
print(f"without them: top 10 {s2.iloc[9]:.1%}, top 100 {s2.iloc[99]:.1%}")
metal mines: 89 facilities, 40.9% of releases
without them: top 10 17.0%, top 100 47.4%
89 metal mines account for 40.9% of all releases. Leave them out and the curve flattens: the top 10 of the remaining facilities hold 17.0% and the top 100 47.4%.
By state, and on a map
The data used on this page
The US EPA's Toxics Release Inventory basic data files for 2014 and 2024, public domain, downloaded on 16 October 2026 and saved on this site, because EPA revises past years when facilities resubmit. With them come the Census Bureau's Vintage 2025 county population estimates and 2024 county boundaries.
from pathlib import Path
import re
import zipfile

import geopandas as gpd
import numpy as np
import pandas as pd
import requests

Path("data").mkdir(exist_ok=True)
# EPA Toxics Release Inventory basic data files, reporting years 2014 and 2024, all states, xz-compressed and
# otherwise unchanged; Census Vintage 2025 county estimates and 2024 cartographic boundary counties.
# Downloaded 16 October 2026 and saved here, because EPA revises past years.
# Live: https://data.epa.gov/efservice/downloads/tri/mv_tri_basic_download/2024_US/csv (and 2014_US)
ARCHIVE = "epa-tri-2014-2024-2026-10-16.zip"
if not Path(f"data/{ARCHIVE}").exists():
    Path(f"data/{ARCHIVE}").write_bytes(requests.get(f"https://data.spatialworkflow.io/{ARCHIVE}", timeout=600).content)
Z = zipfile.ZipFile(f"data/{ARCHIVE}")


def tri(year):
    """One year's TRI file: a row per facility and chemical, columns numbered '1. YEAR' to '122. ...'."""
    d = pd.read_csv(Z.open(f"tri_{year}_us.csv.xz"), compression="xz", dtype=str, low_memory=False)
    d.columns = [re.sub(r"^\d+\.\s*", "", c) for c in d.columns]
    amounts = list(d.columns[d.columns.get_loc("5.1 - FUGITIVE AIR"):d.columns.get_loc("8.8 - ONE-TIME RELEASE") + 1])
    d[amounts + ["LATITUDE", "LONGITUDE"]] = d[amounts + ["LATITUDE", "LONGITUDE"]].apply(pd.to_numeric, errors="coerce")
    return d


def pounds(d, col="TOTAL RELEASES"):
    """A quantity in pounds: dioxin and dioxin-like compounds are reported in grams."""
    return d[col].where(d["UNIT OF MEASURE"] == "Pounds", d[col] / 453.59237)


t24 = tri(2024)
pop = pd.read_csv(Z.open("co-est2025-alldata.csv"), encoding="latin-1", dtype={"STATE": str, "COUNTY": str})
pop = pop[pop.SUMLEV == 50].assign(GEOID=lambda p: p.STATE + p.COUNTY)
Path("data/cb_2024_us_county_20m.zip").write_bytes(Z.read("cb_2024_us_county_20m.zip"))
counties = gpd.read_file("data/cb_2024_us_county_20m.zip")
print(f"TRI 2024: {len(t24):,} facility-chemical rows from {t24.TRIFD.nunique():,} facilities; {pounds(t24).sum() / 1e9:.2f} billion lb released")
TRI 2024: 77,295 facility-chemical rows from 21,482 facilities; 3.29 billion lb released
Example 1: one facility can be a state's total
st = fac.groupby("st").lb.agg(["sum", "max"])
st["largest share"] = st["max"] / st["sum"]
print(st[st["sum"] >= 1e7].sort_values("largest share", ascending=False).head(6)["largest share"].map("{:.1%}".format).to_string())
st
AK 86.0%
UT 77.6%
MT 76.1%
ND 55.9%
AR 52.4%
FL 50.9%
In Alaska one facility is 86.0% of the state's releases; in Utah 77.6% and in Montana 76.1%. In North Dakota, Arkansas and Florida the largest facility is more than half. A state trend in those places is the trend of one site.
Example 2: the top 100 on a map
xy = t24.drop_duplicates("TRIFD").set_index("TRIFD")[["LATITUDE", "LONGITUDE"]]
h = fac.head(100).join(xy)
g = gpd.GeoDataFrame(h, geometry=gpd.points_from_xy(h.LONGITUDE, h.LATITUDE), crs=4269)
print(g.sector.value_counts().head(4).to_string())
ax = counties.to_crs(4269).plot(color="whitesmoke", figsize=(12, 6))
g.plot(ax=ax, markersize=g.lb / 2e6, color="tab:red", alpha=0.6)
ax.set_xlim(-170, -65); ax.set_axis_off()
sector
Metal Mining 25
Chemicals 20
Primary Metals 16
Hazardous Waste 14
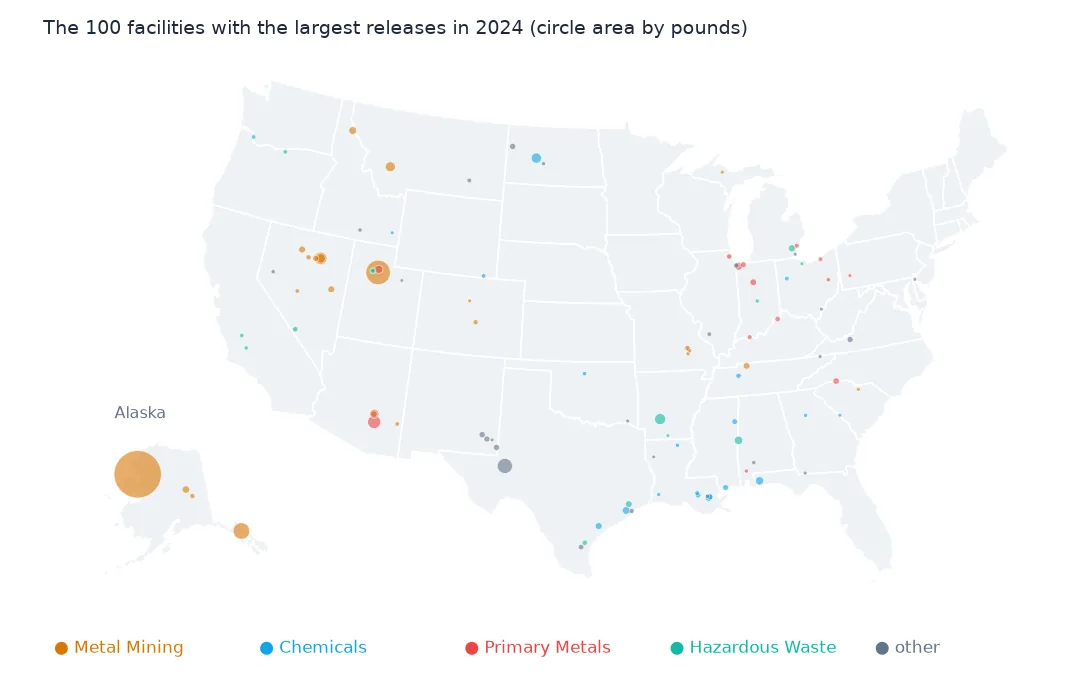
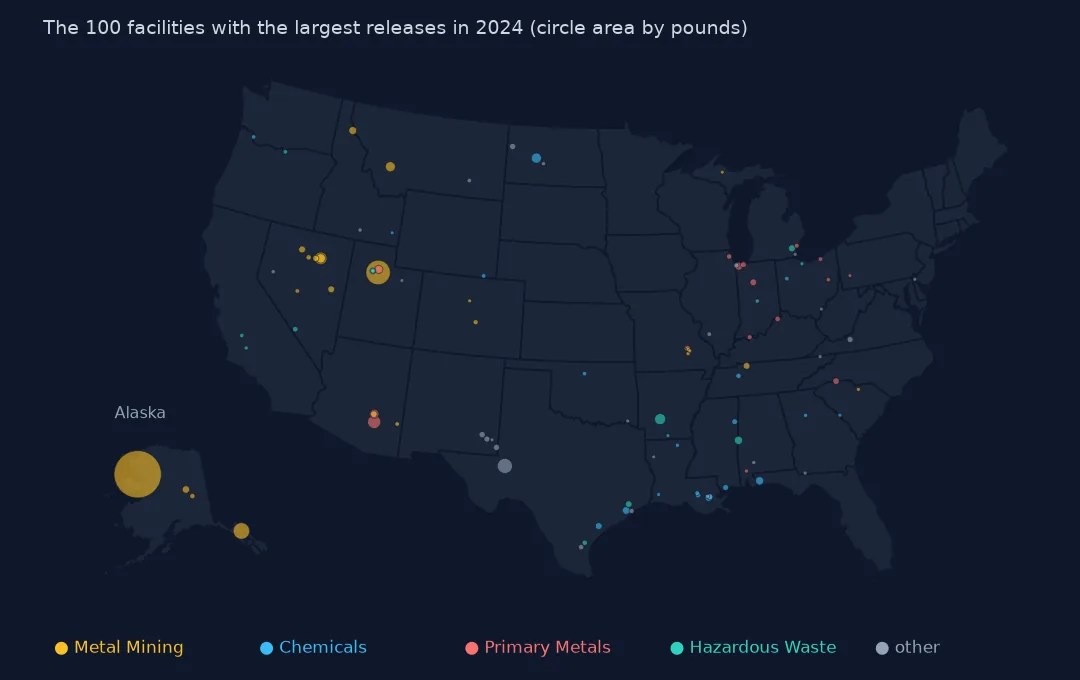
Of the 100 largest facilities, 25 are metal mines, 20 chemical plants, 16 primary metals plants and 14 hazardous-waste sites. On the map they sit in the mining West, along the Gulf Coast and in the Ohio Valley.
Internal links
- Facilities by amount released — all 21,000 facilities
- Release totals explained — why mine waste counts as a release
- Change since 2014 — what a few facilities do to a trend
- Read the TRI files — the reader