
How to Find Where Carcinogen Releases Concentrate
On this page
Problem statement
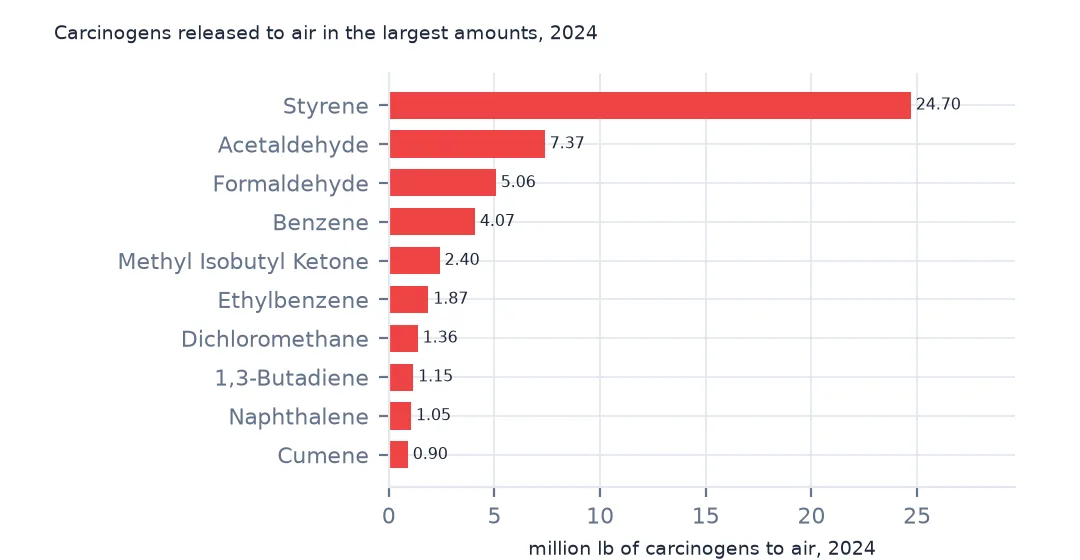
Not every chemical in the Toxics Release Inventory carries the same risk. EPA flags the ones that are carcinogens under OSHA's standard, and for people living near a plant the carcinogens released to air are the part that matters most. They are a small fraction of the total and concentrated in a few chemicals, a few industries and a few places. This page selects the carcinogen rows of the 2024 file, ranks chemicals and facilities, looks at ethylene oxide, and finds the counties where carcinogen air releases concentrate.
Quick answer
Filter on the CARCINOGEN flag and sum air releases:
t24["air"] = pounds(t24, "5.1 - FUGITIVE AIR") + pounds(t24, "5.2 - STACK AIR")
carc = t24[t24.CARCINOGEN == "YES"]
print(f"carcinogen rows: {len(carc):,} of {len(t24):,}; air releases {carc.air.sum() / 1e6:.1f} million lb of {t24.air.sum() / 1e6:.1f}")
print((carc.groupby("CHEMICAL").air.sum().nlargest(6) / 1e6).round(2).to_string())
carcinogen rows: 21,886 of 77,295; air releases 56.9 million lb of 530.3
CHEMICAL
Styrene 24.70
Acetaldehyde 7.37
Formaldehyde 5.06
Benzene 4.07
Methyl isobutyl ketone 2.40
Ethylbenzene 1.87
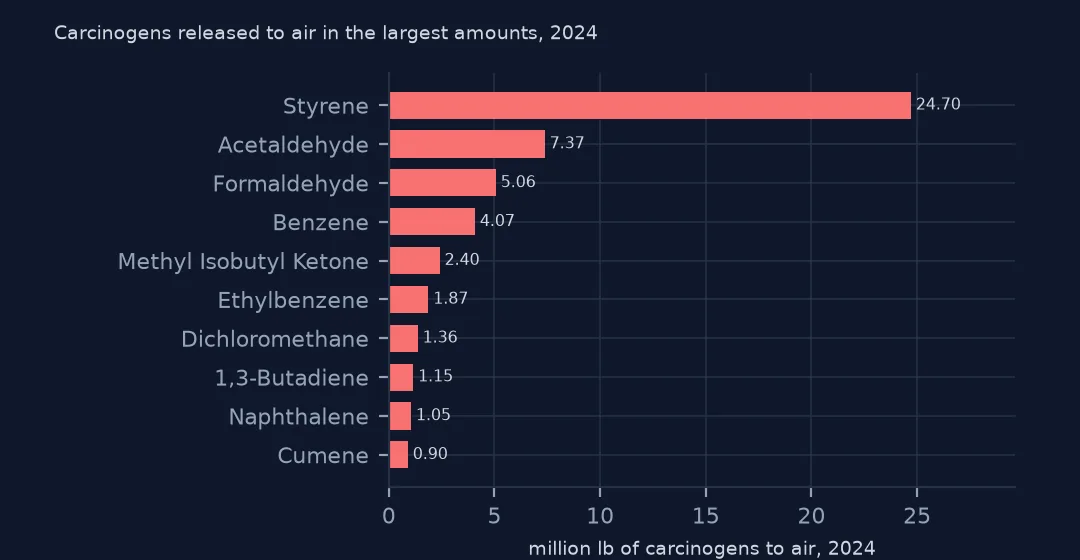
21,886 rows are carcinogens, but they released 56.9 million lb to air of the 530.3 million total. Styrene alone is 24.70 million lb, then acetaldehyde, formaldehyde and benzene.
Chemicals, facilities and places
1. A few chemicals
top = carc.groupby("CHEMICAL").air.sum().sort_values(ascending=False)
print(f"carcinogens reported: {top.size}; the top 3 make {top.head(3).sum() / top.sum():.1%} of carcinogen air releases")
carcinogens reported: 172; the top 3 make 65.2% of carcinogen air releases
172 carcinogens appear in the 2024 file; styrene, acetaldehyde and formaldehyde make 65.2% of their air releases.
2. Ethylene oxide by facility
eto = carc[carc.CHEMICAL.str.strip().str.lower() == "ethylene oxide"]
f = eto.groupby(["FACILITY NAME", "CITY", "ST"]).air.sum().sort_values(ascending=False)
print(f"facilities releasing ethylene oxide to air: {(f > 0).sum()}; total {f.sum():,.0f} lb")
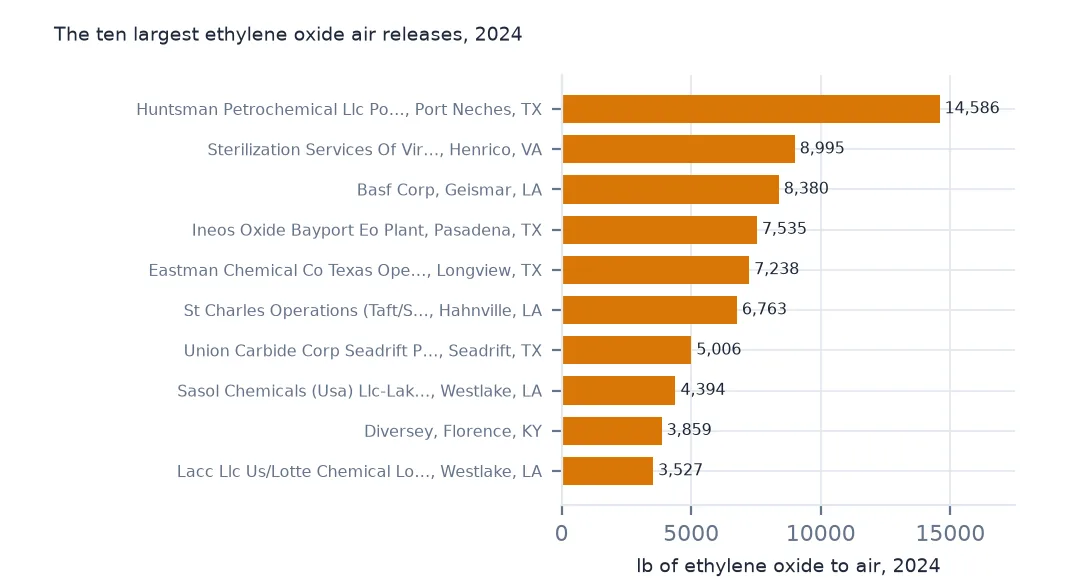
print(f.head(5).round(0).to_string())
facilities releasing ethylene oxide to air: 143; total 120,728 lb
FACILITY NAME CITY ST
HUNTSMAN PETROCHEMICAL LLC PORT NECHES FACILITY PORT NECHES TX 14586.0
STERILIZATION SERVICES OF VIRGINIA HENRICO VA 8995.0
BASF CORP GEISMAR LA 8380.0
INEOS OXIDE BAYPORT EO PLANT PASADENA TX 7535.0
EASTMAN CHEMICAL CO TEXAS OPERATIONS LONGVIEW TX 7238.0
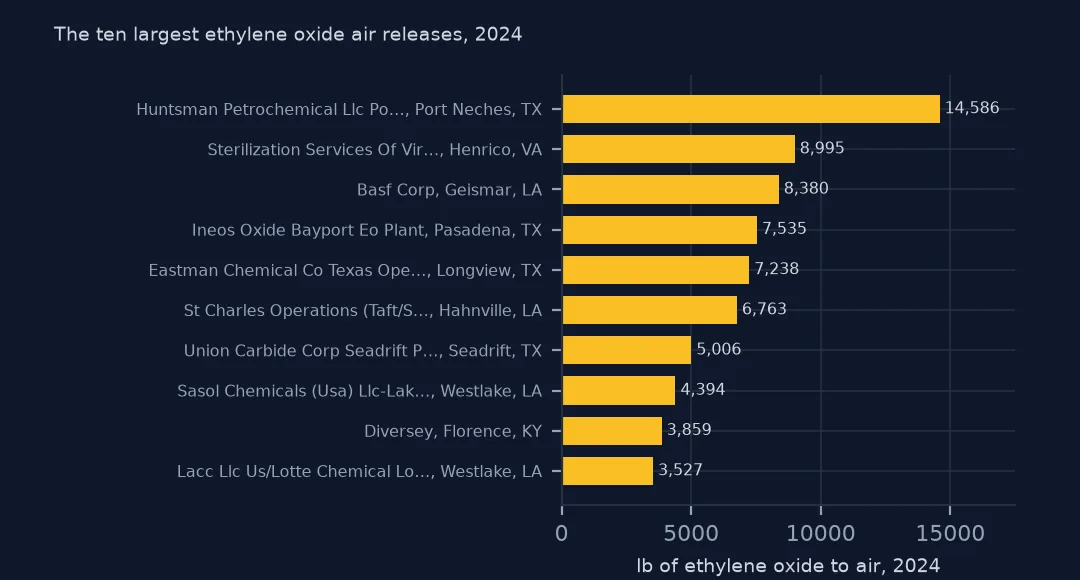
Ethylene oxide, used to make chemicals and to sterilise medical equipment, is released to air by 143 facilities, 120,728 lb in total. The largest is a petrochemical plant in Port Neches, Texas, with 14,586 lb; a sterilisation plant in Henrico, Virginia, is second with 8,995.
3. Concentration by county
fac = carc.groupby("TRIFD").agg(air=("air", "sum"), lat=("LATITUDE", "first"), lon=("LONGITUDE", "first"))
j = gpd.sjoin(gpd.GeoDataFrame(fac, geometry=gpd.points_from_xy(fac.lon, fac.lat), crs=4269), counties.to_crs(4269)[["GEOID", "NAME", "STUSPS", "geometry"]], predicate="within")
cc = j.groupby(["GEOID", "NAME", "STUSPS"]).air.sum().sort_values(ascending=False)
print(f"counties with carcinogen air releases: {(cc > 0).sum():,}; top 10 hold {cc.head(10).sum() / cc.sum():.1%}")
print((cc.head(6) / 1e3).round(1).to_string())
counties with carcinogen air releases: 1,943; top 10 hold 15.5%
GEOID NAME STUSPS
48201 Harris TX 1961.1
18099 Marshall IN 1086.6
18039 Elkhart IN 943.5
20149 Pottawatomie KS 875.7
47123 Monroe TN 841.5
41043 Linn OR 760.2
Carcinogen air releases come from 1,943 counties, and the top 10 hold 15.5%. Harris County, Texas, leads with 1,961.1 thousand lb; Marshall and Elkhart counties in northern Indiana are second and third.
Sectors and the map
The data used on this page
The US EPA's Toxics Release Inventory basic data files for 2014 and 2024, public domain, downloaded on 16 October 2026 and saved on this site, because EPA revises past years when facilities resubmit. With them come the Census Bureau's Vintage 2025 county population estimates and 2024 county boundaries.
from pathlib import Path
import re
import zipfile

import geopandas as gpd
import numpy as np
import pandas as pd
import requests

Path("data").mkdir(exist_ok=True)
# EPA Toxics Release Inventory basic data files, reporting years 2014 and 2024, all states, xz-compressed and
# otherwise unchanged; Census Vintage 2025 county estimates and 2024 cartographic boundary counties.
# Downloaded 16 October 2026 and saved here, because EPA revises past years.
# Live: https://data.epa.gov/efservice/downloads/tri/mv_tri_basic_download/2024_US/csv (and 2014_US)
ARCHIVE = "epa-tri-2014-2024-2026-10-16.zip"
if not Path(f"data/{ARCHIVE}").exists():
    Path(f"data/{ARCHIVE}").write_bytes(requests.get(f"https://data.spatialworkflow.io/{ARCHIVE}", timeout=600).content)
Z = zipfile.ZipFile(f"data/{ARCHIVE}")


def tri(year):
    """One year's TRI file: a row per facility and chemical, columns numbered '1. YEAR' to '122. ...'."""
    d = pd.read_csv(Z.open(f"tri_{year}_us.csv.xz"), compression="xz", dtype=str, low_memory=False)
    d.columns = [re.sub(r"^\d+\.\s*", "", c) for c in d.columns]
    amounts = list(d.columns[d.columns.get_loc("5.1 - FUGITIVE AIR"):d.columns.get_loc("8.8 - ONE-TIME RELEASE") + 1])
    d[amounts + ["LATITUDE", "LONGITUDE"]] = d[amounts + ["LATITUDE", "LONGITUDE"]].apply(pd.to_numeric, errors="coerce")
    return d


def pounds(d, col="TOTAL RELEASES"):
    """A quantity in pounds: dioxin and dioxin-like compounds are reported in grams."""
    return d[col].where(d["UNIT OF MEASURE"] == "Pounds", d[col] / 453.59237)


t24 = tri(2024)
pop = pd.read_csv(Z.open("co-est2025-alldata.csv"), encoding="latin-1", dtype={"STATE": str, "COUNTY": str})
pop = pop[pop.SUMLEV == 50].assign(GEOID=lambda p: p.STATE + p.COUNTY)
Path("data/cb_2024_us_county_20m.zip").write_bytes(Z.read("cb_2024_us_county_20m.zip"))
counties = gpd.read_file("data/cb_2024_us_county_20m.zip")
print(f"TRI 2024: {len(t24):,} facility-chemical rows from {t24.TRIFD.nunique():,} facilities; {pounds(t24).sum() / 1e9:.2f} billion lb released")
TRI 2024: 77,295 facility-chemical rows from 21,482 facilities; 3.29 billion lb released
Example 1: which industries
print((carc.groupby("INDUSTRY SECTOR").air.sum().nlargest(5) / 1e6).round(2).to_string())INDUSTRY SECTOR
Plastics and Rubber 15.77
Chemicals 13.04
Transportation Equipment 8.52
Paper 4.76
Petroleum 2.69
Plastics and rubber is the largest sector, 15.77 million lb, then chemicals and transportation equipment.
Example 2: map the facilities
g = gpd.GeoDataFrame(fac[fac.air > 0], geometry=gpd.points_from_xy(fac[fac.air > 0].lon, fac[fac.air > 0].lat), crs=4269)
st = carc.drop_duplicates("TRIFD").set_index("TRIFD").ST
g = g[~st.reindex(g.index).isin(["AK", "HI", "PR", "GU", "VI", "MP", "AS"])].to_crs(5070)
print(f"facilities drawn: {len(g):,}; releasing 10,000 lb or more: {(g.air >= 10_000).sum()}")
ax = g.plot(markersize=np.log10(g.air.clip(lower=1)) * 3, figsize=(10, 6))
ax.set_axis_off()
facilities drawn: 8,634; releasing 10,000 lb or more: 1087
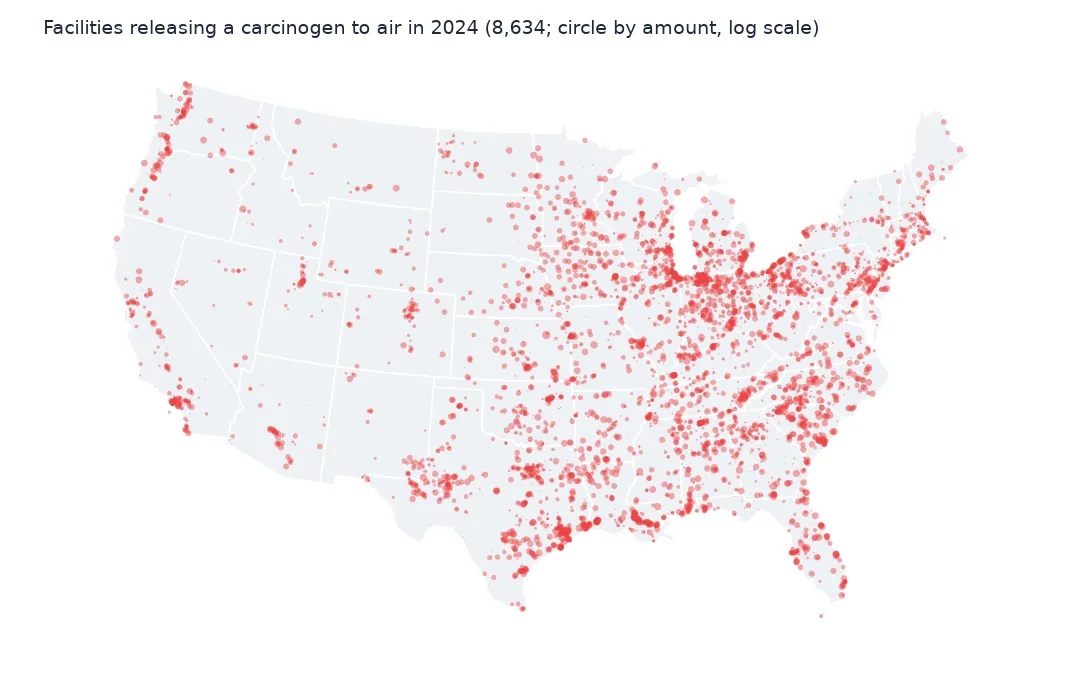
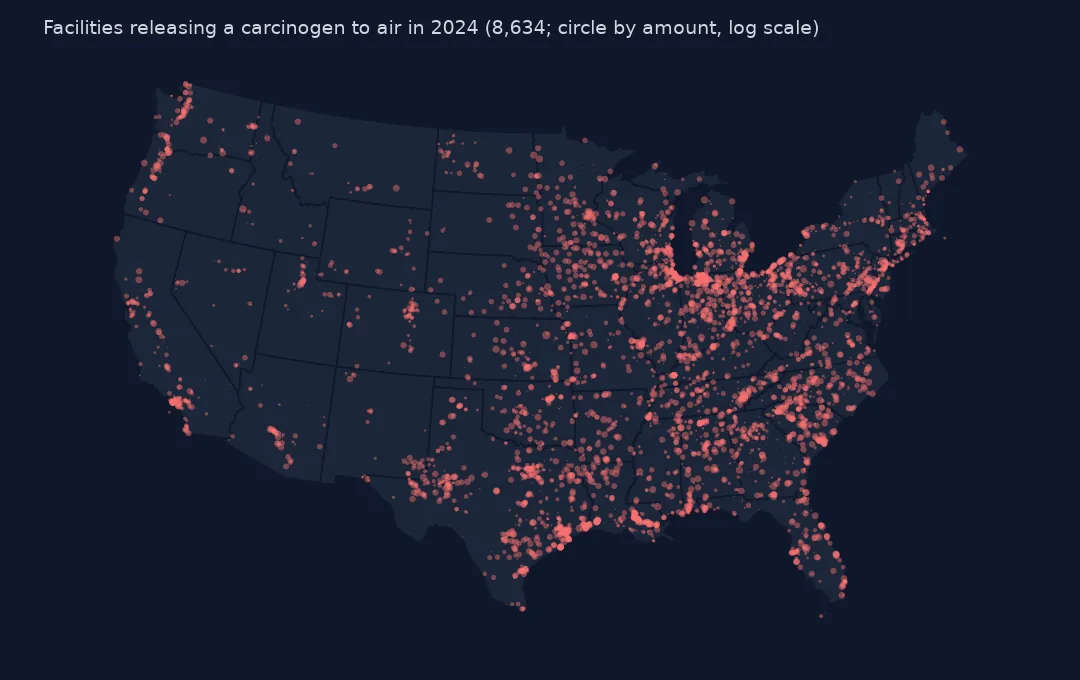
8,634 facilities in the lower 48 released a carcinogen to air, and 1,087 released 10,000 lb or more. They are spread through the manufacturing belt from Indiana to the Carolinas and along the Gulf Coast.
Internal links
- Air releases per resident — all chemicals, by county
- Read the TRI files — the
CARCINOGENcolumn and the reader - Release totals explained — air among the other routes
- Facilities by amount released — every facility on one map