
How to Compare Toxic Releases Between Two Years Facility by Facility
On this page
Problem statement
Did US industry release fewer toxic chemicals in 2024 than ten years earlier? Comparing two years of the Toxics Release Inventory gives a national answer in one line, but facilities come and go between years, and a few very large ones can move the total on their own. This page compares 2014 with 2024: the national total, facilities that reported in both years, closures and newcomers, the facilities that moved most, and changes by sector and by state.
Quick answer
Total each year's releases by facility and compare:
t14 = tri(2014)
a = t14.assign(lb=pounds(t14)).groupby("TRIFD").lb.sum()
b = t24.assign(lb=pounds(t24)).groupby("TRIFD").lb.sum()
print(f"2014: {a.sum() / 1e9:.2f} billion lb from {len(a):,} facilities; 2024: {b.sum() / 1e9:.2f} from {len(b):,} ({b.sum() / a.sum() - 1:+.1%})")
2014: 4.03 billion lb from 22,391 facilities; 2024: 3.29 from 21,482 (-18.3%)
Releases fell from 4.03 billion lb in 2014 to 3.29 billion in 2024, 18.3%, while the number of reporting facilities fell from 22,391 to 21,482.
Same facilities, closures and newcomers
1. Who reported in both years
both = a.index.intersection(b.index)
print(f"both years: {len(both):,}; only 2014: {len(a.index.difference(b.index)):,}; only 2024: {len(b.index.difference(a.index)):,}")
print(f"released by facilities in both: {a[both].sum() / 1e9:.2f} -> {b[both].sum() / 1e9:.2f} billion lb ({b[both].sum() / a[both].sum() - 1:+.1%})")
both years: 15,805; only 2014: 6,586; only 2024: 5,677
released by facilities in both: 3.68 -> 3.04 billion lb (-17.4%)
15,805 facilities reported in both years. 6,586 stopped reporting and 5,677 started. The continuing facilities released 3.68 billion lb in 2014 and 3.04 billion in 2024, 17.4% less.
2. Where the change came from
parts = pd.Series({"stopped reporting": -a[a.index.difference(b.index)].sum(), "new reporters": b[b.index.difference(a.index)].sum(),
                   "change at continuing facilities": b[both].sum() - a[both].sum()}) / 1e6
print(parts.round(1).to_string())
stopped reporting -341.6
new reporters 247.4
change at continuing facilities -641.1
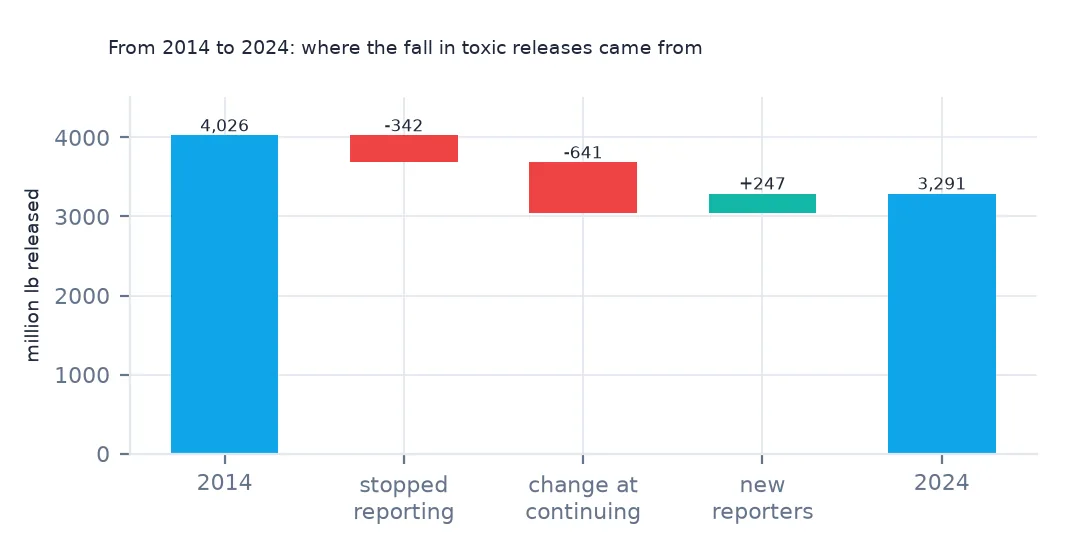
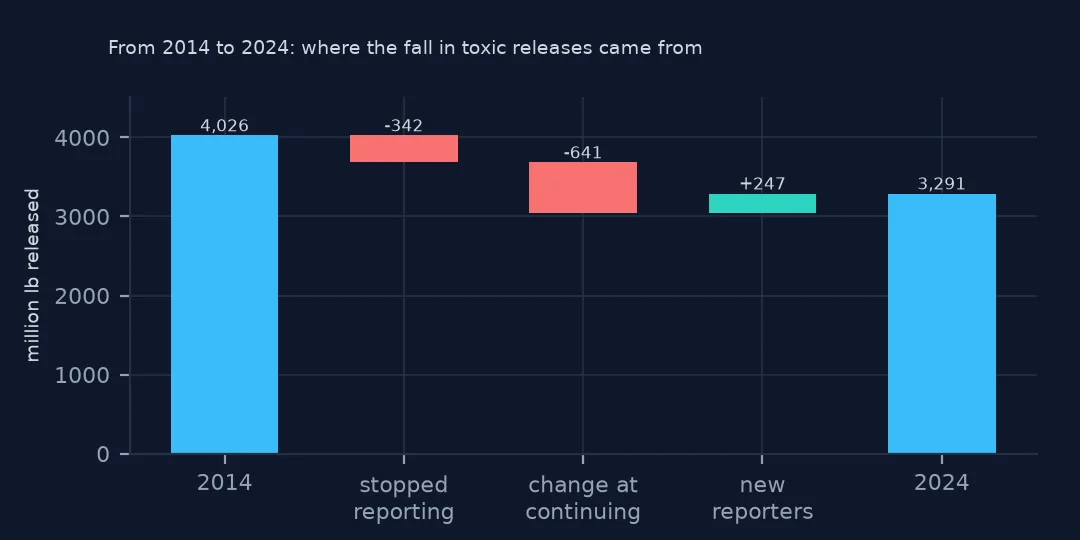
Most of the fall, 641.1 million lb, is change at continuing facilities. Facilities that stopped reporting took 341.6 million lb with them, and new reporters added 247.4 million.
3. The biggest movers
d = (b[both] - a[both]).sort_values()
names = t24.drop_duplicates("TRIFD").set_index("TRIFD")[["FACILITY NAME", "ST"]]
print("largest falls:", ", ".join(f"{names.loc[i, 'FACILITY NAME'].strip()[:28]} ({names.loc[i, 'ST']}) {v / 1e6:+.1f}M" for i, v in d.head(3).items()))
print("largest rises:", ", ".join(f"{names.loc[i, 'FACILITY NAME'].strip()[:28]} ({names.loc[i, 'ST']}) {v / 1e6:+.1f}M" for i, v in d.tail(3).items()))
largest falls: RED DOG OPERATIONS (AK) -400.5M, NEVADA GOLD MINES LLC - PHOE (NV) -46.0M, NEVADA GOLD MINES LLC-CORTEZ (NV) -35.1M
largest rises: KENNECOTT UTAH COPPER MINE C (UT) +30.5M, ELEMENTAL ENVIRONMENTAL SOLU (AR) +39.8M, HECLA GREENS CREEK MINING CO (AK) +46.0M
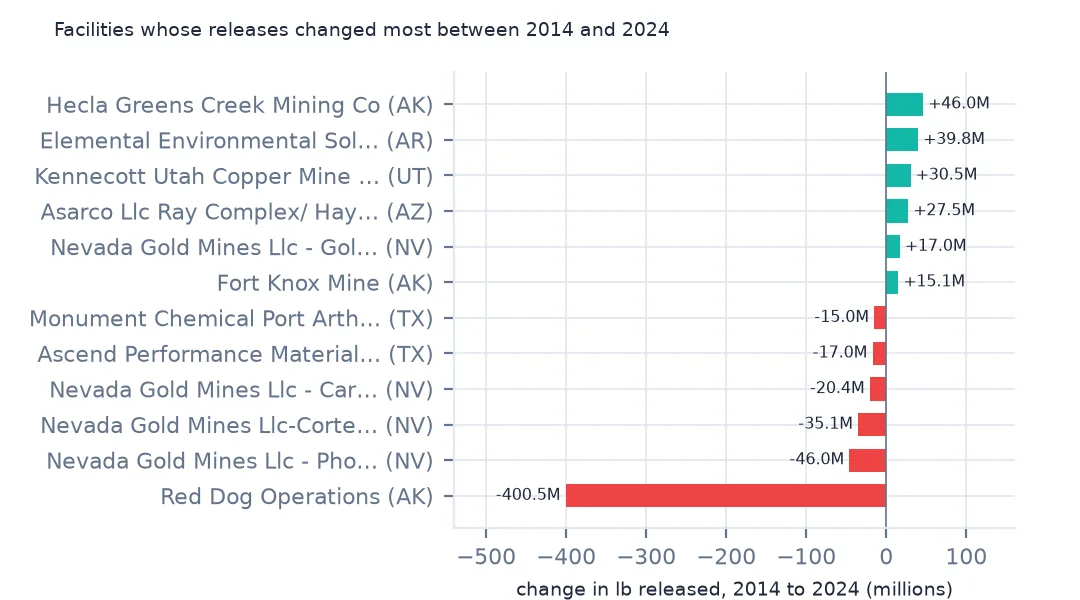
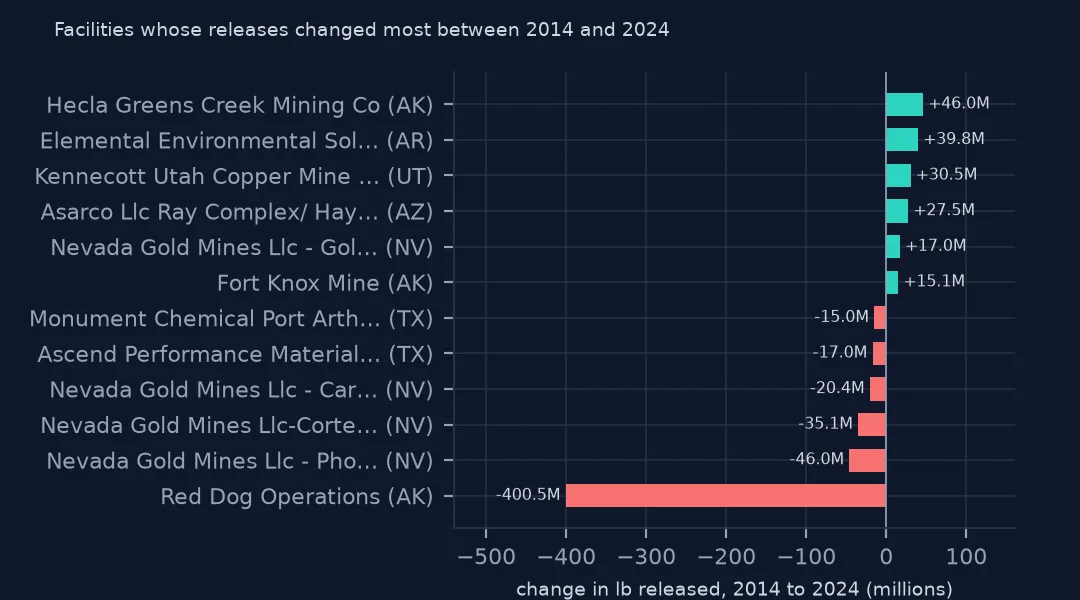
One mine dominates: Red Dog in Alaska released 400.5 million lb less in 2024 than in 2014, more than half of the national fall. Two Nevada gold mines fell by 46.0 and 35.1 million. The largest increases were also at mines and a hazardous-waste site: Greens Creek in Alaska up 46.0 million, Elemental Environmental Solutions in Arkansas 39.8 million and Kennecott in Utah 30.5 million.
Sectors and states
The data used on this page
The US EPA's Toxics Release Inventory basic data files for 2014 and 2024, public domain, downloaded on 16 October 2026 and saved on this site, because EPA revises past years when facilities resubmit. With them come the Census Bureau's Vintage 2025 county population estimates and 2024 county boundaries.
from pathlib import Path
import re
import zipfile

import geopandas as gpd
import numpy as np
import pandas as pd
import requests

Path("data").mkdir(exist_ok=True)
# EPA Toxics Release Inventory basic data files, reporting years 2014 and 2024, all states, xz-compressed and
# otherwise unchanged; Census Vintage 2025 county estimates and 2024 cartographic boundary counties.
# Downloaded 16 October 2026 and saved here, because EPA revises past years.
# Live: https://data.epa.gov/efservice/downloads/tri/mv_tri_basic_download/2024_US/csv (and 2014_US)
ARCHIVE = "epa-tri-2014-2024-2026-10-16.zip"
if not Path(f"data/{ARCHIVE}").exists():
    Path(f"data/{ARCHIVE}").write_bytes(requests.get(f"https://data.spatialworkflow.io/{ARCHIVE}", timeout=600).content)
Z = zipfile.ZipFile(f"data/{ARCHIVE}")


def tri(year):
    """One year's TRI file: a row per facility and chemical, columns numbered '1. YEAR' to '122. ...'."""
    d = pd.read_csv(Z.open(f"tri_{year}_us.csv.xz"), compression="xz", dtype=str, low_memory=False)
    d.columns = [re.sub(r"^\d+\.\s*", "", c) for c in d.columns]
    amounts = list(d.columns[d.columns.get_loc("5.1 - FUGITIVE AIR"):d.columns.get_loc("8.8 - ONE-TIME RELEASE") + 1])
    d[amounts + ["LATITUDE", "LONGITUDE"]] = d[amounts + ["LATITUDE", "LONGITUDE"]].apply(pd.to_numeric, errors="coerce")
    return d


def pounds(d, col="TOTAL RELEASES"):
    """A quantity in pounds: dioxin and dioxin-like compounds are reported in grams."""
    return d[col].where(d["UNIT OF MEASURE"] == "Pounds", d[col] / 453.59237)


t24 = tri(2024)
pop = pd.read_csv(Z.open("co-est2025-alldata.csv"), encoding="latin-1", dtype={"STATE": str, "COUNTY": str})
pop = pop[pop.SUMLEV == 50].assign(GEOID=lambda p: p.STATE + p.COUNTY)
Path("data/cb_2024_us_county_20m.zip").write_bytes(Z.read("cb_2024_us_county_20m.zip"))
counties = gpd.read_file("data/cb_2024_us_county_20m.zip")
print(f"TRI 2024: {len(t24):,} facility-chemical rows from {t24.TRIFD.nunique():,} facilities; {pounds(t24).sum() / 1e9:.2f} billion lb released")
TRI 2024: 77,295 facility-chemical rows from 21,482 facilities; 3.29 billion lb released
Example 1: by industry sector
sec = pd.DataFrame({"2014": t14.assign(lb=pounds(t14)).groupby("INDUSTRY SECTOR").lb.sum(), "2024": t24.assign(lb=pounds(t24)).groupby("INDUSTRY SECTOR").lb.sum()}) / 1e6
sec["change"] = sec["2024"] / sec["2014"] - 1
print(sec.nlargest(6, "2014").round({"2014": 1, "2024": 1, "change": 3}).to_string())
2014 2024 change
INDUSTRY SECTOR
Metal Mining 1791.8 1345.4 -0.249
Chemicals 534.1 445.8 -0.165
Electric Utilities 528.2 191.1 -0.638
Primary Metals 351.7 344.5 -0.020
Paper 189.9 134.1 -0.294
Food 133.6 152.2 0.139
Electric utilities cut releases by 63.8%, from 528.2 to 191.1 million lb, the largest relative fall of any large sector. Metal mining fell 24.9% and chemicals 16.5%; food processing rose 13.9%.
Example 2: air releases by state
air = lambda t: (pounds(t, "5.1 - FUGITIVE AIR") + pounds(t, "5.2 - STACK AIR")).groupby(t.ST).sum()
s = pd.DataFrame({"2014": air(t14), "2024": air(t24)}).dropna()
s["change"] = s["2024"] / s["2014"] - 1
big = s[s["2014"] >= 5e6].sort_values("change")
print("fell most:", ", ".join(f"{k} {v:+.0%}" for k, v in big.change.head(4).items()))
print("rose:", ", ".join(f"{k} {v:+.0%}" for k, v in big.change[big.change > 0].items()) or "none")
fell most: KY -68%, WV -65%, UT -64%, PA -62%
rose: LA +3%, ND +14%, OK +34%
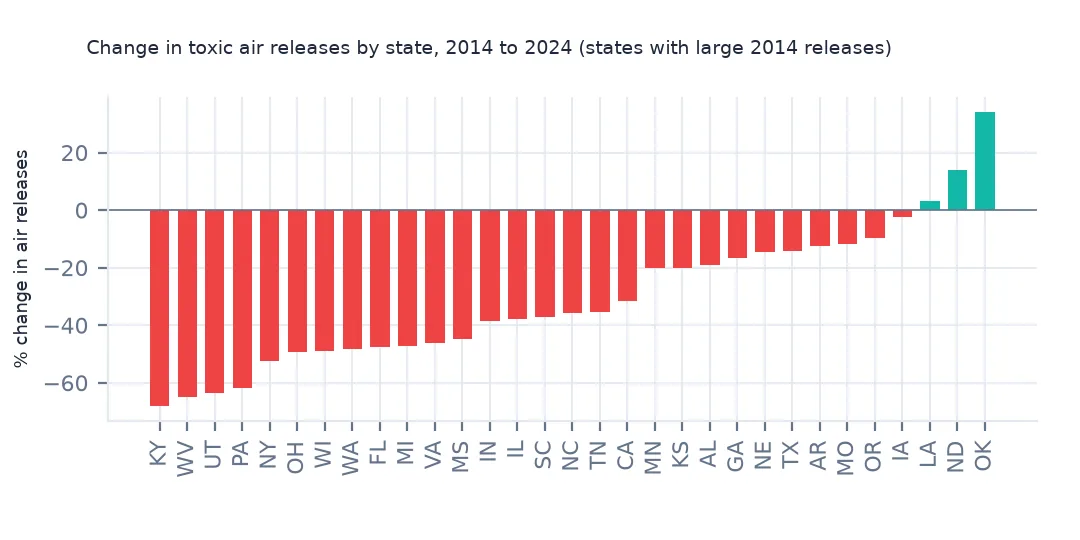
Air releases fell most in Kentucky, West Virginia, Utah and Pennsylvania, by 62% to 68%. Among states with large air releases in 2014, only Louisiana, North Dakota and Oklahoma released more in 2024.
Internal links
- Read the TRI files — the reader used for both years
- The few facilities behind most releases — why a handful decide the total
- Form A — reporters with no amounts in either year
- Air releases per resident — the 2024 map