
Urban Extent Explained
On this page
Problem statement
Every statement about a city — its population, its density, how much of it is green, how fast it is growing — assumes an answer to where the city is. There are three common answers and they rarely coincide. The administrative city is a legal boundary drawn by history. The morphological city is the continuous built-up or densely populated area, drawn from data. The functional city is the area whose residents commute into it, drawn from travel flows.
Den Haag is a clear case. Its municipality includes dunes, beach and a strip of the North Sea, and excludes neighbouring towns whose streets run on without a break. Its population, density and built-up share each change depending on which of the three cities is meant.
Quick answer
| Definition | Drawn from | Den Haag example |
|---|---|---|
| administrative | legal boundaries | the gemeente 's-Gravenhage |
| morphological | population or built-up grids | the dense cluster across several municipalities |
| functional | commuting flows | the metropolitan region |
import io, zipfile, requests, numpy as np, rasterio, rasterio.mask, geopandas as gpd, osmnx as ox
from scipy import ndimage

BASE = "https://jeodpp.jrc.ec.europa.eu/ftp/jrc-opendata/GHSL"
name = "GHS_POP_E2020_GLOBE_R2023A_4326_30ss"
zipfile.ZipFile(io.BytesIO(requests.get(
    f"{BASE}/GHS_POP_GLOBE_R2023A/{name}/V1-0/tiles/{name}_V1_0_R4_C19.zip", timeout=600
).content)).extractall("ghsl_nl")
src = rasterio.open(f"ghsl_nl/{name}_V1_0_R4_C19.tif")
win = rasterio.windows.from_bounds(3.9, 51.8, 4.8, 52.4, src.transform)
pop = np.clip(src.read(1, window=win), 0, None)
tf = src.window_transform(win)
lat = 52.4 - (np.arange(pop.shape[0]) + 0.5) * abs(tf.e)
cell_km2 = np.broadcast_to((abs(tf.a) * 111.32 * np.cos(np.radians(lat))[:, None])
                           * (abs(tf.e) * 110.57), pop.shape)          # km² per cell

labels, n = ndimage.label(pop / cell_km2 >= 1500)
sums = ndimage.sum(pop, labels, np.arange(1, n + 1))
r, c = rasterio.transform.rowcol(tf, 4.3113, 52.0799)             # central Den Haag
centre = labels == labels[r, c]

ox.settings.http_user_agent = "spatialworkflow-examples/1.0"
gem = ox.geocode_to_gdf("Den Haag, Netherlands")
in_gem, _ = rasterio.mask.mask(src, gem.to_crs(4326).geometry, crop=True, nodata=0)
gem_pop, gem_km2 = np.clip(in_gem, 0, None).sum(), gem.to_crs(28992).area.iloc[0] / 1e6

print(f"administrative: {gem_pop:>9,.0f} people on {gem_km2:5.0f} km² → {gem_pop / gem_km2:6,.0f}/km²")
print(f"morphological:  {pop[centre].sum():>9,.0f} people on {cell_km2[centre].sum():5.0f} km² → "
      f"{pop[centre].sum() / cell_km2[centre].sum():6,.0f}/km²")
administrative: 550,960 people on 98 km² → 5,615/km²
morphological: 797,550 people on 121 km² → 6,597/km²
Two definitions, two populations and two densities — both correct, describing different objects. The morphological city holds nearly 250,000 more people than the municipality, and it is denser, because it leaves out the dunes, beach and sea inside the legal line.
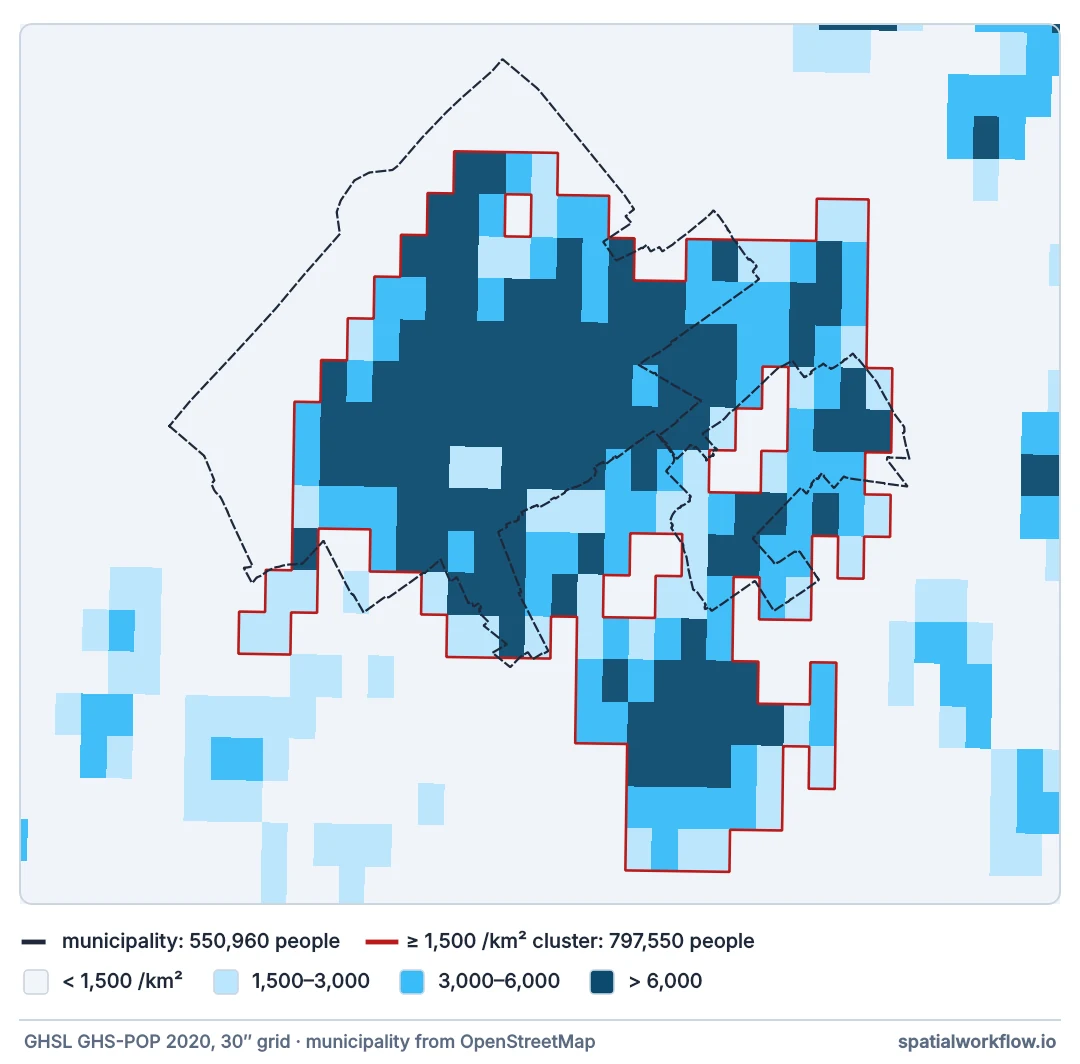
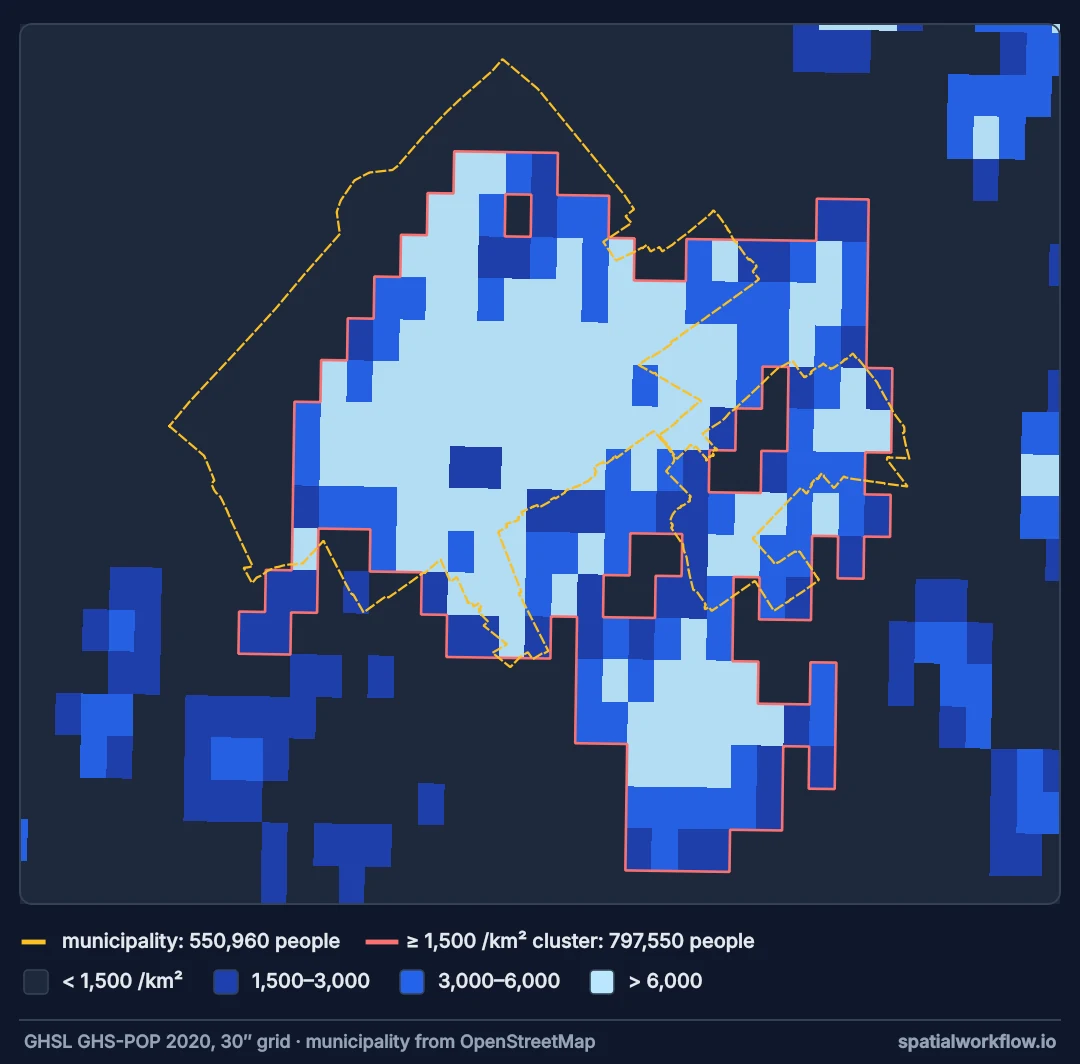
Which city, a rule-based extent, land not legal polygons
1. Say which city the question is about
Tax base and governance: administrative. Urban form, heat, land consumption: morphological. Labour markets and housing: functional.
2. Draw the morphological city with a rule, not by eye
A threshold on population density or built-up share, applied to a regular grid, with a contiguity rule. The same rule then works for any city.
3. Measure land, not the legal polygon
Administrative polygons may include water. Density on land and density on the full polygon differ wherever a city is coastal or has lakes.
4. Compare cities only within one definition
A density ranking that mixes administrative cities of very different sizes is a ranking of boundary-drawing practice.
5. Report the definition with every figure
"Den Haag has N people per km²" is incomplete without "within the municipal boundary" or "within the GHSL urban centre".
Den Haag's municipalities against its urban centre
Example 1 — which municipalities the urban centre spans
from shapely.geometry import shape
import rasterio.features
geoms = [shape(g) for g, v in rasterio.features.shapes(centre.astype("uint8"), mask=centre, transform=tf)]
centre_poly = gpd.GeoSeries(geoms, crs=4326).union_all()
names = ["Den Haag", "Rijswijk", "Leidschendam-Voorburg", "Delft", "Westland", "Zoetermeer"]
for nm in names:
    g = ox.geocode_to_gdf(f"{nm}, Zuid-Holland, Netherlands").to_crs(4326).geometry.iloc[0]
    share = gpd.GeoSeries([centre_poly.intersection(g)], crs=4326).to_crs(28992).area.iloc[0]
    total = gpd.GeoSeries([centre_poly], crs=4326).to_crs(28992).area.iloc[0]
    print(f"{nm:<22} {share / total:5.1%} of the urban centre")
Den Haag 55.7% of the urban centre
Rijswijk 9.8% of the urban centre
Leidschendam-Voorburg 10.4% of the urban centre
Delft 13.6% of the urban centre
Westland 3.5% of the urban centre
Zoetermeer 0.0% of the urban centre
The municipality of Den Haag holds 56% of its own urban centre; Delft, Leidschendam-Voorburg and Rijswijk hold another third between them. Zoetermeer, 15 km away, is dense enough but separated by lower-density land, so it forms its own cluster. No single administrative unit is "the city" in the morphological sense.
Example 2 — land against the legal polygon
land = gpd.read_file("https://naciscdn.org/naturalearth/10m/physical/ne_10m_land.zip")
gem_land = gem.to_crs(4326).clip(land.to_crs(4326))
land_km2 = gem_land.to_crs(28992).area.sum() / 1e6
print(f"municipal polygon {gem_km2:.0f} km², of which on land {land_km2:.0f} km²")
print(f"density on the polygon {gem_pop / gem_km2:,.0f}/km², on land {gem_pop / land_km2:,.0f}/km²")
municipal polygon 98 km², of which on land 81 km²
density on the polygon 5,615/km², on land 6,806/km²
The coastline dataset is coarse at this scale, but the point stands: a coastal municipality's polygon includes sea, and a density over it is diluted by water.
Example 3 — thresholds move the edge
for t in (1000, 1500, 2500, 5000):
    lab, _ = ndimage.label(pop / cell_km2 >= t)
    m = lab == lab[r, c]
    print(f"≥ {t:>5}/km²: {pop[m].sum():>9,.0f} people on {cell_km2[m].sum():5.0f} km²")
≥ 1000/km²: 1,898,501 people on 456 km²
≥ 1500/km²: 797,550 people on 121 km²
≥ 2500/km²: 759,841 people on 103 km²
≥ 5000/km²: 467,113 people on 48 km²
The morphological city is a family of cities indexed by the threshold. Between 2,500 and 1,500/km² the Den Haag cluster gains only 38,000 people; at 1,000/km² it jumps to 1.9 million, more than the Den Haag and Rotterdam urban centres together, because the lower threshold joins it to its neighbours across the gaps between them. The Degree of Urbanisation fixes 1,500/km² by international agreement; other thresholds answer other questions.
Why administrative cities compare poorly
Why administrative cities are poor comparators
Municipal boundaries reflect centuries of annexation, mergers and politics. Some cities, like Paris, have tight boundaries around a small core; others include large rural hinterlands. Comparing their densities compares boundary histories.
Why grids make comparison possible
A rule applied to a regular grid ignores administrative history. The same density and contiguity thresholds produce comparable urban centres in Europe, Africa and Asia, which is why international statistics increasingly use them.
Why the functional city is different again
People live in one place and work in another. The functional urban area adds commuting zones to the morphological core; it is the right unit for labour markets and housing, and it is much larger. Its boundary needs flow data rather than a grid.
Coasts, polycentric regions and epochs
- Coastal and lake cities need land masks for any density.
- Polycentric regions (the Randstad) produce several urban centres close together; merging them or not changes rankings.
- Epoch: urban centres change as cities grow; use the same year for population and boundary.
- Official data: GHS-SMOD publishes the settlement classification; Eurostat publishes functional urban areas for Europe.
- Nominatim polygons for places can be the municipality, the city district or the ward; check what came back.
Internal links
- How to delineate an urban extent from GHSL — the full workflow
- Density depends on the boundary — the fix guide
- Modifiable areal unit problem explained — boundaries and statistics
- Urban morphology explained — form within the extent
- How to calculate population-weighted exposure — the same population grid
- Counts, rates and densities explained — densities and their denominators
FAQ
What is the difference between a city and an urban area?
A city is usually an administrative unit; an urban area is defined by where people or buildings are concentrated, regardless of boundaries.
What is the Degree of Urbanisation?
An EU–UN method that classifies 1 km grid cells as urban centres, urban clusters or rural by density and contiguity.
Why does my city's density differ between sources?
They use different definitions of the city and different land areas.
Should I use the municipal boundary?
For governance questions, yes. For form, heat or land use, use a morphological extent.
What is a functional urban area?
A city and its commuting zone, defined from travel-to-work flows.
How do I handle water in density calculations?
Clip the area to land before dividing, and say that you did.