
Battery Electric Against Plug-in Hybrid: What the Registration Data Shows
On this page
Problem statement
"Electric vehicle" covers two different machines. A battery-electric vehicle (BEV) runs only on its battery. A plug-in hybrid (PHEV) has a smaller battery for some electric driving and a petrol engine for the rest. Counting them together answers questions about plugs and chargers, and counting them apart answers questions about fuel, range and emissions. Washington's registration data labels every vehicle as one or the other. This page shows how the two differ in range, makers, model years and places, using the EVs registered to Washington addresses.
Quick answer
Split on Electric Vehicle Type: BEVs are 80.6% of Washington's EVs and PHEVs 19.4%. PHEVs have a median electric range of 32 miles against 215 for BEVs, come from different makers, and make up a larger share in rural counties. Report the two separately whenever range, fuel use or emissions matter.
wa_ev = ev[ev.state == "WA"]
print(wa_ev.kind.value_counts(normalize=True).round(3).to_dict())
by_year = pd.crosstab(wa_ev.model_year, wa_ev.kind)
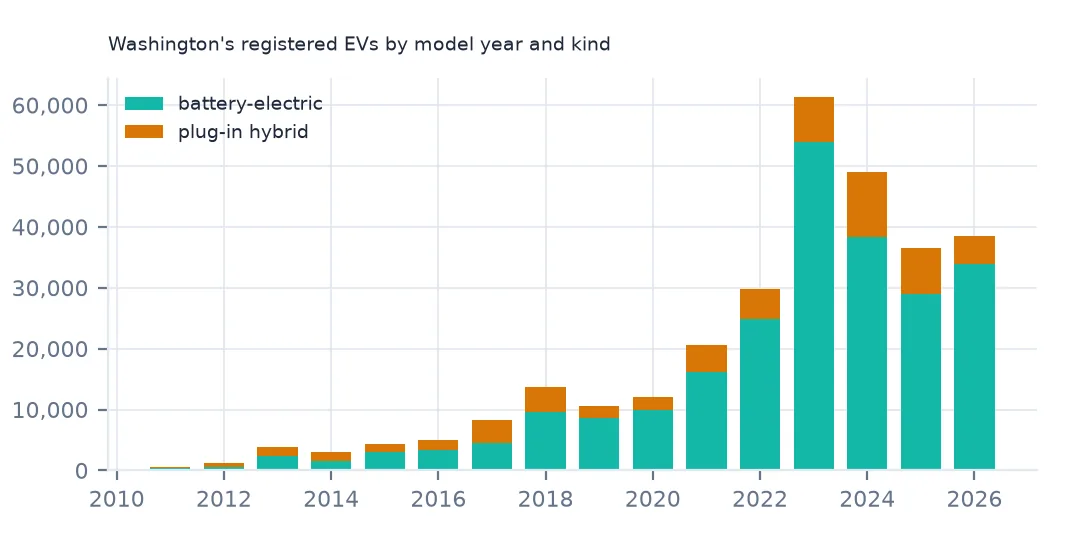
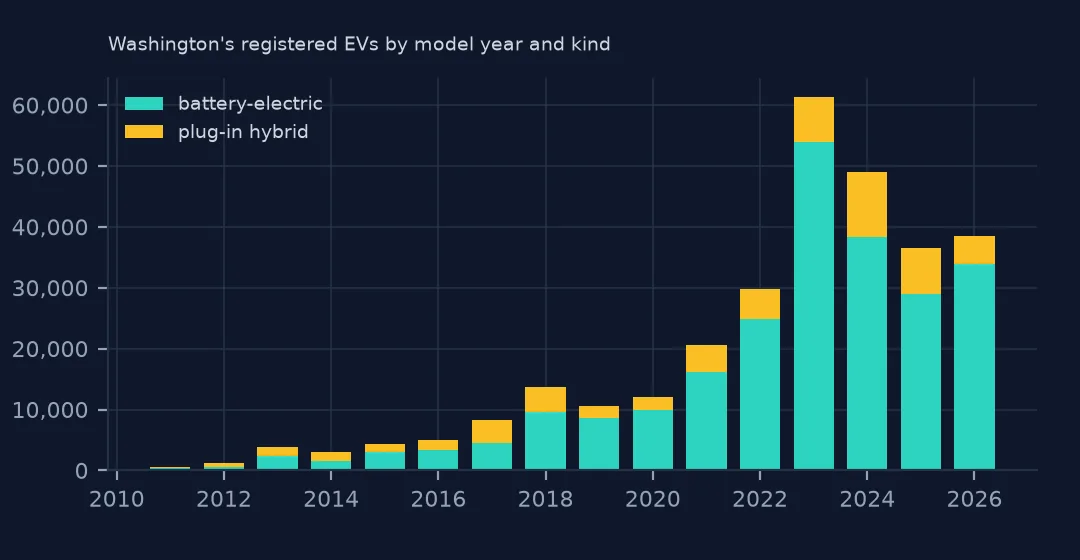
print((by_year.PHEV / by_year.sum(axis=1)).loc[2012:2026].round(3).to_dict())
{'BEV': 0.806, 'PHEV': 0.194}
{2012: 0.556, 2013: 0.379, 2014: 0.523, 2015: 0.283, 2016: 0.32, 2017: 0.463, 2018: 0.306, 2019: 0.193, 2020: 0.167, 2021: 0.213, 2022: 0.168, 2023: 0.121, 2024: 0.217, 2025: 0.205, 2026: 0.116}
80.6% of Washington's EVs are battery-electric. The plug-in hybrid share by model year has swung widely: over half of the 2012 cars, 16.7% of 2020 cars and 12.1% of 2023 cars, then up to 21.7% for 2024 and down again to 11.6% for 2026.
Range, makers and places
1. Electric range, where it is known
known = wa_ev[wa_ev.range_mi > 0]
print(known.groupby("kind").range_mi.describe()[["count", "25%", "50%", "75%", "max"]].to_string())
count 25% 50% 75% max
kind
BEV 44644.0 150.0 215.0 239.0 337.0
PHEV 58080.0 22.0 32.0 38.0 153.0
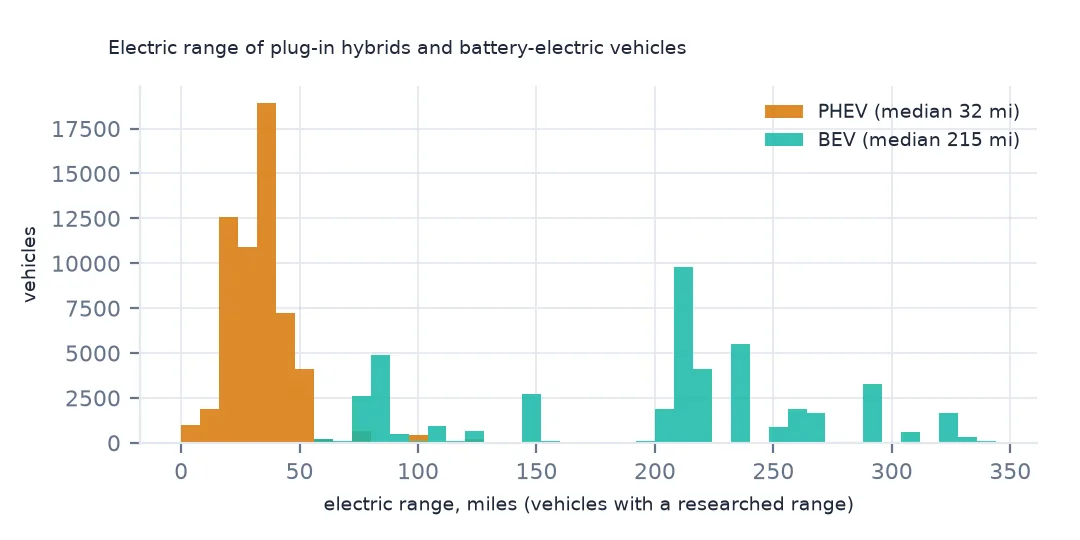
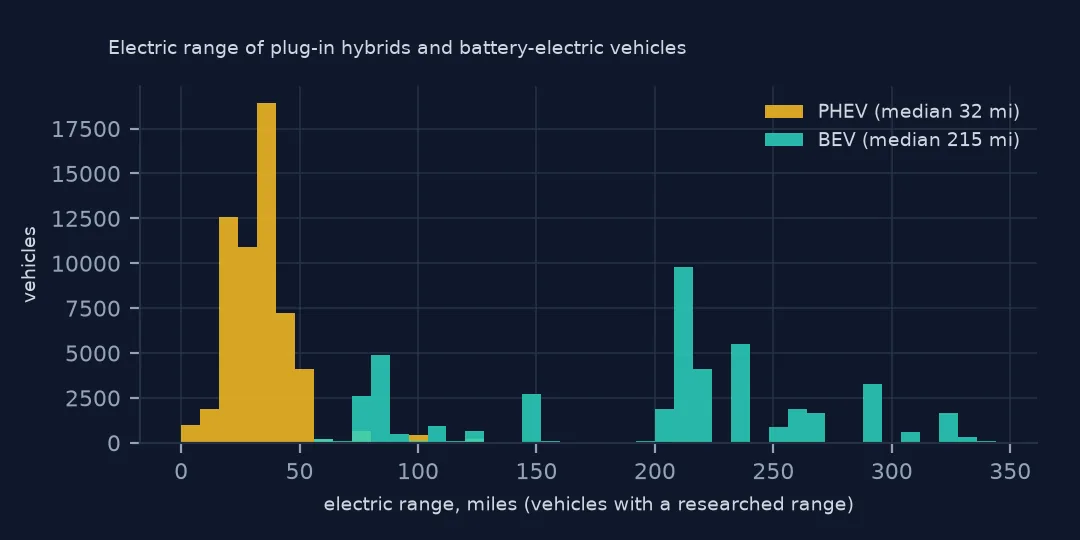
Where range is recorded, the middle half of BEVs have 150 to 239 miles of electric range (median 215) and the middle half of PHEVs 22 to 38 miles (median 32). A PHEV covers a typical commute on electricity and longer trips on petrol, and the data cannot say how much of its driving is electric. Range is recorded for only 44,644 BEVs, because most newer ones have a range of 0, meaning not researched.
2. Who makes each kind
for k in ("BEV", "PHEV"):
    print(k, wa_ev[wa_ev.kind == k].make.value_counts(normalize=True).head(5).round(3).to_dict())
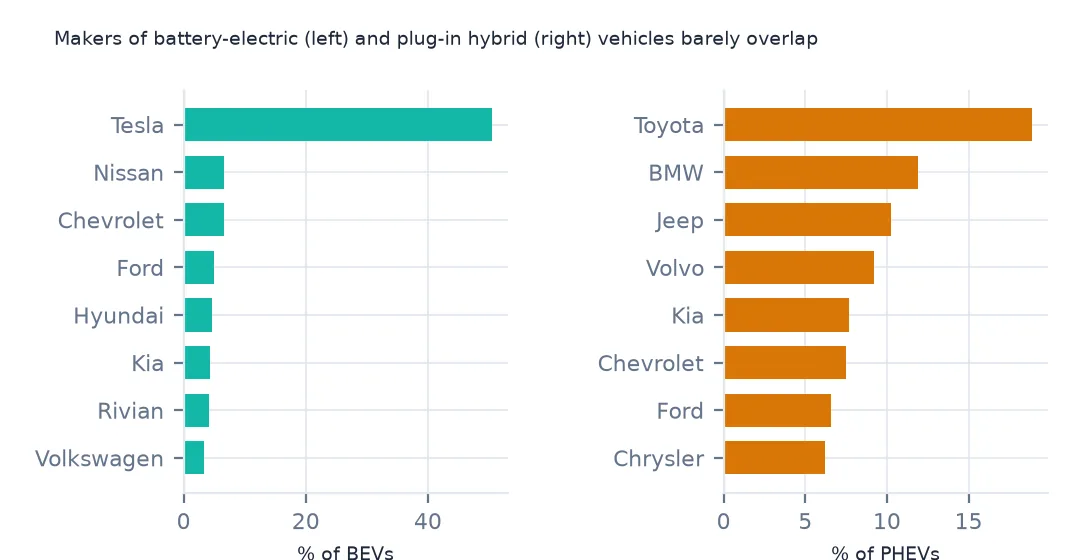
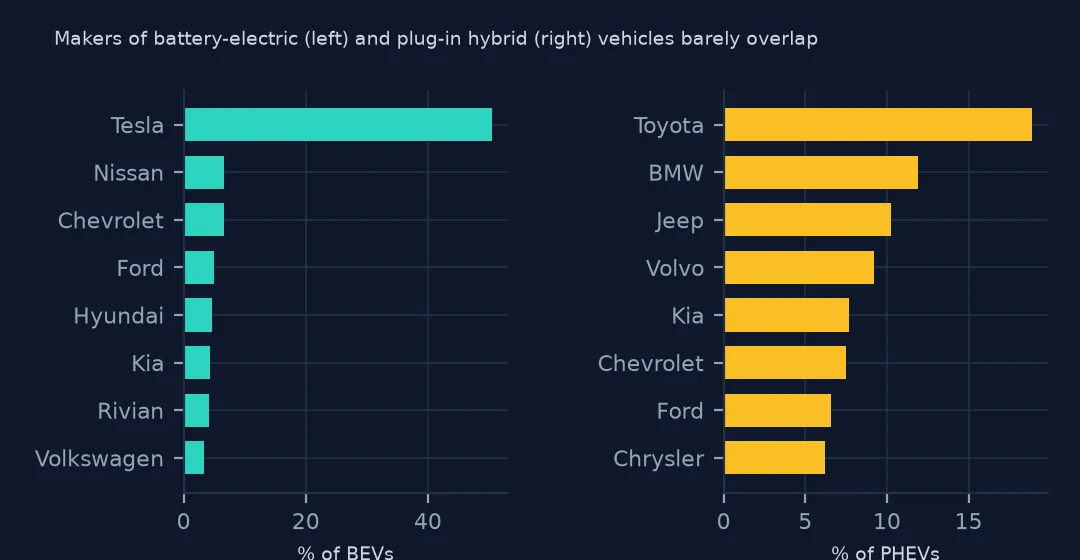
BEV {'TESLA': 0.505, 'NISSAN': 0.066, 'CHEVROLET': 0.066, 'FORD': 0.05, 'HYUNDAI': 0.046}
PHEV {'TOYOTA': 0.189, 'BMW': 0.119, 'JEEP': 0.102, 'VOLVO': 0.092, 'KIA': 0.077}
The makers barely overlap. Tesla makes 50.5% of BEVs, and Nissan and Chevrolet 6.6% each. PHEVs are led by Toyota (18.9%), BMW, Jeep and Volvo. Brand rankings for "EVs" are therefore mostly Tesla rankings, and adding PHEVs brings in brands that sell few battery-electric cars.
3. Where each kind is registered
c = pd.crosstab(wa_ev.county, wa_ev.kind)
c = c[c.sum(axis=1) >= 500]
share = (c.PHEV / c.sum(axis=1)).sort_values()
print("lowest PHEV share:", share.head(3).round(3).to_dict(), "| highest:", share.tail(3).round(3).to_dict())
lowest PHEV share: {'Snohomish': 0.156, 'King': 0.173, 'Chelan': 0.183} | highest: {'Whitman': 0.295, 'Walla Walla': 0.299, 'Lewis': 0.305}
Among counties with enough EVs to compare, the plug-in hybrid share is lowest in Snohomish (15.6%) and King (17.3%) and highest in Lewis (30.5%), Walla Walla and Whitman. Longer drives, fewer fast chargers and colder winters make a petrol engine as backup more attractive outside the Seattle area.
Eligibility and the leading models
The data used on this page
The Washington State Department of Licensing's Electric Vehicle Population Data, saved on this site on 15 October 2026.
from pathlib import Path

import geopandas as gpd
import numpy as np
import pandas as pd
import requests

Path("data").mkdir(exist_ok=True)
# Washington State Department of Licensing, via data.wa.gov: Electric Vehicle Population Data (f6w7-q2d2), one row per
# registered battery-electric or plug-in hybrid vehicle, and Electric Vehicle Population Size History By County (3d5d-sdqb),
# monthly counts since 2017. Both are replaced monthly, so they are read from copies saved on this site on 15 October 2026.
FILES = ["wa-ev-population-2026-10-15.zip", "wa-ev-population-history-2026-10-15.zip"]
for name in FILES:
    if not Path(f"data/{name}").exists():
        Path(f"data/{name}").write_bytes(requests.get(f"https://data.spatialworkflow.io/{name}", timeout=600).content)
NAMES = {"VIN (1-10)": "vin10", "County": "county", "City": "city", "State": "state", "Postal Code": "zip", "Model Year": "model_year",
         "Make": "make", "Model": "model", "Electric Vehicle Type": "ev_type", "Clean Alternative Fuel Vehicle (CAFV) Eligibility": "cafv",
         "Electric Range": "range_mi", "Legislative District": "district", "DOL Vehicle ID": "dol_id", "Vehicle Location": "location",
         "Electric Utility": "utility", "2020 GEOID": "tract"}
ev = pd.read_csv("data/wa-ev-population-2026-10-15.zip", dtype={"Postal Code": str, "2020 GEOID": str}).rename(columns=NAMES)
ev["kind"] = ev.ev_type.str.extract(r"\((BEV|PHEV)\)")[0]
hist = pd.read_csv("data/wa-ev-population-history-2026-10-15.zip")
hist["date"] = pd.to_datetime(hist.Date, format="%B %d %Y")
print(f"{len(ev):,} electric vehicles registered with Washington DOL; history: {hist.date.min():%b %Y} to {hist.date.max():%b %Y}")
300,142 electric vehicles registered with Washington DOL; history: Jan 2017 to Sep 2026
Example 1: CAFV eligibility by kind
print(pd.crosstab(wa_ev.kind, wa_ev.cafv, normalize="index").round(3).to_string())cafv Clean Alternative Fuel Vehicle Eligible Eligibility unknown as battery range has not been researched Not eligible due to low battery range
kind
BEV 0.185 0.815 0.000
PHEV 0.587 0.000 0.413
Washington's Clean Alternative Fuel Vehicle eligibility, which once gave sales tax relief, requires at least 30 miles of electric range. 58.7% of PHEVs qualify and 41.3% do not, by battery size. 81.5% of BEVs are marked "eligibility unknown" only because their range has not been researched. Every BEV has far more than 30 miles.
Example 2: the most registered models of each kind
for k in ("BEV", "PHEV"):
    print(k, wa_ev[wa_ev.kind == k].groupby(["make", "model"]).size().sort_values(ascending=False).head(3).to_dict())
BEV {('TESLA', 'MODEL Y'): 66379, ('TESLA', 'MODEL 3'): 38735, ('NISSAN', 'LEAF'): 13357}
PHEV {('TOYOTA', 'RAV4 PRIME (PHEV)'): 5698, ('TOYOTA', 'PRIUS PRIME (PHEV)'): 4362, ('CHEVROLET', 'VOLT'): 4358}
The Tesla Model Y (66,379) and Model 3 (38,735) are the leading BEVs, with the Nissan Leaf third. The leading PHEVs are the Toyota RAV4 Prime (5,698), Prius Prime and the long-discontinued Chevrolet Volt, still on the road in large numbers.
Why the distinction matters
Both kinds plug in, so both count toward charging demand and toward Washington's zero-emission vehicle targets in some form. But a PHEV's emissions depend on how often it is charged and how far it is driven. Studies of real-world use in Europe and the US find PHEVs drive on electricity much less than their test cycle assumes. A BEV's emissions depend only on the grid, which in Washington is largely hydroelectric.
So a hundred BEVs and a hundred PHEVs are not the same thing for fuel tax revenue, petrol demand or carbon. Any analysis of EVs as climate policy should report the split, and ideally weight PHEVs by their electric range.
Classification notes
- Conventional hybrids (a Prius without a plug) are not in the file at all; only plug-in vehicles are.
- Some PHEV model names include "(PHEV)", others do not; use
Electric Vehicle Type, not the model string. - Zero range affects BEVs far more than PHEVs; filter it out before comparing ranges.
Internal links
- Average EV range comes out too low — zero means not researched
- How to rank EV makes and models — by place
- How to chart EV growth — BEV and PHEV over time
FAQ
What share of electric vehicles are plug-in hybrids?
In Washington, 19.4% of registered EVs are plug-in hybrids and 80.6% battery-electric (October 2026).
What is the typical electric range of a plug-in hybrid?
A median of 32 miles among Washington's registered PHEVs with a recorded range, against 215 miles for battery-electric vehicles.