
EV Share of the Fleet Explained: Registered Stock Against Yearly Additions
On this page
Problem statement
"EVs are 6% of Washington's cars" and "EVs are a large share of new cars" can both be true, and confusing them is the most common mistake in EV statistics. The first is the share of the registered stock, every vehicle on the road. The second is a share of the flow, the vehicles added. The stock changes slowly because cars last a long time, so it lags far behind the flow. This page computes both from Washington's monthly registration counts, shows how a fleet can gain EVs while losing vehicles overall, and what the stock's growth rate implies.
Quick answer
Stock share is EVs divided by all registered vehicles at one date. The flow is the change in each between two dates: net EV additions against net additions of all vehicles. When the total fleet is flat or shrinking, EVs can be most or all of the net additions while still a small share of the stock.
w = hist[(hist.State == "WA") & (hist["Vehicle Primary Use"] == "Passenger")].groupby("date")[["Electric Vehicle (EV) Total", "Total Vehicles"]].sum()
w.columns = ["ev", "all"]
y = w[w.index.month == 9]
add = y.diff().dropna()
print(pd.DataFrame({"stock_share": (y.ev / y["all"]).round(4), "ev_added": add.ev, "all_added": add["all"]}).dropna().to_string())
stock_share ev_added all_added
date
2018-09-30 0.0076 9742.0 95906.0
2019-09-30 0.0102 13729.0 94220.0
2020-09-30 0.0124 10559.0 -10135.0
2021-09-30 0.0163 19561.0 43964.0
2022-09-30 0.0216 24966.0 -62994.0
2023-09-30 0.0311 46031.0 -12962.0
2024-09-30 0.0418 53189.0 25975.0
2025-09-30 0.0519 53077.0 72460.0
2026-09-30 0.0591 25899.0 -163232.0
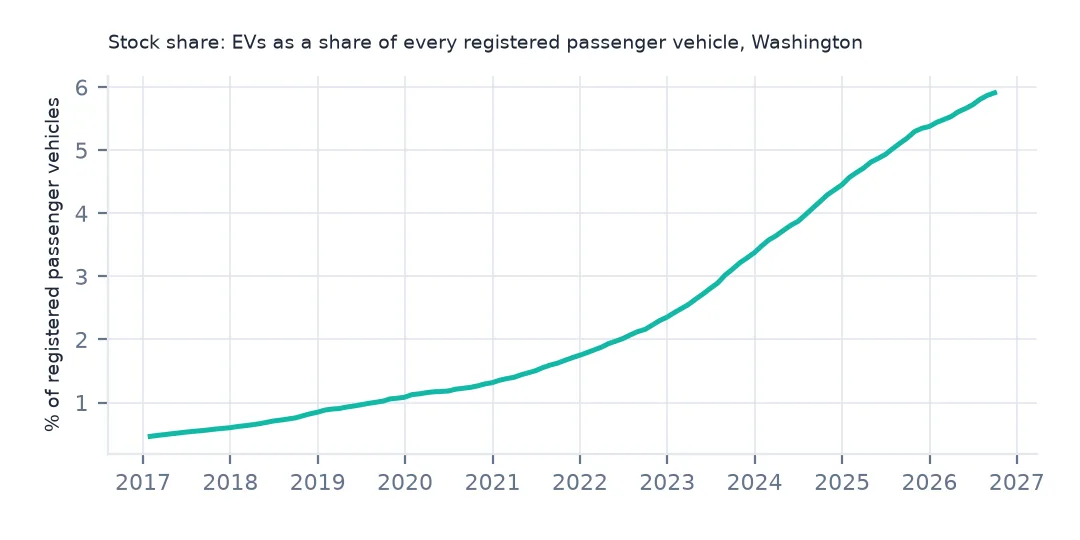
The stock share rose every year, from 0.76% in September 2018 to 5.91% in September 2026. In several years the fleet as a whole shrank while EVs grew. From 2022 to 2023, for example, 46,031 EVs were added while the total fell by 12,962.
Stock, net additions and model years
1. Stock share
print(f"September 2026: {w.ev.iloc[-1]:,} EVs among {w['all'].iloc[-1]:,} passenger vehicles = {w.ev.iloc[-1] / w['all'].iloc[-1]:.2%}")September 2026: 283,426 EVs among 4,796,021 passenger vehicles = 5.91%
The stock share is a simple ratio: 283,426 EVs among 4,796,021 passenger vehicles, 5.91%. It answers fleet questions, such as electricity demand, petrol tax revenue and tailpipe emissions.
2. Additions to the fleet
for a, b in [("2022-09-30", "2023-09-30"), ("2023-09-30", "2024-09-30"), ("2024-09-30", "2025-09-30"), ("2025-09-30", "2026-09-30")]:
    d = w.loc[b] - w.loc[a]
    print(f"{a[:4]}-{b[:4]}: EVs {d.ev:+,}, all vehicles {d['all']:+,}")
2022-2023: EVs +46,031, all vehicles -12,962
2023-2024: EVs +53,189, all vehicles +25,975
2024-2025: EVs +53,077, all vehicles +72,460
2025-2026: EVs +25,899, all vehicles -163,232
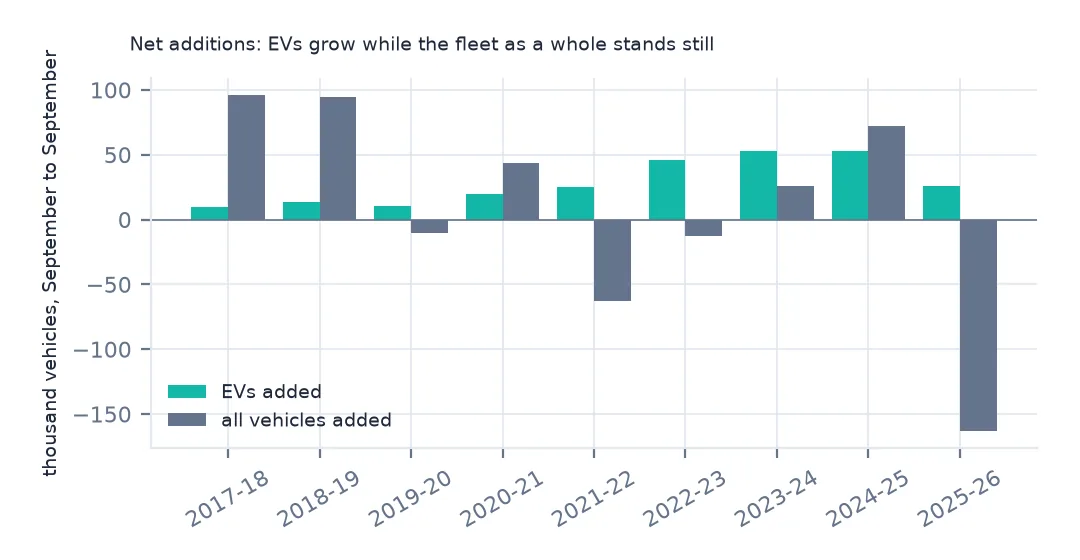
Net additions are a different picture. In 2022–23 the fleet lost 12,962 vehicles while gaining 46,031 EVs, so EVs were more than all of the net growth. In 2024–25 EVs were 53,077 of the 72,460 vehicles added, about three in four. In 2025–26 the EV gain halved to 25,899 and the fleet shrank by 163,232, a drop large enough to be partly a change in the registration records. Net additions are fragile, because they subtract two large numbers, but they show what is changing.
3. New model years as a sales proxy
wa_ev = ev[ev.state == "WA"]
print("EVs by model year in the current file:", wa_ev.model_year.value_counts().sort_index().loc[2019:2027].to_dict())
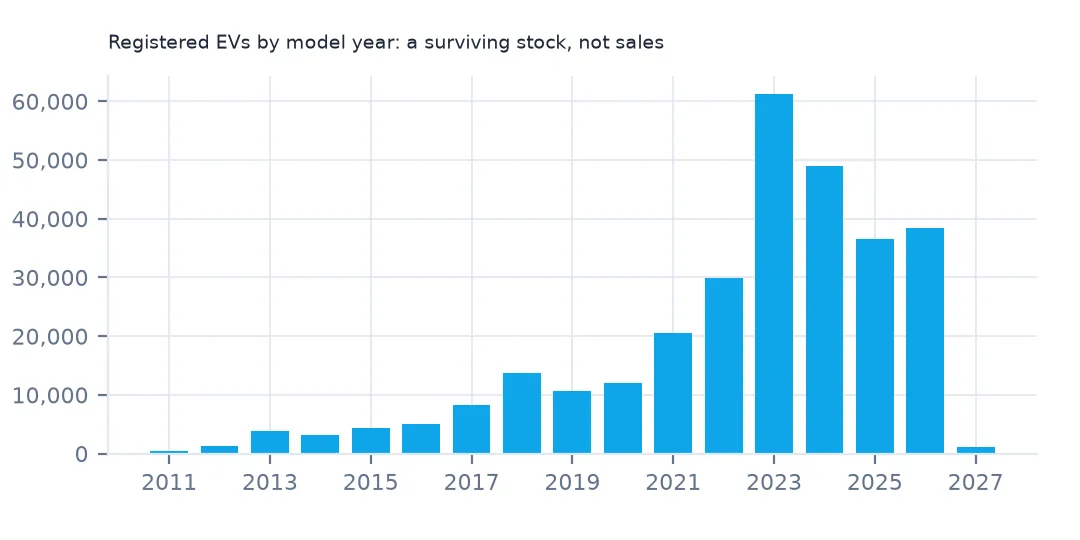
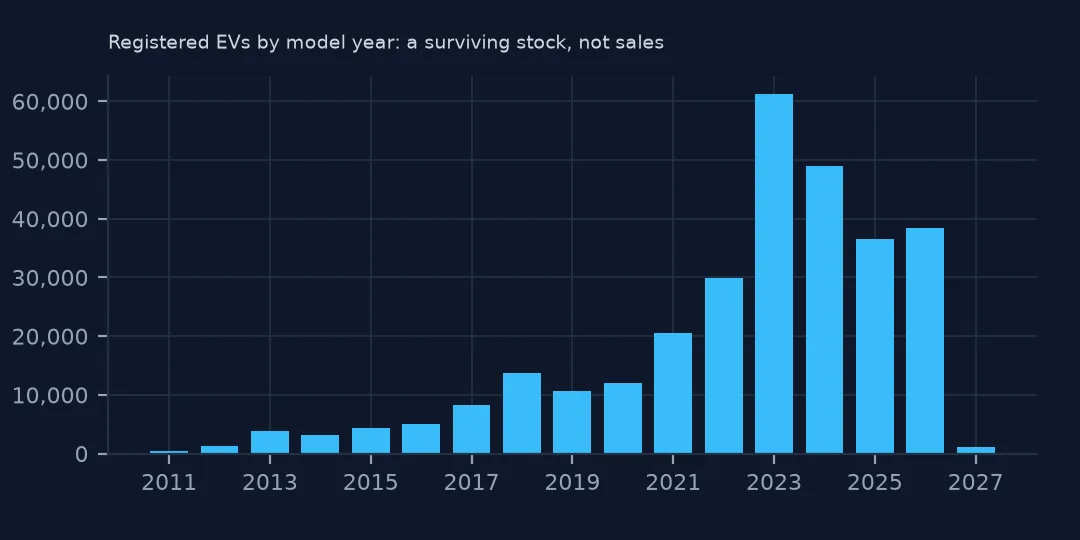
EVs by model year in the current file: {2019: 10638, 2020: 11981, 2021: 20604, 2022: 29844, 2023: 61316, 2024: 48979, 2025: 36484, 2026: 38436, 2027: 1040}
Model years in the vehicle file are a rough proxy for sales: 61,316 model-2023 EVs are registered, 48,979 of 2024, 36,484 of 2025 and 38,436 of 2026 (with a year still to run for 2026 models). This is the surviving stock by model year, not sales. Some 2023 cars have already left the state, and used imports have arrived. New-registration data would be the true flow measure.
Growth rates and fleet turnover
The data used on this page
The Washington State Department of Licensing's Electric Vehicle Population Size History By County and Electric Vehicle Population Data, saved on this site on 15 October 2026.
from pathlib import Path

import geopandas as gpd
import numpy as np
import pandas as pd
import requests

Path("data").mkdir(exist_ok=True)
# Washington State Department of Licensing, via data.wa.gov: Electric Vehicle Population Data (f6w7-q2d2), one row per
# registered battery-electric or plug-in hybrid vehicle, and Electric Vehicle Population Size History By County (3d5d-sdqb),
# monthly counts since 2017. Both are replaced monthly, so they are read from copies saved on this site on 15 October 2026.
FILES = ["wa-ev-population-2026-10-15.zip", "wa-ev-population-history-2026-10-15.zip"]
for name in FILES:
    if not Path(f"data/{name}").exists():
        Path(f"data/{name}").write_bytes(requests.get(f"https://data.spatialworkflow.io/{name}", timeout=600).content)
NAMES = {"VIN (1-10)": "vin10", "County": "county", "City": "city", "State": "state", "Postal Code": "zip", "Model Year": "model_year",
         "Make": "make", "Model": "model", "Electric Vehicle Type": "ev_type", "Clean Alternative Fuel Vehicle (CAFV) Eligibility": "cafv",
         "Electric Range": "range_mi", "Legislative District": "district", "DOL Vehicle ID": "dol_id", "Vehicle Location": "location",
         "Electric Utility": "utility", "2020 GEOID": "tract"}
ev = pd.read_csv("data/wa-ev-population-2026-10-15.zip", dtype={"Postal Code": str, "2020 GEOID": str}).rename(columns=NAMES)
ev["kind"] = ev.ev_type.str.extract(r"\((BEV|PHEV)\)")[0]
hist = pd.read_csv("data/wa-ev-population-history-2026-10-15.zip")
hist["date"] = pd.to_datetime(hist.Date, format="%B %d %Y")
print(f"{len(ev):,} electric vehicles registered with Washington DOL; history: {hist.date.min():%b %Y} to {hist.date.max():%b %Y}")
300,142 electric vehicles registered with Washington DOL; history: Jan 2017 to Sep 2026
Example 1: how long until a given stock share
g = (w.ev.iloc[-1] / w.ev.loc["2023-09-30"]) ** (1 / 3) - 1
years = np.log(0.25 * w["all"].iloc[-1] / w.ev.iloc[-1]) / np.log(1 + g)
print(f"EV stock growth, September 2023 to 2026: {g:.1%} a year; at that rate the stock reaches 25% of today's fleet in {years:.1f} years")
EV stock growth, September 2023 to 2026: 23.3% a year; at that rate the stock reaches 25% of today's fleet in 6.9 years
From September 2023 to 2026 the EV stock grew 23.3% a year. If that continued, EVs would reach a quarter of today's fleet in 6.9 years. That is an extrapolation, not a forecast: the latest year's growth was much slower, and a stock cannot grow faster than the fleet turns over once EVs dominate new purchases.
Example 2: the fleet turns over slowly
print("all passenger vehicles, September of each year:", {d.year: v for d, v in y["all"].items()})all passenger vehicles, September of each year: {2017: 4712819, 2018: 4808725, 2019: 4902945, 2020: 4892810, 2021: 4936774, 2022: 4873780, 2023: 4860818, 2024: 4886793, 2025: 4959253, 2026: 4796021}
The total fleet stayed just under five million passenger vehicles throughout 2017–2026 (4,712,819 in 2017, 4,959,253 in 2025). Only a small fraction of it is replaced each year. That turnover sets the speed limit for the stock share: even if every new car were electric, the stock would take well over a decade to become mostly electric.
Stock and flow
A fleet is a stock fed by a flow of new and used vehicles and drained by scrappage and departures. The stock share of any technology approaches its share of the inflow only after a full replacement cycle, about the median vehicle lifetime of 15–20 years. So the stock share is always a lagging, smoothed version of buying behaviour: today's 5.91% reflects purchases made over the last decade, when EVs were a much smaller part of the market than they are now.
For policy, both matter. Emissions and energy demand follow the stock. Market progress and the effect of incentives show up first in the flow.
Pitfalls
- Do not compare a stock share with a sales share. Sales shares from dealers or manufacturers are flows.
- EV additions can be more than the whole of the fleet's change when the fleet shrinks. That is arithmetic, not an error.
- Registration clean-ups move both numerator and denominator; look at both before reading a change.
- Passenger vehicles only: trucks have a different turnover and almost no EVs.
Internal links
- How to chart EV growth — the monthly series
- How to map EV adoption by county — the stock share by county
- Battery electric against plug-in hybrid — what counts as an EV
FAQ
What share of Washington's vehicles are electric?
5.91% of registered passenger vehicles in September 2026 (283,426 of 4,796,021). That is the stock share; the share of vehicles added each year is much higher.
Why is the EV share of all cars so much lower than the EV share of sales?
Because the registered stock includes every car on the road, most bought years ago. The stock share catches up with the sales share only after a full replacement cycle of the fleet.