
How to Chart Electric Vehicle Growth from Monthly Registration Counts
On this page
Problem statement
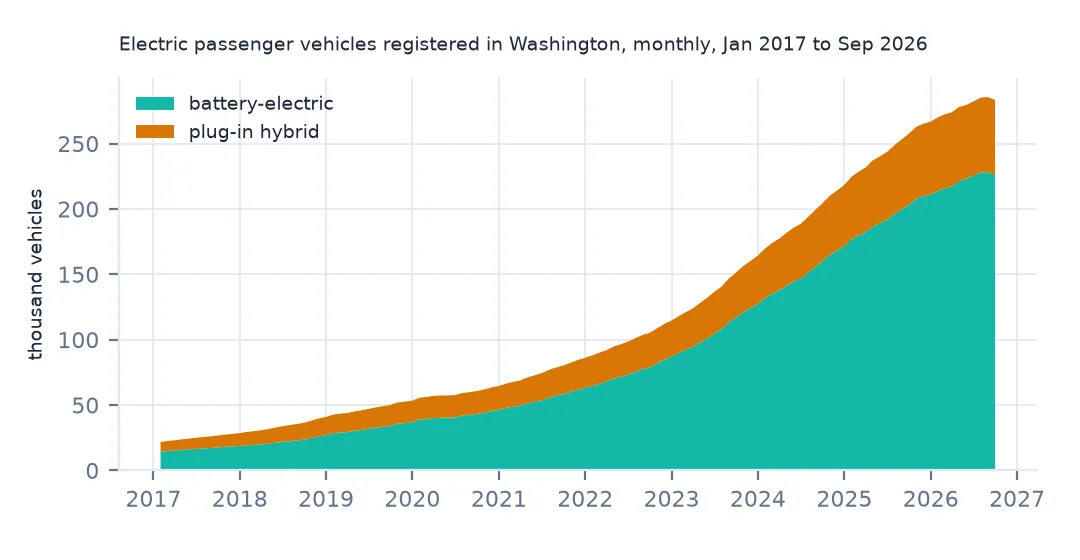
How fast is the electric fleet growing, and is it slowing? Washington's Department of Licensing has published monthly counts of registered EVs by county since January 2017, alongside every non-electric vehicle, which makes it one of the longest consistent EV series in the US. This page charts the statewide electric passenger fleet from 21,779 vehicles to 283,426, measures growth year by year, looks at the latest months, where the count fell for the first time, and shows how the denominator moves.
Quick answer
Filter the history to State == "WA" and passenger vehicles, sum by date, and plot Electric Vehicle (EV) Total (split into BEV and PHEV if you like). Compare like months (December to December) for growth rates, and divide by Total Vehicles for share.
wa_h = hist[(hist.State == "WA") & (hist["Vehicle Primary Use"] == "Passenger")]
m = wa_h.groupby("date")[["Battery Electric Vehicles (BEVs)", "Plug-In Hybrid Electric Vehicles (PHEVs)", "Electric Vehicle (EV) Total", "Total Vehicles"]].sum()
m.columns = ["bev", "phev", "ev", "all"]
print(m.iloc[[0, 12 * 3, 12 * 6, -13, -1]].to_string())
bev phev ev all
date
2017-01-31 14345 7434 21779 4699157
2020-01-31 38838 16762 55600 4934667
2023-01-31 89923 28139 118062 4865162
2025-09-30 203164 54363 257527 4959253
2026-09-30 226166 57260 283426 4796021
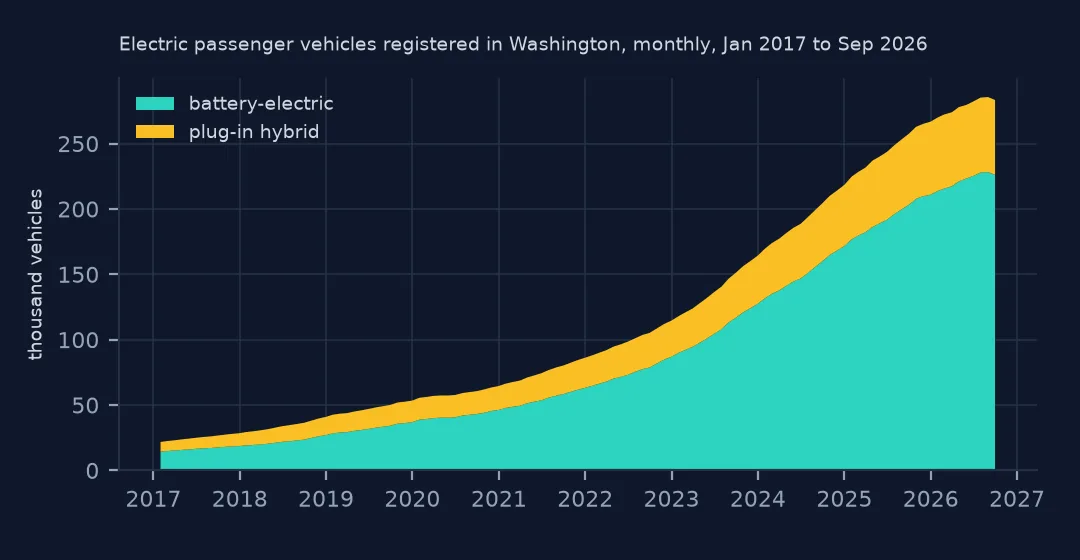
The electric passenger fleet grew from 21,779 in January 2017 to 55,600 three years later, 118,062 in January 2023 and 283,426 in September 2026, thirteen times in under ten years. Battery-electric vehicles grew faster than plug-in hybrids: 14,345 to 226,166 against 7,434 to 57,260.
Growth rates, recent months and the denominator
1. Year-on-year growth
dec = m[m.index.month == 12].ev
dec.index = dec.index.year
print("EVs at each December:", dec.to_dict())
print("growth over the year:", dec.pct_change().round(3).dropna().to_dict())
EVs at each December: {2017: 28485, 2018: 40927, 2019: 53399, 2020: 64557, 2021: 86168, 2022: 114558, 2023: 164267, 2024: 218355, 2025: 266805}
growth over the year: {2018: 0.437, 2019: 0.305, 2020: 0.209, 2021: 0.335, 2022: 0.329, 2023: 0.434, 2024: 0.329, 2025: 0.222}
December to December, the fleet grew by between a fifth and almost half every year: 43.7% in 2018, 20.9% in the pandemic year 2020, 43.4% in 2023, then 32.9% in 2024 and 22.2% in 2025. The absolute additions kept rising until 2024, but the rate has fallen, as it must when the base grows.
2. The latest months
print("monthly change:", {f"{d:%Y-%m}": int(v) for d, v in m.ev.diff().tail(8).items()})
print(f"peak {m.ev.max():,} in {m.ev.idxmax():%B %Y}; latest {m.ev.iloc[-1]:,}")
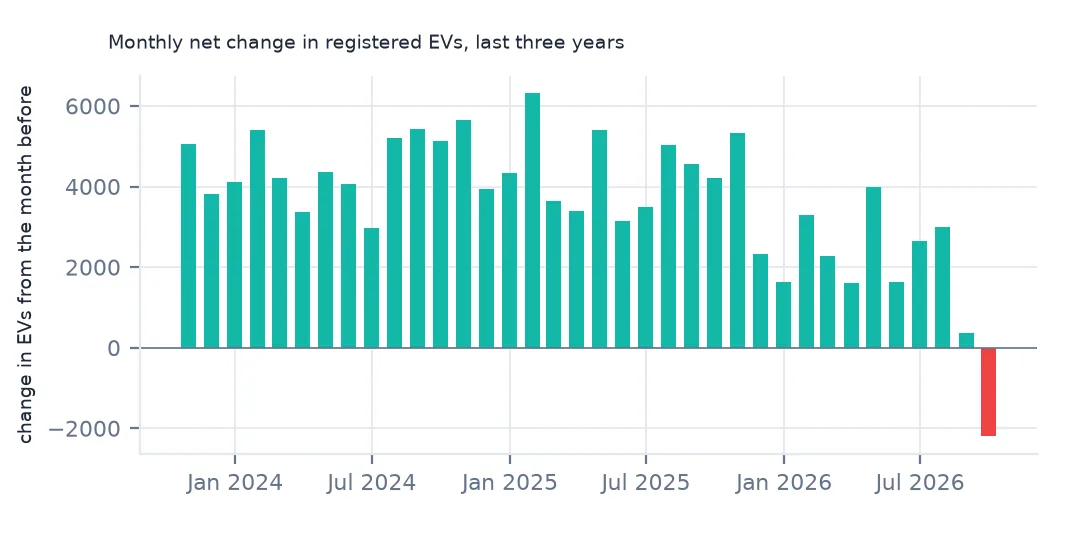
monthly change: {'2026-02': 2281, '2026-03': 1604, '2026-04': 3999, '2026-05': 1619, '2026-06': 2658, '2026-07': 3004, '2026-08': 370, '2026-09': -2202}
peak 285,628 in August 2026; latest 283,426
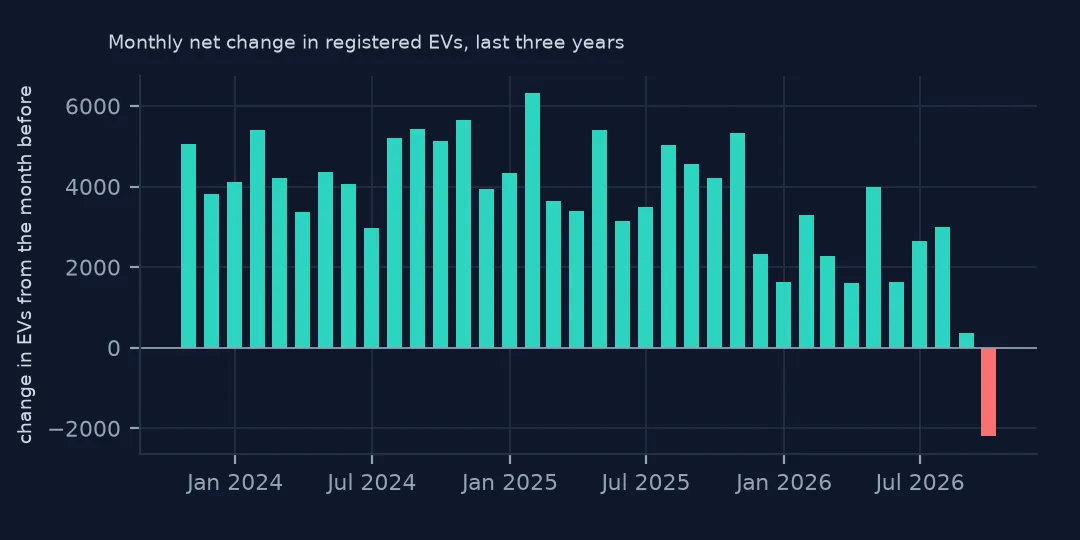
2026 shows a clear slowdown: monthly additions of 1,604 to 3,999 through July, 370 in August and a fall of 2,202 in September, the first real monthly decline in the series (May 2020 lost 3 vehicles). The peak was 285,628 in August 2026. One month is not a trend, and the denominator fell at the same time (next step), which points to a registration-data effect as much as to fewer EVs. Watch the next months before reading it as a turning point.
3. The denominator moves too
print("all registered passenger vehicles:", {f"{d:%Y-%m}": v for d, v in m["all"].iloc[[0, 36, 72, -3, -2, -1]].items()})
print(f"EV share: {m.ev.iloc[0] / m['all'].iloc[0]:.2%} in {m.index[0]:%b %Y}, {m.ev.iloc[-1] / m['all'].iloc[-1]:.2%} in {m.index[-1]:%b %Y}")
all registered passenger vehicles: {'2017-01': 4699157, '2020-01': 4934667, '2023-01': 4865162, '2026-07': 4913391, '2026-08': 4866875, '2026-09': 4796021}
EV share: 0.46% in Jan 2017, 5.91% in Sep 2026
All registered passenger vehicles barely changed over the decade (4,699,157 in January 2017, 4,913,391 in July 2026), then fell by more than a hundred thousand in two months to 4,796,021. That sudden drop is larger than any real change in car ownership would be, and it coincides with the EV decline. Registrations expiring without renewal, or a change in how DOL counts them, are the likely cause. The EV share rose from 0.46% to 5.91% over the period.
Where the growth happened
The data used on this page
The Washington State Department of Licensing's Electric Vehicle Population Size History By County, saved on this site on 15 October 2026.
from pathlib import Path

import geopandas as gpd
import numpy as np
import pandas as pd
import requests

Path("data").mkdir(exist_ok=True)
# Washington State Department of Licensing, via data.wa.gov: Electric Vehicle Population Data (f6w7-q2d2), one row per
# registered battery-electric or plug-in hybrid vehicle, and Electric Vehicle Population Size History By County (3d5d-sdqb),
# monthly counts since 2017. Both are replaced monthly, so they are read from copies saved on this site on 15 October 2026.
FILES = ["wa-ev-population-2026-10-15.zip", "wa-ev-population-history-2026-10-15.zip"]
for name in FILES:
    if not Path(f"data/{name}").exists():
        Path(f"data/{name}").write_bytes(requests.get(f"https://data.spatialworkflow.io/{name}", timeout=600).content)
NAMES = {"VIN (1-10)": "vin10", "County": "county", "City": "city", "State": "state", "Postal Code": "zip", "Model Year": "model_year",
         "Make": "make", "Model": "model", "Electric Vehicle Type": "ev_type", "Clean Alternative Fuel Vehicle (CAFV) Eligibility": "cafv",
         "Electric Range": "range_mi", "Legislative District": "district", "DOL Vehicle ID": "dol_id", "Vehicle Location": "location",
         "Electric Utility": "utility", "2020 GEOID": "tract"}
ev = pd.read_csv("data/wa-ev-population-2026-10-15.zip", dtype={"Postal Code": str, "2020 GEOID": str}).rename(columns=NAMES)
ev["kind"] = ev.ev_type.str.extract(r"\((BEV|PHEV)\)")[0]
hist = pd.read_csv("data/wa-ev-population-history-2026-10-15.zip")
hist["date"] = pd.to_datetime(hist.Date, format="%B %d %Y")
print(f"{len(ev):,} electric vehicles registered with Washington DOL; history: {hist.date.min():%b %Y} to {hist.date.max():%b %Y}")
300,142 electric vehicles registered with Washington DOL; history: Jan 2017 to Sep 2026
Example 1: King County against the rest
k = wa_h.assign(area=np.where(wa_h.County == "King", "King", "rest of WA")).groupby(["date", "area"])["Electric Vehicle (EV) Total"].sum().unstack()
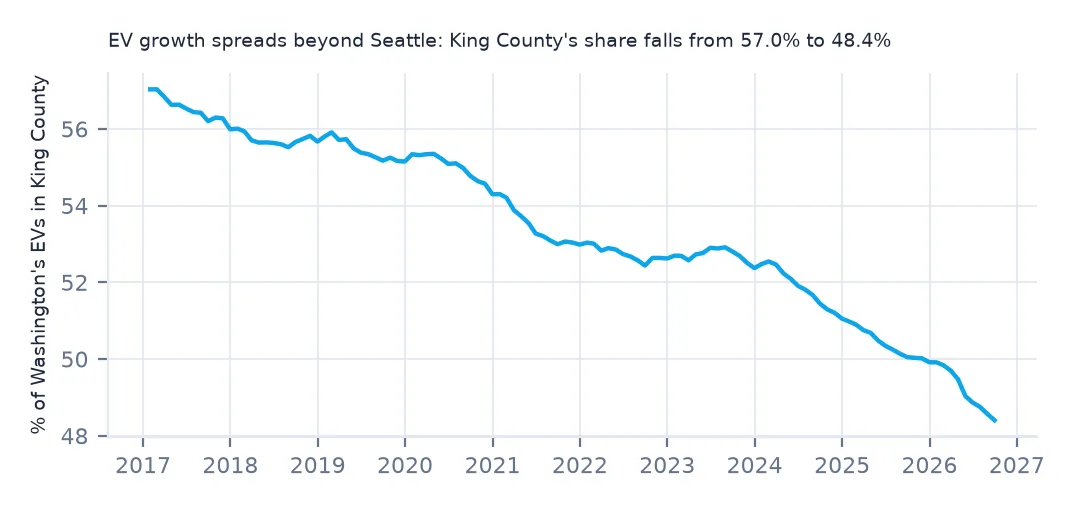
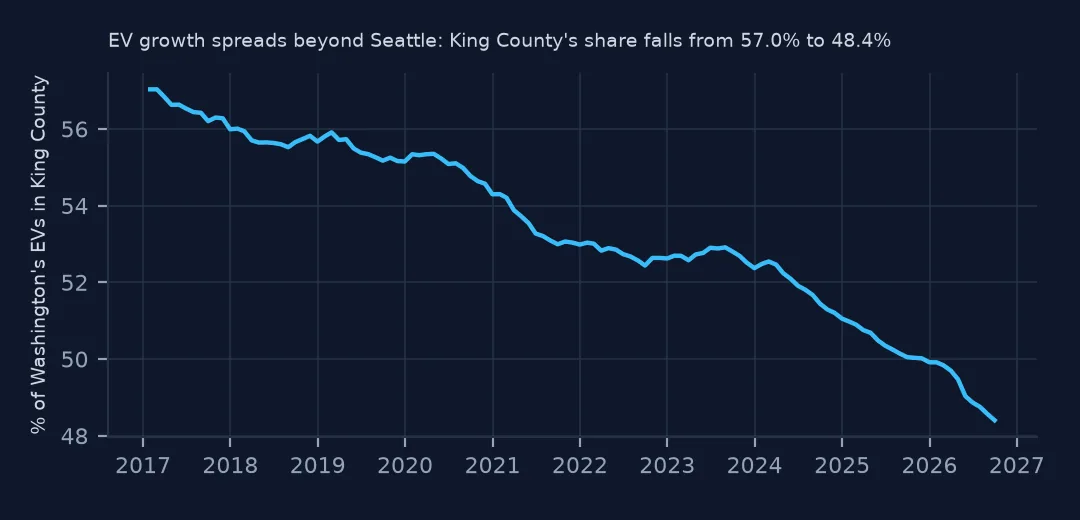
print("King County's share of Washington's EVs:", {f"{d:%Y-%m}": v for d, v in (k["King"] / k.sum(axis=1)).iloc[[0, 36, 72, -1]].round(3).items()})
King County's share of Washington's EVs: {'2017-01': 0.57, '2020-01': 0.553, '2023-01': 0.527, '2026-09': 0.484}
King County held 57.0% of Washington's EVs in January 2017 and 48.4% in September 2026. Growth has spread outward: EVs are still concentrated around Seattle, but less so every year.
Example 2: battery-electric share of the EV fleet
print("BEV share of EVs:", {f"{d:%Y-%m}": v for d, v in (m.bev / m.ev).iloc[[0, 24, 48, 72, 96, -1]].round(3).items()})BEV share of EVs: {'2017-01': 0.659, '2019-01': 0.665, '2021-01': 0.72, '2023-01': 0.762, '2025-01': 0.786, '2026-09': 0.798}
Battery-electric vehicles rose from 65.9% of the electric fleet in 2017 to 79.8% in 2026, as long-range models arrived. Plug-in hybrids still grow in number, but more slowly.
What the counts are
Each monthly figure is the number of vehicles with an active registration at the end of the month, by the owner's county. It rises with new purchases and used EVs brought into the state, and falls when cars are sold out of state, scrapped, or their registration lapses. Because the series counts the stock, its month-to-month change is net additions, not sales. A month with many lapsed registrations can show a decline even while new EVs are being sold.
Charting choices
- Log scale or linear. Growth of a fifth to two-fifths a year is clearest on a log axis; absolute additions on a linear one.
- Compare like months. Registration renewals and model-year launches are seasonal.
- Passenger only. Trucks are a separate class with very few EVs.
- Out-of-state rows in the history are WA-registered vehicles with other states' counties; exclude them for state totals.
Internal links
- How to map EV adoption by county — the latest month on a map
- EV share of the fleet explained — stock against additions
- Battery electric against plug-in hybrid — the two kinds of EV
FAQ
How fast are electric vehicles growing in Washington?
The electric passenger fleet grew 22.2% in 2025 and 32.9% in 2024, from 21,779 vehicles in January 2017 to 283,426 in September 2026.
Did EV registrations in Washington fall in 2026?
The count fell by 2,202 in September 2026, the first real monthly decline since 2017, while all registered vehicles also dropped sharply.