
What Share of Washington's Cars Are Electric? EV Adoption County by County
On this page
Problem statement
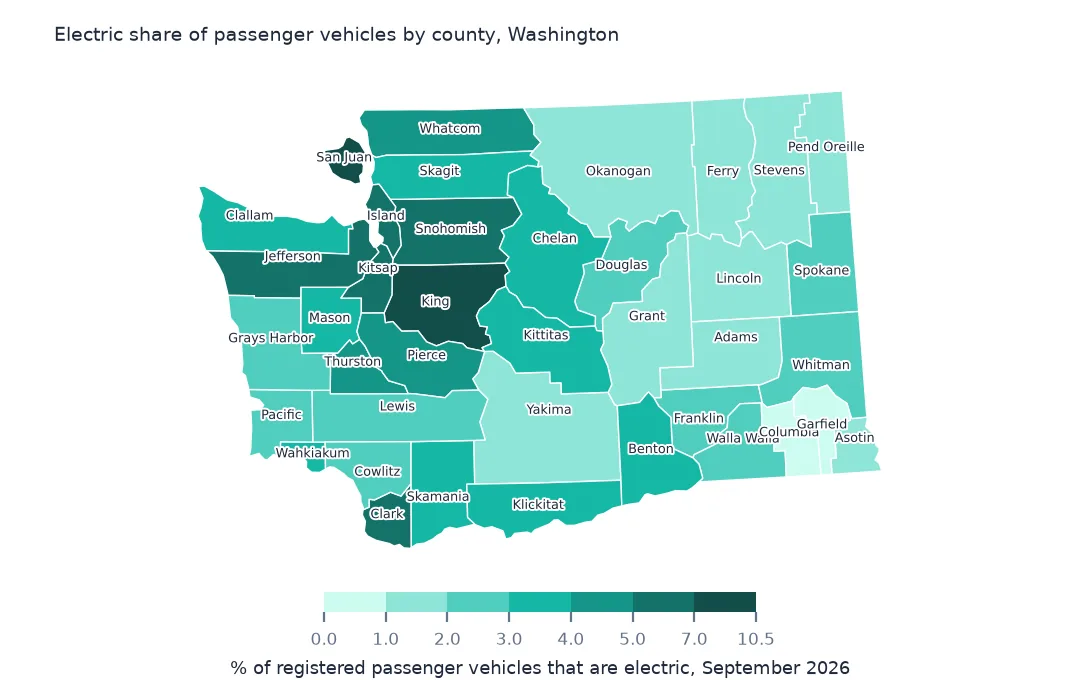
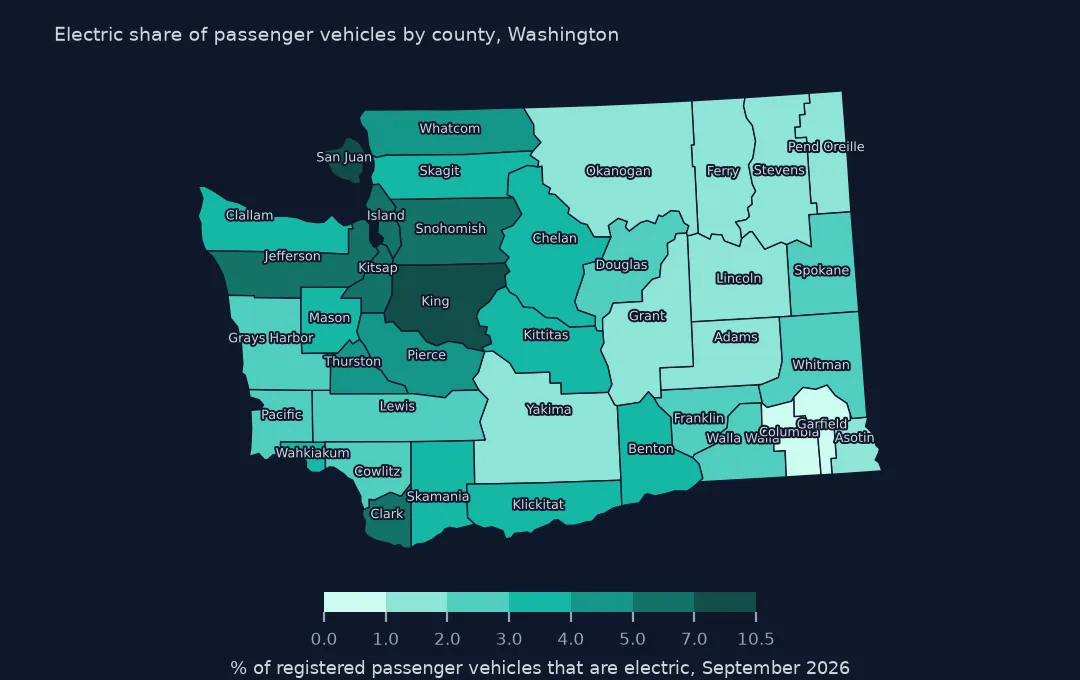
What share of the cars in each county are electric? A map of EV counts per county is mostly a map of where people live: King County, home to Seattle, has more EVs than the next nine counties together. Adoption is a share, EVs out of all registered vehicles, and Washington's Department of Licensing publishes exactly the denominator needed, every month, by county. This page maps the electric share of passenger vehicles in September 2026 across Washington's 39 counties, checks it against the published percentage, and compares the two sides of the Cascades and the change since 2020.
Quick answer
From the Population Size History By County dataset, take the latest month, State == "WA" and Vehicle Primary Use == "Passenger", divide Electric Vehicle (EV) Total by Total Vehicles, and join to county boundaries on the county name.
last = hist[(hist.date == hist.date.max()) & (hist.State == "WA") & (hist["Vehicle Primary Use"] == "Passenger")].copy()
last["share"] = last["Electric Vehicle (EV) Total"] / last["Total Vehicles"]
m = wa.merge(last, left_on="NAME", right_on="County", how="left")
print(f"{hist.date.max():%B %Y}: {last['Electric Vehicle (EV) Total'].sum():,} electric passenger vehicles of {last['Total Vehicles'].sum():,} "
      f"({last['Electric Vehicle (EV) Total'].sum() / last['Total Vehicles'].sum():.2%}); counties matched {m.share.notna().sum()} of {len(wa)}")
September 2026: 283,426 electric passenger vehicles of 4,796,021 (5.91%); counties matched 39 of 39
In September 2026, 283,426 of Washington's 4,796,021 registered passenger vehicles were electric, 5.91%. All 39 counties match Census county names.
Share, checks and vehicle classes
1. Use the share, not the count
r = last.set_index("County")
print("most EVs:", r["Electric Vehicle (EV) Total"].sort_values(ascending=False).head(3).to_dict())
print("highest share:", r.share.sort_values(ascending=False).head(4).round(4).to_dict())
print("lowest share:", r.share.sort_values().head(3).round(4).to_dict())
most EVs: {'King': 137189, 'Snohomish': 36281, 'Pierce': 23704}
highest share: {'King': 0.0999, 'San Juan': 0.0925, 'Snohomish': 0.0674, 'Jefferson': 0.0649}
lowest share: {'Garfield': 0.0064, 'Columbia': 0.0085, 'Adams': 0.01}
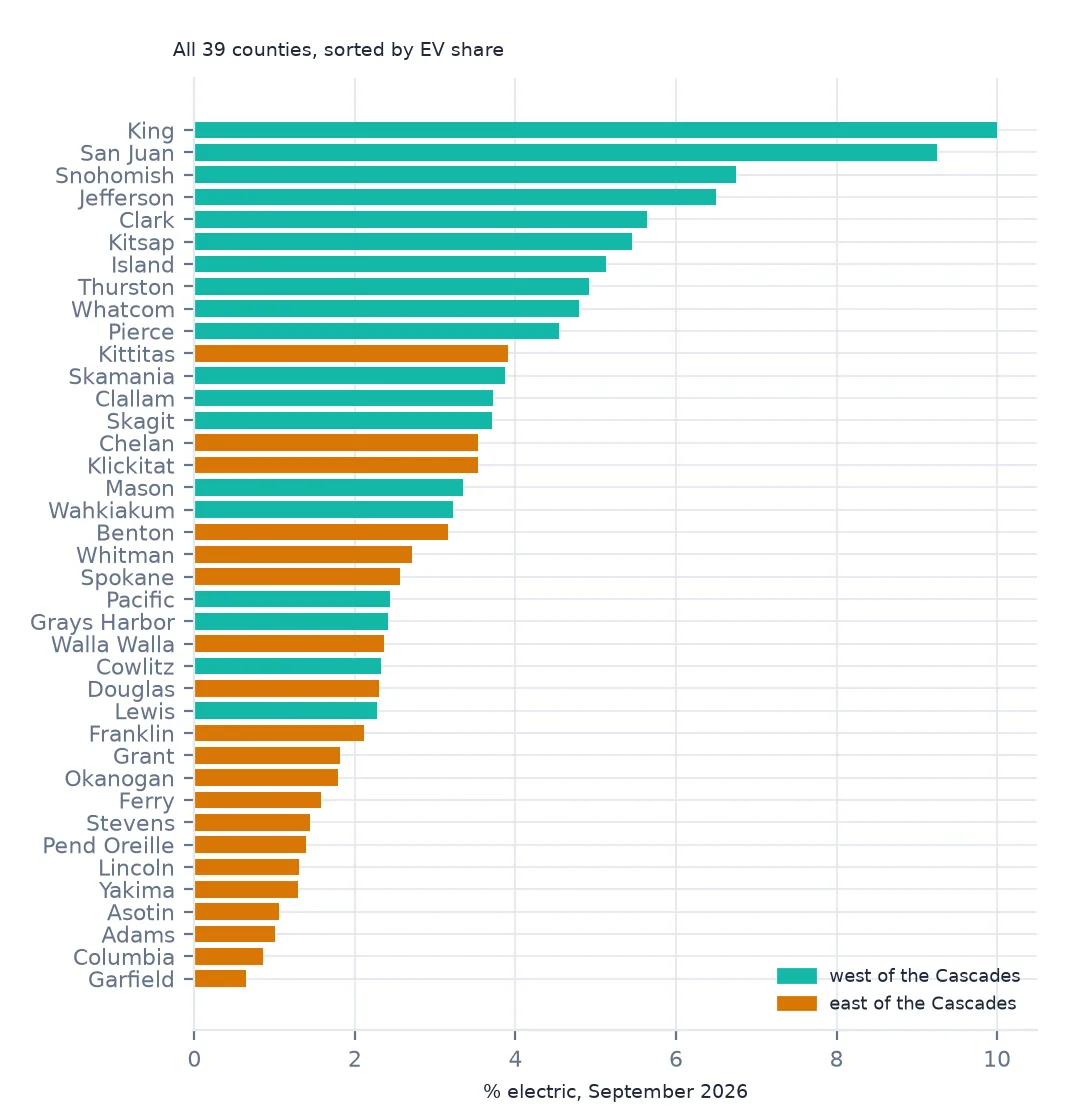
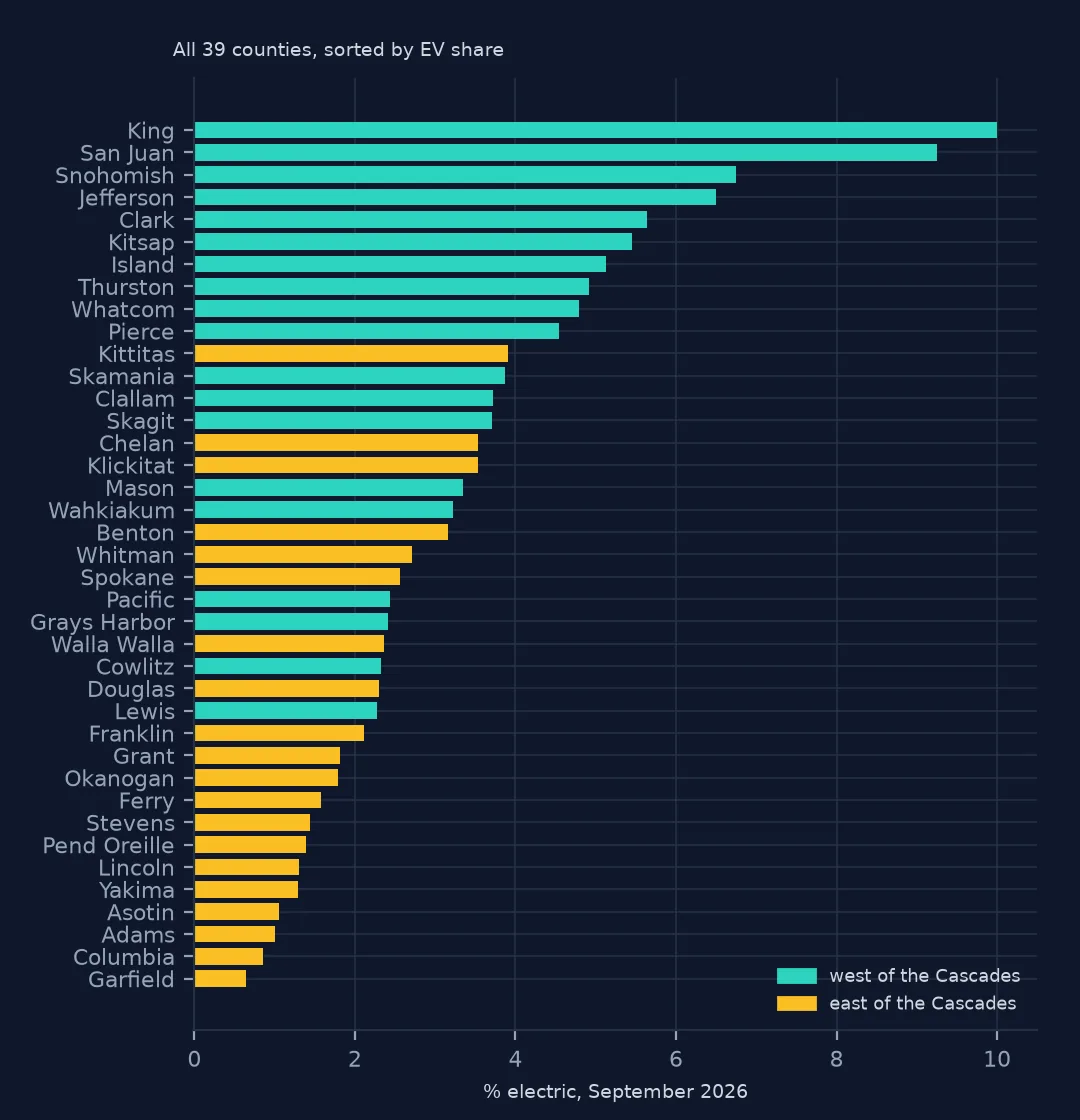
By count, King (137,189), Snohomish and Pierce lead, the three most populous counties. By share, King still leads at 9.99%, but San Juan County, the islands north of Puget Sound, is close behind at 9.25%, and rural Jefferson County ranks fourth (6.49%). The lowest shares are in the dry, rural south-east: Garfield (0.64%), Columbia and Adams.
2. Check the published percentage
print(f"largest gap between our share and Percent Electric Vehicles: {(r.share * 100 - r['Percent Electric Vehicles']).abs().max():.3f} points")largest gap between our share and Percent Electric Vehicles: 0.005 points
The computed share matches the published Percent Electric Vehicles to within 0.005 points, which is rounding. Computing it yourself keeps the full precision and lets you aggregate counties correctly: the share of a region is total EVs over total vehicles, not an average of county percentages.
3. Passenger and truck
t = hist[(hist.date == hist.date.max()) & (hist.State == "WA")].groupby("Vehicle Primary Use")[["Electric Vehicle (EV) Total", "Total Vehicles"]].sum()
print(t.assign(share=lambda d: (d["Electric Vehicle (EV) Total"] / d["Total Vehicles"]).round(4)).to_string())
Electric Vehicle (EV) Total Total Vehicles share
Vehicle Primary Use
Passenger 283426 4796021 0.0591
Truck 8073 1181392 0.0068
Trucks are a separate class: 8,073 electric trucks among 1,181,392, 0.68%, against 5.91% for passenger vehicles. Mixing the two lowers the share and penalises rural counties where pickups make up more of the fleet.
The Cascades and the change since 2020
The data used on this page
The Washington State Department of Licensing's Electric Vehicle Population Size History By County, saved on this site on 15 October 2026, and Census Bureau 2023 county boundaries.
from pathlib import Path

import geopandas as gpd
import numpy as np
import pandas as pd
import requests

Path("data").mkdir(exist_ok=True)
# Washington State Department of Licensing, via data.wa.gov: Electric Vehicle Population Data (f6w7-q2d2), one row per
# registered battery-electric or plug-in hybrid vehicle, and Electric Vehicle Population Size History By County (3d5d-sdqb),
# monthly counts since 2017. Both are replaced monthly, so they are read from copies saved on this site on 15 October 2026.
FILES = ["wa-ev-population-2026-10-15.zip", "wa-ev-population-history-2026-10-15.zip"]
for name in FILES:
    if not Path(f"data/{name}").exists():
        Path(f"data/{name}").write_bytes(requests.get(f"https://data.spatialworkflow.io/{name}", timeout=600).content)
NAMES = {"VIN (1-10)": "vin10", "County": "county", "City": "city", "State": "state", "Postal Code": "zip", "Model Year": "model_year",
         "Make": "make", "Model": "model", "Electric Vehicle Type": "ev_type", "Clean Alternative Fuel Vehicle (CAFV) Eligibility": "cafv",
         "Electric Range": "range_mi", "Legislative District": "district", "DOL Vehicle ID": "dol_id", "Vehicle Location": "location",
         "Electric Utility": "utility", "2020 GEOID": "tract"}
ev = pd.read_csv("data/wa-ev-population-2026-10-15.zip", dtype={"Postal Code": str, "2020 GEOID": str}).rename(columns=NAMES)
ev["kind"] = ev.ev_type.str.extract(r"\((BEV|PHEV)\)")[0]
hist = pd.read_csv("data/wa-ev-population-history-2026-10-15.zip")
hist["date"] = pd.to_datetime(hist.Date, format="%B %d %Y")
if not Path("data/cb_2023_us_county_20m.zip").exists():
    Path("data/cb_2023_us_county_20m.zip").write_bytes(requests.get("https://www2.census.gov/geo/tiger/GENZ2023/shp/cb_2023_us_county_20m.zip", timeout=300).content)
wa = gpd.read_file("data/cb_2023_us_county_20m.zip").query("STATEFP == '53'").to_crs(5070)
print(f"{len(ev):,} electric vehicles registered with Washington DOL; history: {hist.date.min():%b %Y} to {hist.date.max():%b %Y}")
300,142 electric vehicles registered with Washington DOL; history: Jan 2017 to Sep 2026
Example 1: east and west of the Cascades
west = ["Clallam", "Clark", "Cowlitz", "Grays Harbor", "Island", "Jefferson", "King", "Kitsap", "Lewis", "Mason", "Pacific", "Pierce",
        "San Juan", "Skagit", "Skamania", "Snohomish", "Thurston", "Wahkiakum", "Whatcom"]
g = last.assign(side=np.where(last.County.isin(west), "west", "east")).groupby("side")[["Electric Vehicle (EV) Total", "Total Vehicles"]].sum()
print(g.assign(share=lambda d: (d["Electric Vehicle (EV) Total"] / d["Total Vehicles"]).round(4)).to_string())
Electric Vehicle (EV) Total Total Vehicles share
side
east 24192 1034667 0.0234
west 259234 3761354 0.0689
West of the Cascades, 6.89% of passenger vehicles are electric; east of them, 2.34%. The east has longer distances, colder winters, fewer chargers and lower incomes, and also some of the cheapest electricity in the country from the Columbia River dams. That has not been enough to close the gap.
Example 2: how the ranking moved since 2020
then = hist[(hist.date == "2020-09-30") & (hist.State == "WA") & (hist["Vehicle Primary Use"] == "Passenger")].set_index("County")
gain = (r.share * 100 - then["Percent Electric Vehicles"]).dropna().sort_values(ascending=False)
print("largest rise in share since September 2020 (points):", gain.head(4).round(2).to_dict())
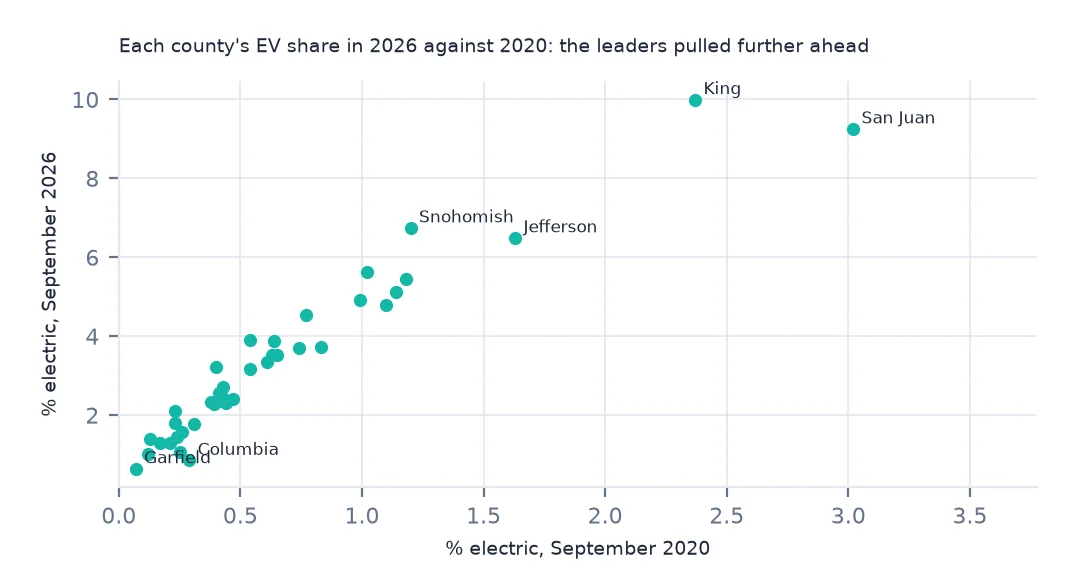
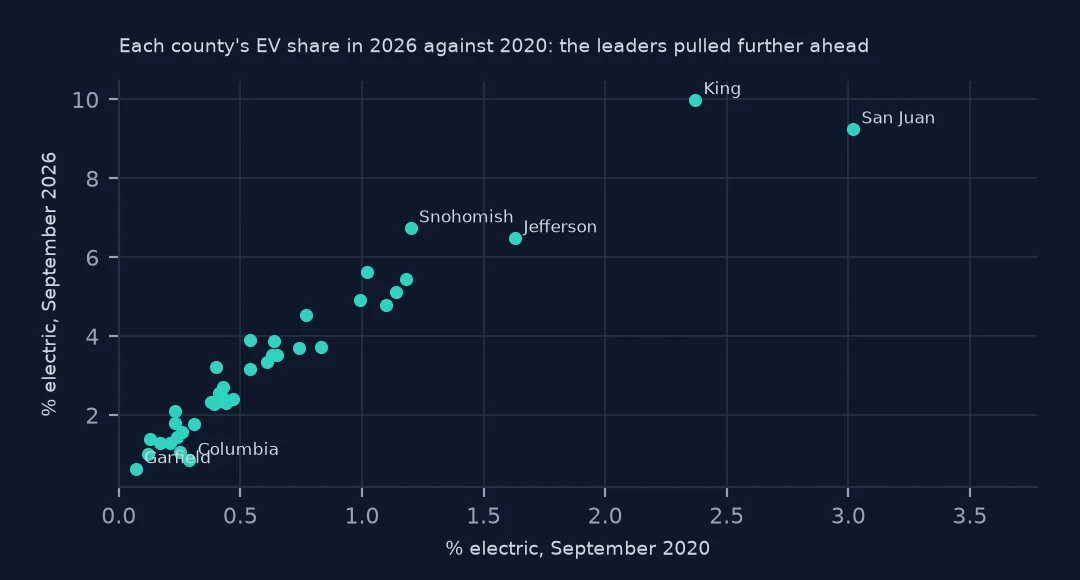
largest rise in share since September 2020 (points): {'King': 7.62, 'San Juan': 6.23, 'Snohomish': 5.54, 'Jefferson': 4.86}
Since September 2020, King's share rose 7.62 points, San Juan's 6.23 and Snohomish's 5.54. The counties that led in 2020 gained the most, so the gap between leaders and laggards has widened rather than narrowed.
What the share measures
The share is the electric fraction of the registered stock: every car with a current Washington registration, whether bought this year or in 2005. Because cars last fifteen years or more, the stock share moves slowly even when EVs are a large fraction of new sales. A county where a fifth of new cars are electric may still show 5% of its fleet. The share is the right measure for questions about the fleet, such as charging demand, fuel tax revenue and emissions, and a lagging indicator of buying behaviour.
Map details
- The history file includes other states' counties for vehicles registered in Washington with an out-of-state address; filter on
State == "WA". - Join on name carefully if you use another boundary file: the history spells counties without "County".
- Classes. Shares run from under 1% to 10%; quantile or Fisher–Jenks classes show the east–west split, and an equal-interval scale makes the map almost all one colour.
- Island counties (San Juan) are small; inset or label them so a high share is visible.
Internal links
- How to analyse Washington's EV registrations — the vehicle-level file
- How to chart EV growth — the same counts over time
- EV share of the fleet explained — stock against additions
- How to map EVs by census tract — finer than counties
FAQ
Which Washington county has the highest share of electric vehicles?
King County, where 9.99% of registered passenger vehicles were electric in September 2026, followed by San Juan County at 9.25%.
What share of Washington's cars are electric?
5.91% of registered passenger vehicles in September 2026: 283,426 of 4,796,021.