
EV Points Pile Up on One Spot: Vehicle Location Is a ZIP Centroid
On this page
Problem statement
Washington's EV registration file has a Vehicle Location column with a point for every vehicle, and plotting it looks like the obvious map. The result is 299,353 vehicles stacked on 589 dots, up to 7,118 on a single one, and the dots sit at ZIP code centres, not at homes. A heat map or a point-in-polygon join built on them puts vehicles in the wrong neighbourhood most of the time. This page shows what the point is, how badly it disagrees with the census tract the same record names, and what to map instead.
Quick answer
Treat Vehicle Location as the centroid of the owner's ZIP code. Aggregate by 2020 GEOID (census tract) or Postal Code and map the areas, not the points. Never spatially join the points to small areas.
wa_ev = ev[ev.state == "WA"].copy()
xy = wa_ev.location.str.extract(r"POINT \((?P<lon>-?[\d.]+) (?P<lat>-?[\d.]+)\)").astype(float)
wa_ev[["lon", "lat"]] = xy
per_point = wa_ev.groupby(["lon", "lat"]).size()
print(f"{len(wa_ev):,} vehicles at {len(per_point):,} distinct points; median {per_point.median():.0f} vehicles per point, most {per_point.max():,}")
print(f"ZIP codes: {wa_ev.zip.nunique():,}; points per ZIP: {wa_ev.groupby('zip')[['lon', 'lat']].nunique().max().max()}")
299,353 vehicles at 589 distinct points; median 94 vehicles per point, most 7,118
ZIP codes: 590; points per ZIP: 1
299,353 vehicles share 589 distinct points. The median point carries 94 vehicles and the busiest 7,118. Each ZIP code has exactly one point, and the 590 ZIP codes share 589 points.
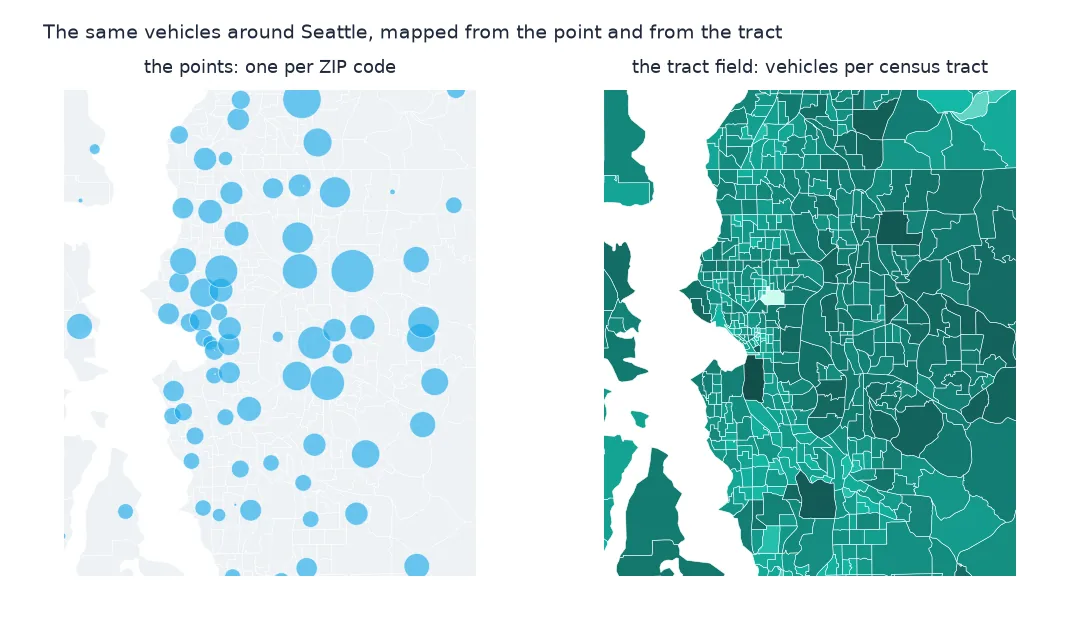
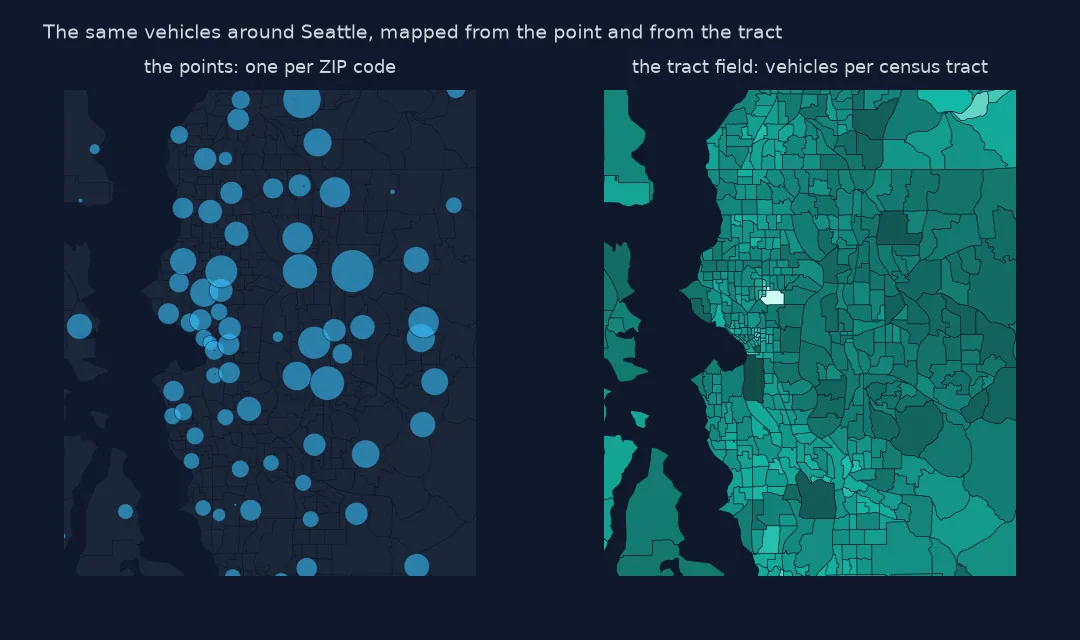
ZIP centroids against census tracts
1. One point per ZIP code
z = wa_ev.groupby("zip").agg(n=("dol_id", "size"), lon=("lon", "first"), lat=("lat", "first"))
print(z.sort_values("n", ascending=False).head(4).to_string())
n lon lat
zip
98052 7118 -122.13158 47.67858
98012 5692 -122.20105 47.84423
98033 4776 -122.20660 47.67887
98006 4602 -122.16937 47.57101
The four busiest points are the ZIP centres of Redmond (98052, 7,118 vehicles), Mill Creek (98012), Kirkland (98033) and Bellevue (98006). On a point map these become four bright spots, which is the shape of the ZIP code system rather than of EV ownership.
2. The point and the tract disagree
pts = gpd.GeoDataFrame(wa_ev.dropna(subset=["lon"]), geometry=gpd.points_from_xy(wa_ev.dropna(subset=["lon"]).lon, wa_ev.dropna(subset=["lon"]).lat), crs=4326).to_crs(5070)
j = gpd.sjoin(pts[["dol_id", "tract", "geometry"]], tracts[["GEOID", "geometry"]], predicate="within", how="left")
print(f"vehicles whose point falls in the tract the record names: {(j.GEOID == j.tract).mean():.1%}")
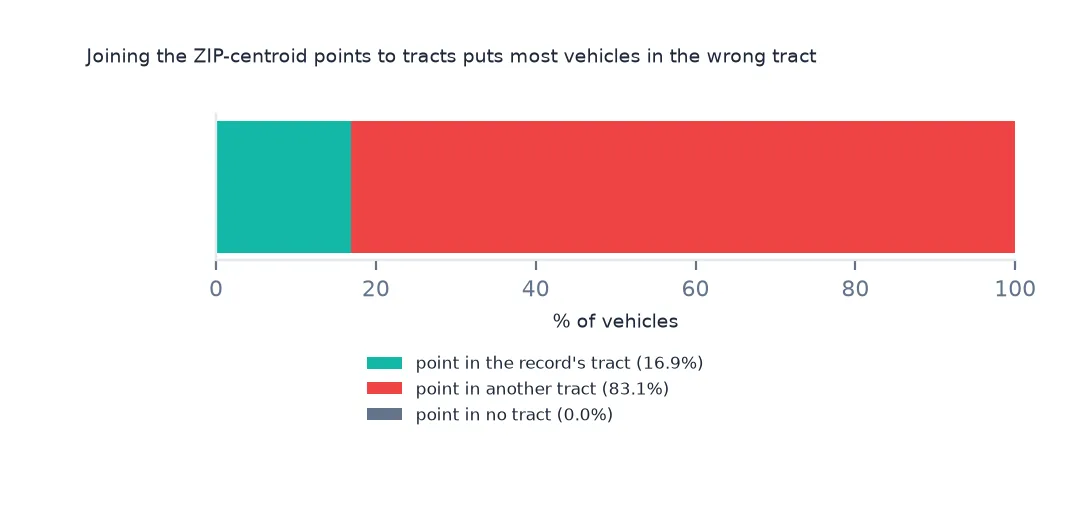
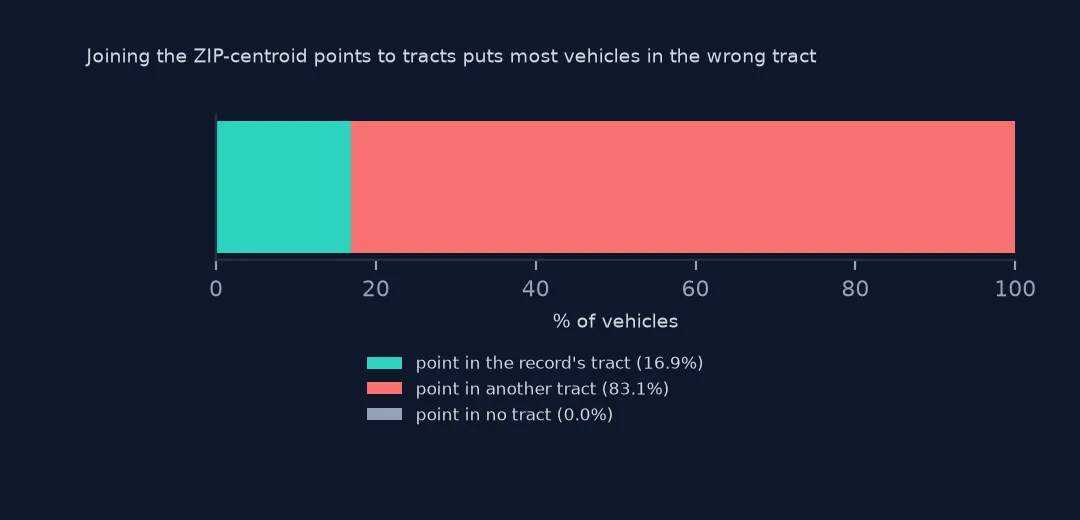
vehicles whose point falls in the tract the record names: 16.9%
Joining the points to tract polygons puts only 16.9% of vehicles in the tract their own record names. The record's tract comes from the owner's address. The point comes from the ZIP centroid, which falls in one tract of the several each ZIP code covers. Any tract-level analysis from the points would be wrong for five vehicles in six.
3. Aggregate to an area the record knows
print(f"distinct tracts named: {wa_ev.tract.nunique():,} against {len(per_point):,} distinct points")distinct tracts named: 1,770 against 589 distinct points
The record names 1,770 different tracts, three times as many places as there are distinct points. The tract column carries finer geography than the point, so it is what to map.
Heat maps and missing points
The data used on this page
The Washington State Department of Licensing's Electric Vehicle Population Data, saved on this site on 15 October 2026, and Census Bureau 2023 cartographic tract boundaries for Washington.
from pathlib import Path

import geopandas as gpd
import numpy as np
import pandas as pd
import requests

Path("data").mkdir(exist_ok=True)
# Washington State Department of Licensing, via data.wa.gov: Electric Vehicle Population Data (f6w7-q2d2), one row per
# registered battery-electric or plug-in hybrid vehicle, and Electric Vehicle Population Size History By County (3d5d-sdqb),
# monthly counts since 2017. Both are replaced monthly, so they are read from copies saved on this site on 15 October 2026.
FILES = ["wa-ev-population-2026-10-15.zip", "wa-ev-population-history-2026-10-15.zip"]
for name in FILES:
    if not Path(f"data/{name}").exists():
        Path(f"data/{name}").write_bytes(requests.get(f"https://data.spatialworkflow.io/{name}", timeout=600).content)
NAMES = {"VIN (1-10)": "vin10", "County": "county", "City": "city", "State": "state", "Postal Code": "zip", "Model Year": "model_year",
         "Make": "make", "Model": "model", "Electric Vehicle Type": "ev_type", "Clean Alternative Fuel Vehicle (CAFV) Eligibility": "cafv",
         "Electric Range": "range_mi", "Legislative District": "district", "DOL Vehicle ID": "dol_id", "Vehicle Location": "location",
         "Electric Utility": "utility", "2020 GEOID": "tract"}
ev = pd.read_csv("data/wa-ev-population-2026-10-15.zip", dtype={"Postal Code": str, "2020 GEOID": str}).rename(columns=NAMES)
ev["kind"] = ev.ev_type.str.extract(r"\((BEV|PHEV)\)")[0]
hist = pd.read_csv("data/wa-ev-population-history-2026-10-15.zip")
hist["date"] = pd.to_datetime(hist.Date, format="%B %d %Y")
if not Path("data/cb_2023_53_tract_500k.zip").exists():
    Path("data/cb_2023_53_tract_500k.zip").write_bytes(requests.get("https://www2.census.gov/geo/tiger/GENZ2023/shp/cb_2023_53_tract_500k.zip", timeout=300).content)
tracts = gpd.read_file("data/cb_2023_53_tract_500k.zip").to_crs(5070)
print(f"{len(ev):,} electric vehicles registered with Washington DOL; history: {hist.date.min():%b %Y} to {hist.date.max():%b %Y}")
300,142 electric vehicles registered with Washington DOL; history: Jan 2017 to Sep 2026
Example 1: what a heat map of the points shows
top = per_point.sort_values(ascending=False).head(10)
print(f"share of all vehicles on the 10 busiest points: {top.sum() / len(wa_ev):.1%}")
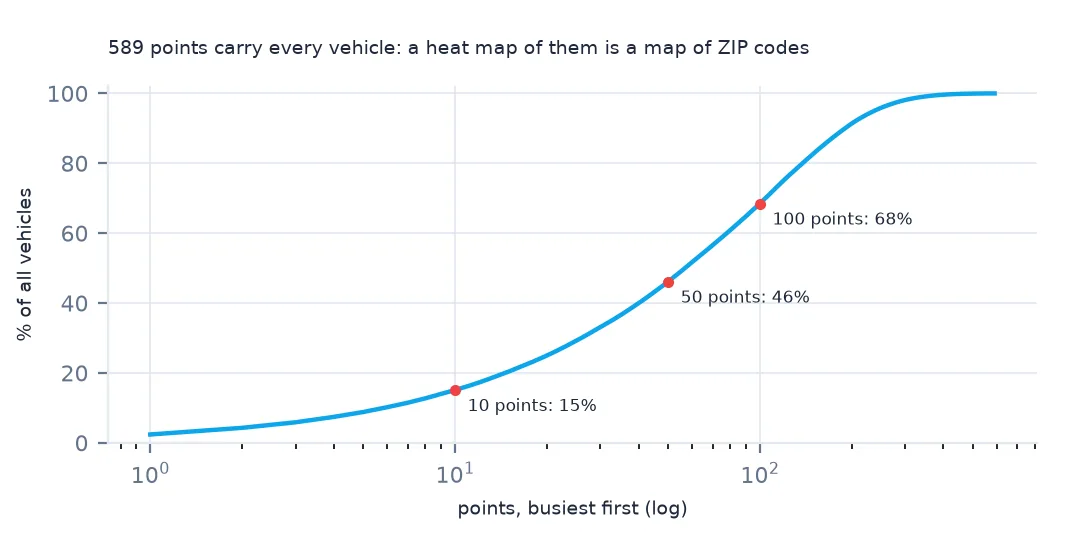
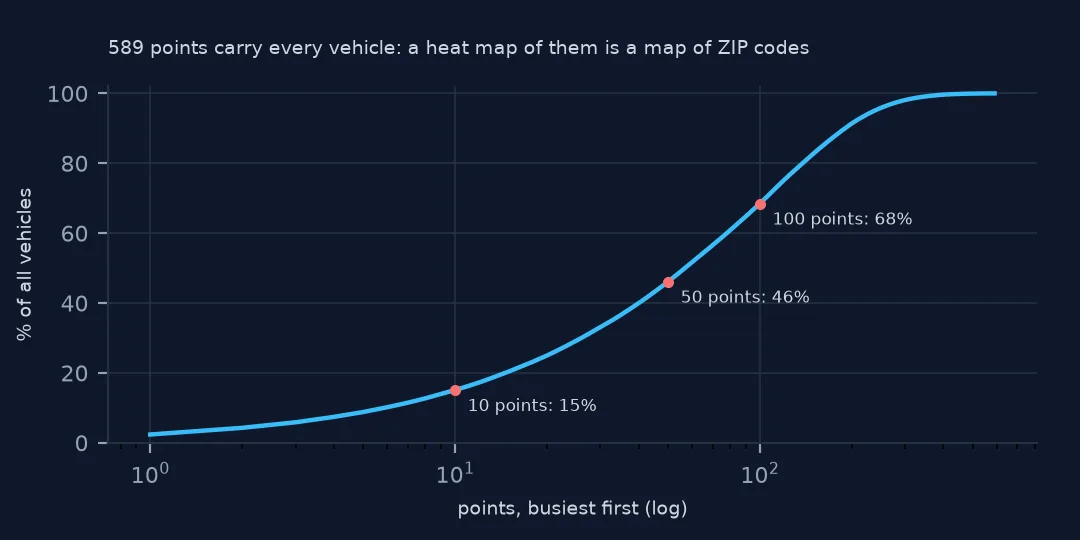
share of all vehicles on the 10 busiest points: 15.1%
The ten busiest points hold 15.1% of all vehicles. A kernel density or heat map of the points would make those ten ZIP centres the brightest places in the state, whatever their actual density.
Example 2: missing locations
print(f"no location: {wa_ev.lon.isna().sum()}; their ZIP codes: {wa_ev[wa_ev.lon.isna()].zip.unique().tolist()[:6]}")no location: 9; their ZIP codes: ['98634']
Nine vehicles have no point, all in ZIP code 98634, for which the file gives no centroid. The tract column still places them.
Why the point is a centroid
The Department of Licensing removes owners' addresses before publishing, for privacy. To give users something to map, it attaches the centroid of the ZIP code, a coarse location that reveals nothing about any household. Census tract, county, city and legislative district are derived from the full address before it is removed, so they are accurate. The point is the least precise geography in the file, even though it looks the most precise.
Mapping alternatives
- Tracts (
2020 GEOID) for neighbourhood maps; join to 2020-based tract boundaries. - ZCTAs (Census ZIP Code Tabulation Areas) for ZIP maps; ZIP codes and ZCTAs differ slightly at the edges.
- Proportional symbols at the ZIP centroid are honest if the legend says they are ZIP totals.
- Never jitter the points to make them look spread out; that invents locations.
Internal links
- How to map EVs by census tract — the tract field instead
- How to analyse Washington's EV registrations — the file
- How to map hurricane flood claims — another dataset with deliberately coarse positions
FAQ
What is the Vehicle Location in the Washington EV data?
The centroid of the vehicle owner's ZIP code, as WKT text. 299,353 vehicles share 589 points.
How should I map Washington EV registrations?
By census tract (2020 GEOID) or ZIP code totals. A point joined to tracts lands in the record's own tract only 16.9% of the time.