
Where Are Electric Vehicles Most Concentrated? Census Tract Density in Washington
On this page
Problem statement
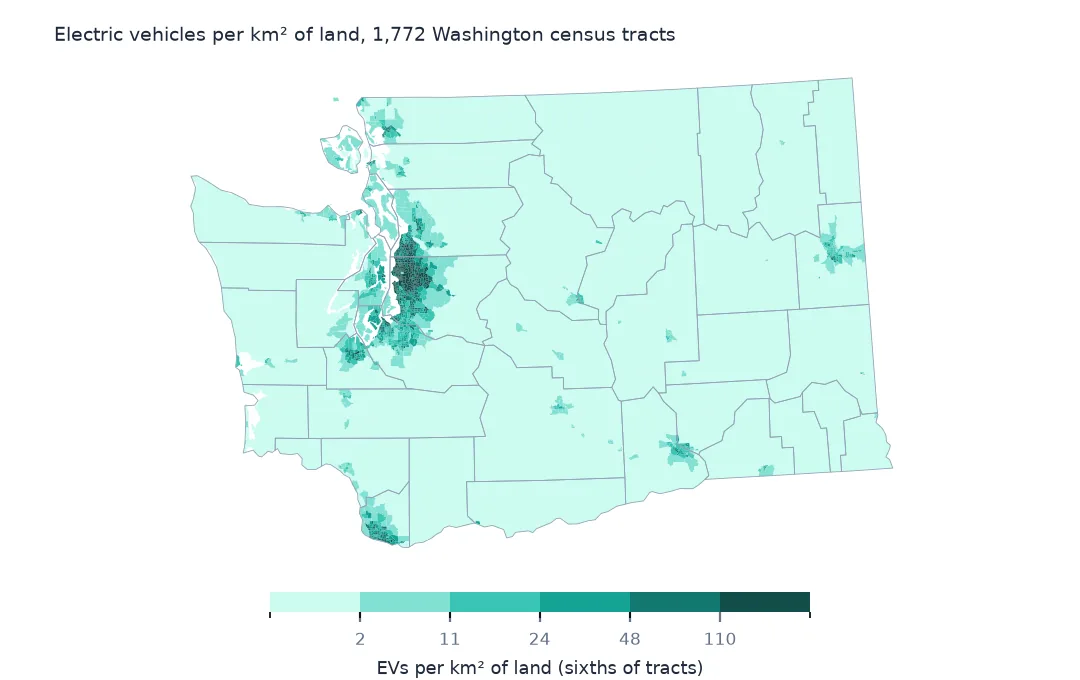
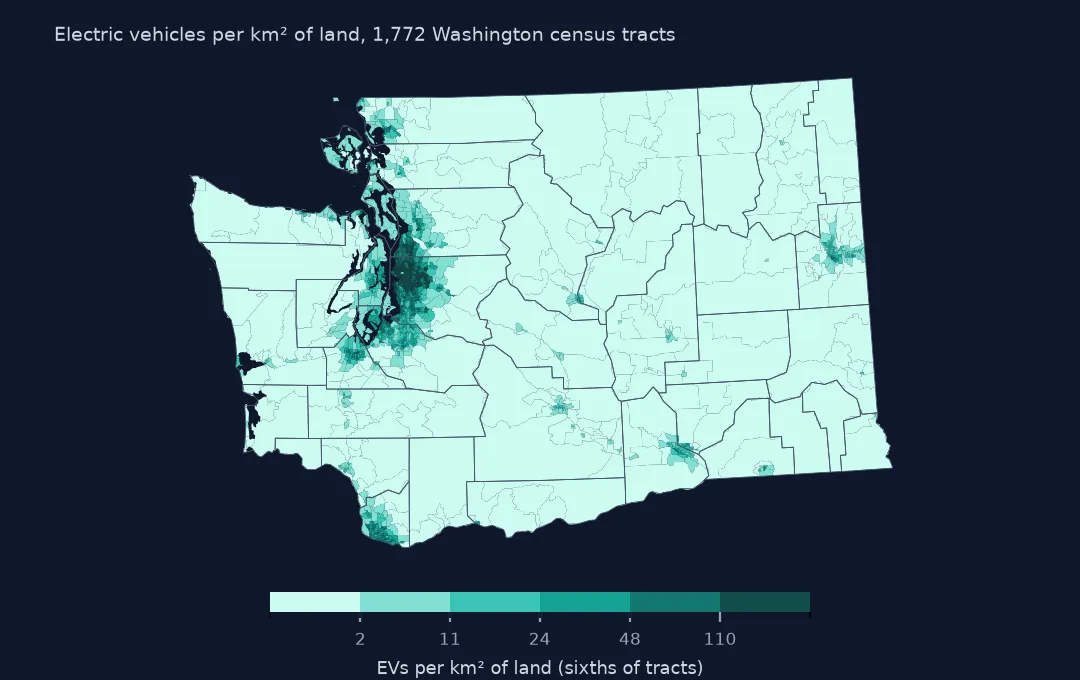
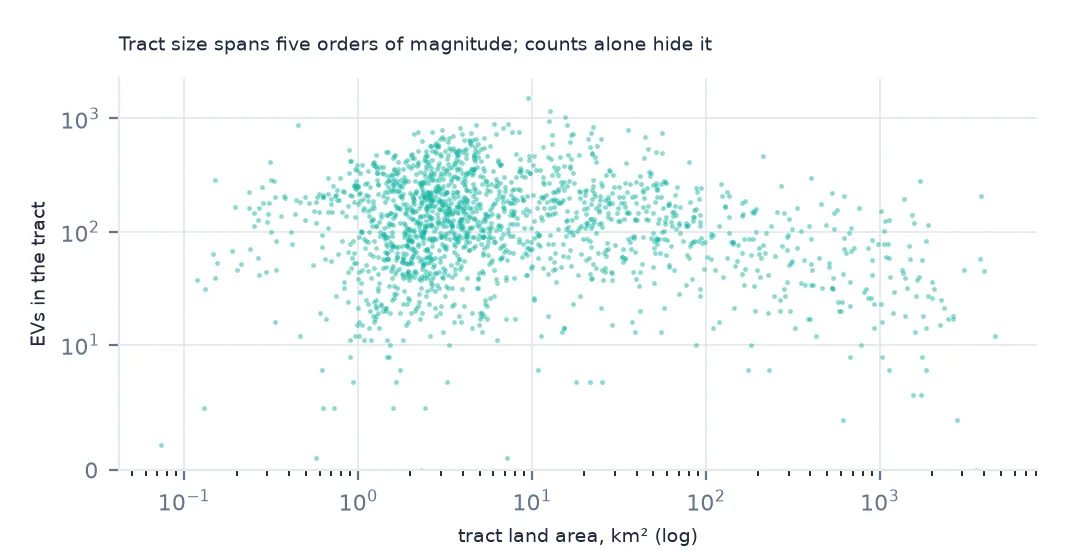
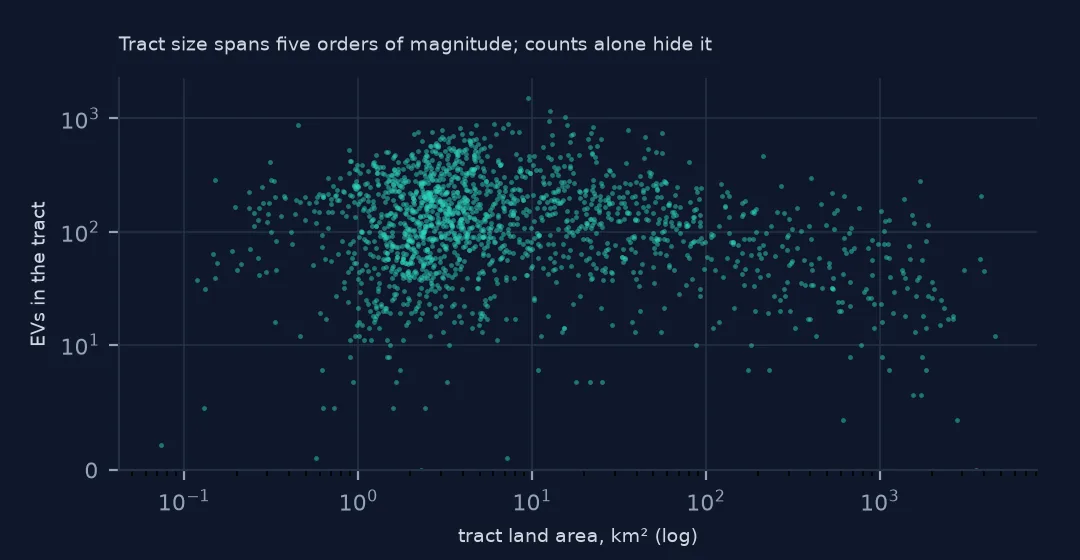
Which neighbourhoods have the most electric vehicles packed into them? County figures cannot say: King County alone ranges from dense Seattle neighbourhoods to forest. Washington's registration file gives every vehicle the 2020 census tract of its owner's address, so EVs can be mapped at tract level, roughly neighbourhoods of a few thousand people. The two traps are area and count: tracts differ in size by thousands of times, and many include lakes and Puget Sound. This page maps EVs per square kilometre of land for Washington's 1,772 tracts and shows how much the choice of measure changes the map.
Quick answer
Count vehicles by 2020 GEOID, join to Census cartographic tract boundaries (2020-based tracts, such as the 2023 file) on GEOID, and divide by ALAND (land area in square metres) rather than the polygon's area. Map with quantile classes, since density is very skewed.
wa_ev = ev[ev.state == "WA"]
per = wa_ev.groupby("tract").size().rename("evs")
t = tracts.merge(per, left_on="GEOID", right_index=True, how="left").fillna({"evs": 0})
t["km2"] = t.ALAND / 1e6
t["per_km2"] = t.evs / t.km2
print(f"{len(tracts):,} tracts; EVs matched to a tract: {wa_ev.tract.isin(tracts.GEOID).mean():.2%}; "
      f"median {t.evs.median():.0f} EVs per tract, {t.per_km2.median():.1f} per km2")
1,772 tracts; EVs matched to a tract: 100.00%; median 122 EVs per tract, 24.4 per km2
Every Washington-registered EV matches one of the 1,772 tracts. The median tract has 122 EVs and 24.4 per km² of land.
Tract keys, land area and count against density
1. The tract field
print(f"tract GEOIDs: {wa_ev.tract.str.len().value_counts().to_dict()} characters; missing {wa_ev.tract.isna().sum()}")
print(f"tracts with no registered EV: {(t.evs == 0).sum()}")
tract GEOIDs: {11: 299353} characters; missing 0
tracts with no registered EV: 2
All tract codes are the full 11 characters (state, county, tract) with none missing, which is why they must be read as strings. Only 2 tracts have no registered EV at all.
2. Land area, not total area
print(f"tracts with water: {(t.AWATER > 0).mean():.1%}; largest water share: {(t.AWATER / (t.ALAND + t.AWATER)).max():.1%}")
print(t.sort_values("per_km2", ascending=False).head(5)[["GEOID", "NAMELSADCO", "evs", "km2", "per_km2"]].round(2).to_string(index=False))
tracts with water: 55.3%; largest water share: 96.4%
GEOID NAMELSADCO evs km2 per_km2
53033008500 King County 871.0 0.45 1931.36
53033007201 King County 287.0 0.15 1903.89
53033007302 King County 411.0 0.31 1313.18
53033023806 King County 222.0 0.23 945.52
53033007303 King County 288.0 0.31 918.58
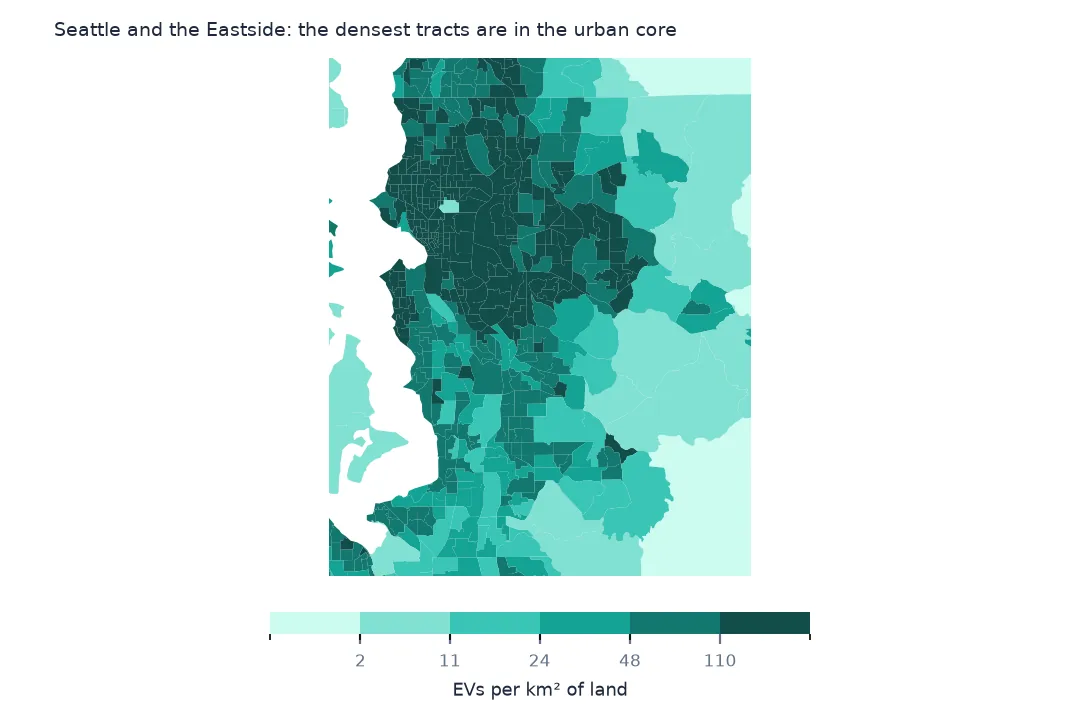
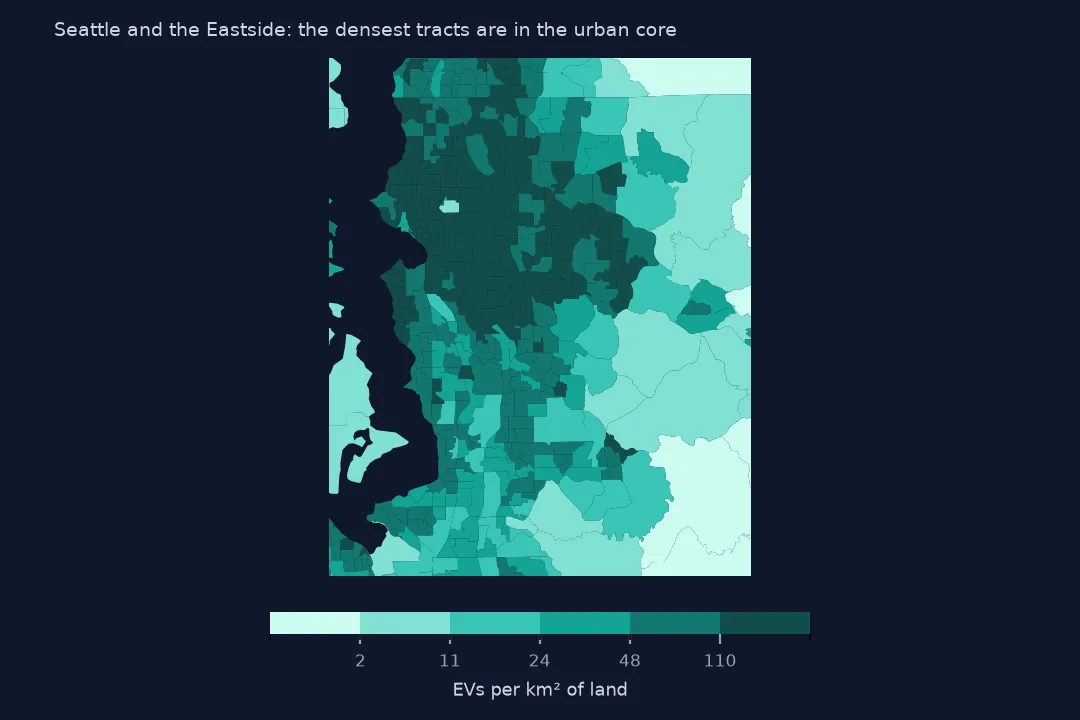
55.3% of tracts include water, and in one it is 96.4% of the area. Dividing by the polygon area would make waterfront tracts look emptier than they are. The densest tracts by land area are all in King County's urban core: one has 871 EVs on 0.45 km², 1,931.36 per km², the density of a dense apartment district.
3. Count is not density
print(t.sort_values("evs", ascending=False).head(5)[["GEOID", "NAMELSADCO", "evs", "km2"]].round(1).to_string(index=False))
print(f"rank correlation of count with density: {t.evs.corr(t.per_km2, method='spearman'):.2f}")
GEOID NAMELSADCO evs km2
53033009300 King County 1503.0 9.5
53033032321 King County 1151.0 12.8
53033026200 King County 1038.0 15.5
53061052107 Snohomish County 946.0 12.5
53033032220 King County 896.0 6.1
rank correlation of count with density: 0.61
The tracts with the most EVs are different ones: larger tracts in King and Snohomish counties, with up to 1,503 EVs spread over 9.5 km². Count and density have a rank correlation of only 0.61. A count map shows where EV owners live in bulk, and a density map shows where they are packed most tightly. Choose the one that matches the question, for example chargers per street or vehicles per utility feeder.
Puget Sound and map classes
The data used on this page
The Washington State Department of Licensing's Electric Vehicle Population Data, saved on this site on 15 October 2026, and Census Bureau 2023 cartographic tract boundaries for Washington.
from pathlib import Path

import geopandas as gpd
import numpy as np
import pandas as pd
import requests

Path("data").mkdir(exist_ok=True)
# Washington State Department of Licensing, via data.wa.gov: Electric Vehicle Population Data (f6w7-q2d2), one row per
# registered battery-electric or plug-in hybrid vehicle, and Electric Vehicle Population Size History By County (3d5d-sdqb),
# monthly counts since 2017. Both are replaced monthly, so they are read from copies saved on this site on 15 October 2026.
FILES = ["wa-ev-population-2026-10-15.zip", "wa-ev-population-history-2026-10-15.zip"]
for name in FILES:
    if not Path(f"data/{name}").exists():
        Path(f"data/{name}").write_bytes(requests.get(f"https://data.spatialworkflow.io/{name}", timeout=600).content)
NAMES = {"VIN (1-10)": "vin10", "County": "county", "City": "city", "State": "state", "Postal Code": "zip", "Model Year": "model_year",
         "Make": "make", "Model": "model", "Electric Vehicle Type": "ev_type", "Clean Alternative Fuel Vehicle (CAFV) Eligibility": "cafv",
         "Electric Range": "range_mi", "Legislative District": "district", "DOL Vehicle ID": "dol_id", "Vehicle Location": "location",
         "Electric Utility": "utility", "2020 GEOID": "tract"}
ev = pd.read_csv("data/wa-ev-population-2026-10-15.zip", dtype={"Postal Code": str, "2020 GEOID": str}).rename(columns=NAMES)
ev["kind"] = ev.ev_type.str.extract(r"\((BEV|PHEV)\)")[0]
hist = pd.read_csv("data/wa-ev-population-history-2026-10-15.zip")
hist["date"] = pd.to_datetime(hist.Date, format="%B %d %Y")
if not Path("data/cb_2023_53_tract_500k.zip").exists():
    Path("data/cb_2023_53_tract_500k.zip").write_bytes(requests.get("https://www2.census.gov/geo/tiger/GENZ2023/shp/cb_2023_53_tract_500k.zip", timeout=300).content)
tracts = gpd.read_file("data/cb_2023_53_tract_500k.zip").to_crs(5070)
print(f"{len(ev):,} electric vehicles registered with Washington DOL; history: {hist.date.min():%b %Y} to {hist.date.max():%b %Y}")
300,142 electric vehicles registered with Washington DOL; history: Jan 2017 to Sep 2026
Example 1: the Seattle area
sea = t[t.NAMELSADCO.isin(["King County", "Snohomish County", "Pierce County", "Kitsap County"])]
print(f"four Puget Sound counties: {sea.evs.sum() / t.evs.sum():.1%} of EVs on {sea.km2.sum() / t.km2.sum():.1%} of the land")
four Puget Sound counties: 72.6% of EVs on 9.4% of the land
The four central Puget Sound counties hold 72.6% of the state's EVs on 9.4% of its land, which is why a statewide tract map needs an inset for the Seattle area.
Example 2: classes for the map
import mapclassify

nz = t.per_km2[t.per_km2 > 0]
q = mapclassify.Quantiles(nz, k=6)
print("quantile breaks, EVs per km2:", [round(float(b), 1) for b in q.bins])
quantile breaks, EVs per km2: [2.0, 10.7, 24.4, 48.3, 110.5, 1931.4]
Quantile breaks of 2.0, 10.7, 24.4, 48.3 and 110.5 EVs per km², up to a maximum of 1,931.4, put a sixth of tracts in each class. An equal-interval scale would put nearly every tract in the lowest class.
Why tracts, and why per land area
Census tracts are drawn to hold a few thousand people each, so they are small where people are dense and huge where they are not. That makes tract counts roughly comparable as per-neighbourhood figures, but their areas are not: a mountain tract can be thousands of times larger than a city tract. Density per land area answers questions about space, such as how many chargers a street might need. EVs per household or per registered vehicle answer questions about adoption and need population or vehicle counts per tract, which the registration file does not provide.
Tract map details
- Use 2020-based tracts. The registration file's
2020 GEOIDwill not match 2010 tract boundaries. - Cartographic (cb) files clip water along coasts but keep
ALANDandAWATERfrom TIGER; useALANDfor the denominator either way. - Tiny tracts amplify noise in density; consider smoothing or a minimum count.
- The tract is the owner's address, so EVs garaged elsewhere are counted at home.
Internal links
- EV points pile up on one spot — why not to map the points
- How to map EV adoption by county — share of all vehicles
- How to analyse Washington's EV registrations — the file
FAQ
How do I map electric vehicles by census tract?
Count EVs by the 2020 GEOID column, join to 2020-based tract boundaries on GEOID, and divide by ALAND for density per square kilometre of land.
Where are electric vehicles most concentrated in Washington?
In King County's urban core, where the densest tract has 1,931.36 registered EVs per km² of land.