
How to Rank Electric Vehicle Makes and Models by Place
On this page
Problem statement
Which electric cars do people in each place drive? A statewide ranking is easy, and in Washington it is mostly Tesla. The interesting answers are local: where Tesla's dominance is weakest, which counties lean to Rivian or Chevrolet, and which places have the most varied mix of brands. This page ranks makes and models across Washington's registered EVs, then compares counties with shares, location quotients and a concentration index, and looks at the newest model years.
Quick answer
Count vehicles by Make and Model with groupby().size(). For places, use a cross-tabulation of county by make normalised by row, and compare each county's share with the statewide share (a location quotient). Restrict to counties with enough vehicles that a share means something.
wa_ev = ev[ev.state == "WA"]
top = wa_ev.groupby(["make", "model"]).size().sort_values(ascending=False)
print(top.head(8).to_string())
print(f"Tesla share of all EVs: {(wa_ev.make == 'TESLA').mean():.1%}")
make model
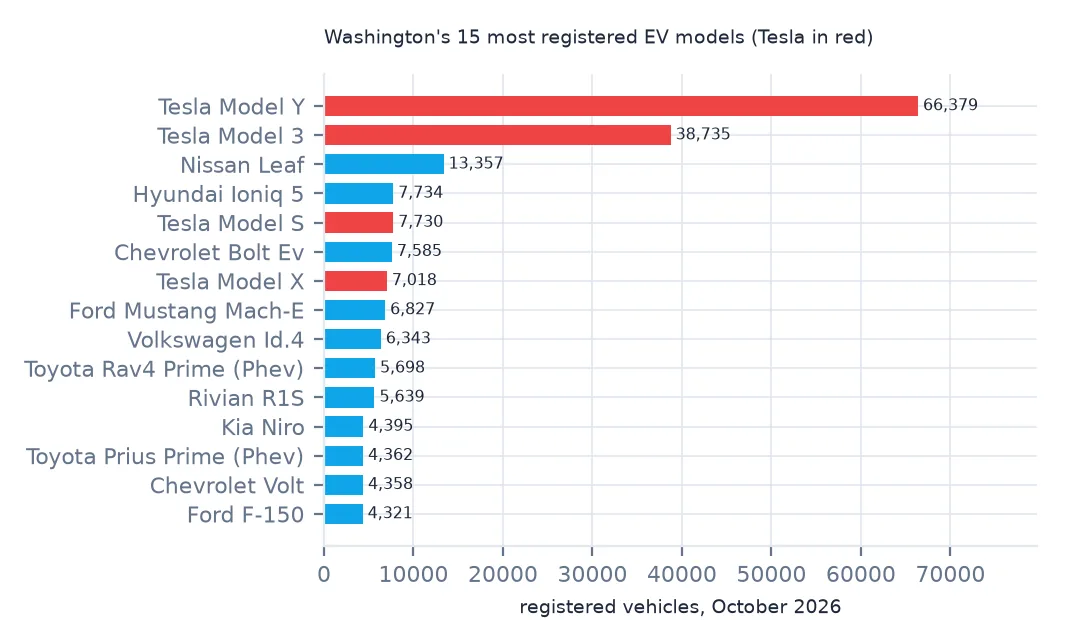
TESLA MODEL Y 66379
MODEL 3 38735
NISSAN LEAF 13357
HYUNDAI IONIQ 5 7734
TESLA MODEL S 7730
CHEVROLET BOLT EV 7585
TESLA MODEL X 7018
FORD MUSTANG MACH-E 6827
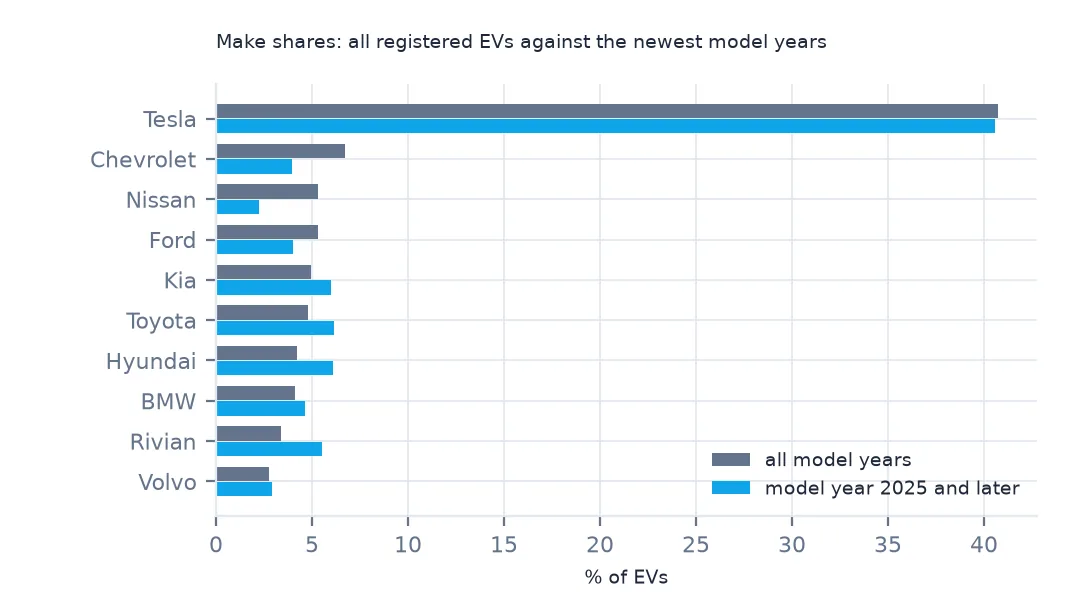
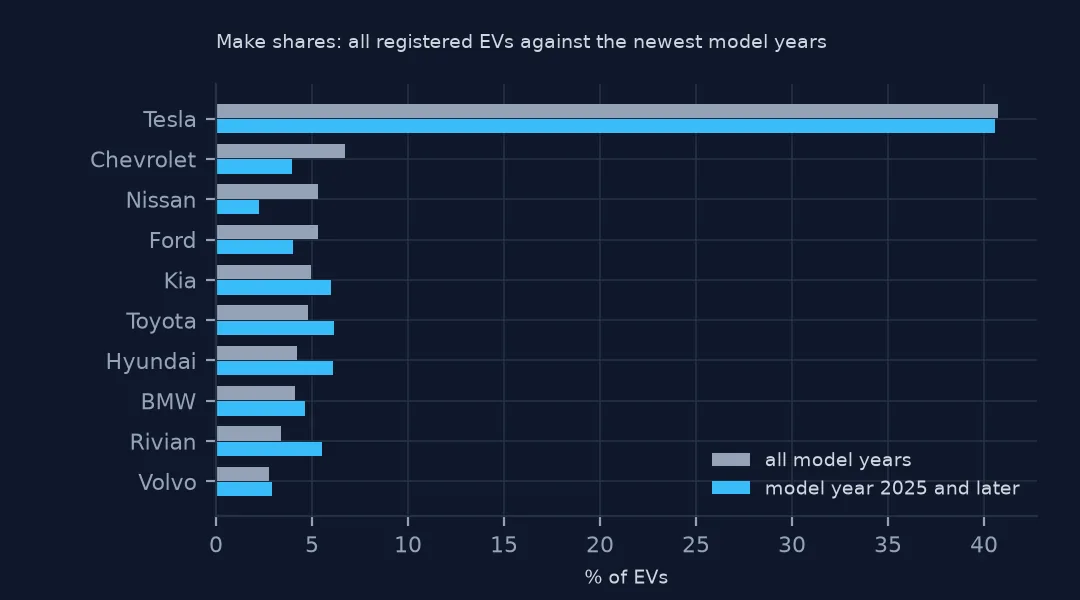
Tesla share of all EVs: 40.7%
The Tesla Model Y is the most registered EV in Washington with 66,379, followed by the Model 3 (38,735) and the Nissan Leaf (13,357). The Hyundai Ioniq 5, Tesla Model S, Chevrolet Bolt EV, Tesla Model X and Ford Mustang Mach-E complete the eight. Tesla makes 40.7% of all EVs.
Shares, leaders and location quotients by county
1. Make share by county
mk = pd.crosstab(wa_ev.county, wa_ev.make, normalize="index")
n = wa_ev.county.value_counts()
tes = mk.TESLA[n[n >= 300].index].sort_values()
print("Tesla share, lowest:", tes.head(3).round(3).to_dict(), "| highest:", tes.tail(3).round(3).to_dict())
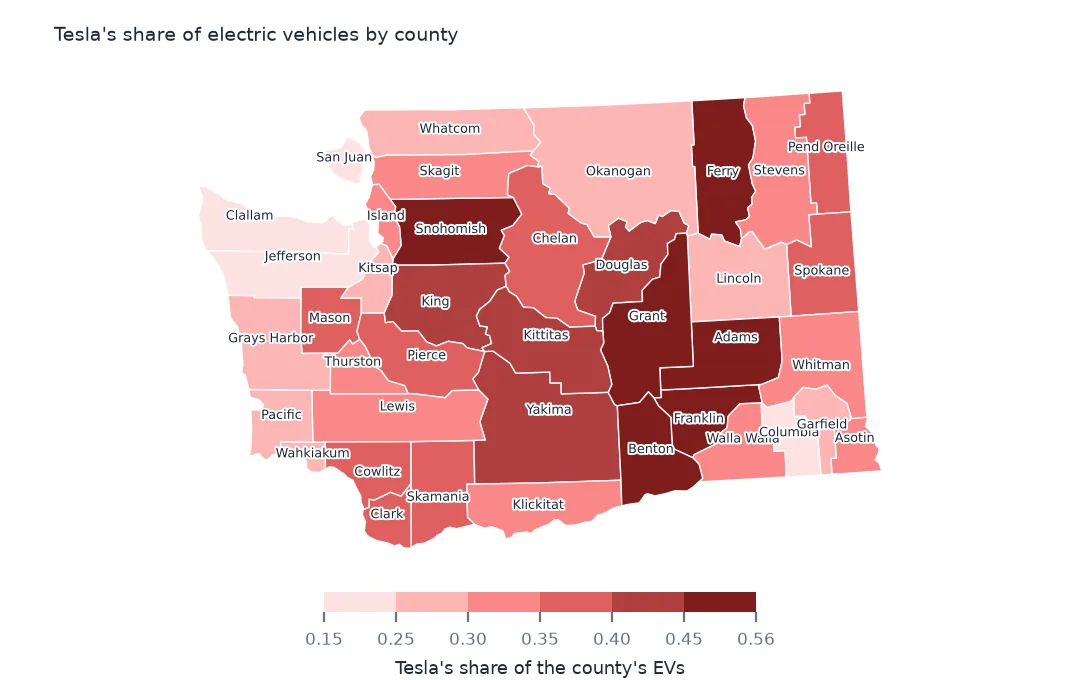
Tesla share, lowest: {'San Juan': 0.192, 'Jefferson': 0.204, 'Clallam': 0.244} | highest: {'Grant': 0.463, 'Snohomish': 0.47, 'Franklin': 0.555}
Among counties with at least a few hundred EVs, Tesla's share ranges from 19.2% in San Juan County and 20.4% in Jefferson to 47.0% in Snohomish and 55.5% in Franklin (the Tri-Cities). The island and Olympic Peninsula counties, with older and more varied fleets, are the least Tesla-dominated.
2. The leading model in each county
lead = wa_ev.groupby(["county", "make", "model"]).size().reset_index(name="n").sort_values(["county", "n"], ascending=[True, False]).drop_duplicates("county")
print(lead.assign(model=lead.make + " " + lead.model).model.value_counts().head(5).to_dict())
print(lead[~lead.model.isin(["MODEL Y", "MODEL 3"])][["county", "make", "model", "n"]].to_string(index=False))
{'TESLA MODEL Y': 32, 'TESLA MODEL 3': 3, 'FORD F-150': 1, 'NISSAN ARIYA HATCHBACK': 1, 'NISSAN LEAF': 1}
county make model n
Columbia FORD F-150 4
Garfield NISSAN ARIYA HATCHBACK 2
San Juan NISSAN LEAF 201
Wahkiakum CHEVROLET BOLT EV 11
The Model Y leads in 32 of 39 counties and the Model 3 in 3. The exceptions say something about each place: a Ford F-150 Lightning pickup in Columbia County (4 vehicles), a Nissan Ariya in Garfield (2), the Leaf in San Juan County (201, early adopters with short island drives) and the Chevrolet Bolt in Wahkiakum.
3. Location quotients
def lq(make):
    local = mk[make]
    return (local / (wa_ev.make == make).mean())[n[n >= 300].index].sort_values(ascending=False)


print("Rivian, most over-represented:", lq("RIVIAN").head(3).round(2).to_dict())
print("Chevrolet, most over-represented:", lq("CHEVROLET").head(3).round(2).to_dict())
Rivian, most over-represented: {'Kittitas': 1.93, 'Skagit': 1.84, 'Chelan': 1.66}
Chevrolet, most over-represented: {'Okanogan': 2.29, 'Jefferson': 2.14, 'Stevens': 2.13}
A location quotient compares a make's local share with its statewide share. Rivian is most over-represented in Kittitas (1.93 times its statewide share), Skagit and Chelan, counties with mountain recreation where an electric adventure truck fits. Chevrolet is over-represented in Okanogan, Jefferson and Stevens, rural counties where the cheaper Bolt sold well.
New model years and brand diversity
The data used on this page
The Washington State Department of Licensing's Electric Vehicle Population Data, saved on this site on 15 October 2026, and Census Bureau 2023 county boundaries.
from pathlib import Path

import geopandas as gpd
import numpy as np
import pandas as pd
import requests

Path("data").mkdir(exist_ok=True)
# Washington State Department of Licensing, via data.wa.gov: Electric Vehicle Population Data (f6w7-q2d2), one row per
# registered battery-electric or plug-in hybrid vehicle, and Electric Vehicle Population Size History By County (3d5d-sdqb),
# monthly counts since 2017. Both are replaced monthly, so they are read from copies saved on this site on 15 October 2026.
FILES = ["wa-ev-population-2026-10-15.zip", "wa-ev-population-history-2026-10-15.zip"]
for name in FILES:
    if not Path(f"data/{name}").exists():
        Path(f"data/{name}").write_bytes(requests.get(f"https://data.spatialworkflow.io/{name}", timeout=600).content)
NAMES = {"VIN (1-10)": "vin10", "County": "county", "City": "city", "State": "state", "Postal Code": "zip", "Model Year": "model_year",
         "Make": "make", "Model": "model", "Electric Vehicle Type": "ev_type", "Clean Alternative Fuel Vehicle (CAFV) Eligibility": "cafv",
         "Electric Range": "range_mi", "Legislative District": "district", "DOL Vehicle ID": "dol_id", "Vehicle Location": "location",
         "Electric Utility": "utility", "2020 GEOID": "tract"}
ev = pd.read_csv("data/wa-ev-population-2026-10-15.zip", dtype={"Postal Code": str, "2020 GEOID": str}).rename(columns=NAMES)
ev["kind"] = ev.ev_type.str.extract(r"\((BEV|PHEV)\)")[0]
hist = pd.read_csv("data/wa-ev-population-history-2026-10-15.zip")
hist["date"] = pd.to_datetime(hist.Date, format="%B %d %Y")
if not Path("data/cb_2023_us_county_20m.zip").exists():
    Path("data/cb_2023_us_county_20m.zip").write_bytes(requests.get("https://www2.census.gov/geo/tiger/GENZ2023/shp/cb_2023_us_county_20m.zip", timeout=300).content)
wa = gpd.read_file("data/cb_2023_us_county_20m.zip").query("STATEFP == '53'").to_crs(5070)
print(f"{len(ev):,} electric vehicles registered with Washington DOL; history: {hist.date.min():%b %Y} to {hist.date.max():%b %Y}")
300,142 electric vehicles registered with Washington DOL; history: Jan 2017 to Sep 2026
Example 1: newer model years
recent = wa_ev[wa_ev.model_year >= 2025]
print(f"model year 2025 and later: {len(recent):,}; Tesla share {(recent.make == 'TESLA').mean():.1%}")
print(recent.make.value_counts(normalize=True).head(6).round(3).to_dict())
model year 2025 and later: 75,960; Tesla share 40.6%
{'TESLA': 0.406, 'TOYOTA': 0.061, 'HYUNDAI': 0.061, 'KIA': 0.06, 'RIVIAN': 0.055, 'BMW': 0.046}
Among the 75,960 EVs of model year 2025 and later, Tesla's share is still 40.6%, but the rest is spread across more brands: Toyota, Hyundai and Kia at about 6% each, Rivian 5.5% and BMW 4.6%. The market behind Tesla is getting more crowded.
Example 2: brand diversity by county
big = n[n >= 300].index
hhi = (mk.loc[big] ** 2).sum(axis=1).sort_values()
print("most diverse (lowest concentration):", hhi.head(3).round(3).to_dict(), "| least:", hhi.tail(3).round(3).to_dict())
most diverse (lowest concentration): {'San Juan': 0.096, 'Jefferson': 0.102, 'Clallam': 0.112} | least: {'Snohomish': 0.24, 'Grant': 0.24, 'Franklin': 0.325}
A Herfindahl index (the sum of squared make shares) measures concentration. San Juan (0.096), Jefferson and Clallam have the most varied fleets, and Snohomish, Grant (both 0.24) and Franklin (0.325) the most concentrated. High concentration here almost always means Tesla.
What a registration ranking reflects
Registrations count the vehicles on the road today, including cars bought used and cars ten years old. A ranking therefore reflects the history of the market as much as current sales: the Leaf and Volt rank high because they were early and long-lived, and newer models rank lower than their current sales would suggest. Local differences combine income (Tesla and Rivian cost more), driving needs (trucks and plug-in hybrids in rural counties), dealer and service-centre locations, and early-adopter communities.
Ranking pitfalls
- Small counties have shares from a handful of vehicles; set a minimum count before ranking.
- Model names change (
BOLT EVagainstBOLT EUV, trims in some years); decide which to merge. - Count
DOL Vehicle ID, never distinct VIN prefixes. - PHEVs add brands that sell few BEVs; say whether a ranking includes them.
Internal links
- Battery electric against plug-in hybrid — the two kinds
- How to map EV adoption by county — share of all vehicles
- Counting EVs by VIN goes wrong — count vehicles, not VIN prefixes
FAQ
What is the most popular electric car in Washington State?
The Tesla Model Y, with 66,379 registered in October 2026, ahead of the Model 3 (38,735) and the Nissan Leaf.
What share of Washington's EVs are Teslas?
40.7% of registered EVs, and 40.6% of model year 2025 and later.