
Bike-Share Trips That Last 25 Hours: Lost Bikes and Capped Durations
On this page
Problem statement
Sort a year of bike-share trips by duration and the top of the list is a wall: thousands of trips of almost exactly 1,500 minutes. Nobody rode for 25 hours. These are rentals the system closed because the bike was never docked again — lost, stolen, abandoned, or docked so badly that the dock never registered it. They have no end station and usually no end position, and every one of them adds a day to any average it enters.
This page finds the rental caps in Capital Bikeshare's 2025 trips for Washington, D.C., looks at who takes the bikes that do not come back, from where and when, and shows what the capped rentals do to station statistics if they are left in.
Quick answer
A capped rental is one whose duration sits on the system's limit — 1,500 minutes for a classic bike, 480 for an e-bike. Flag those, and look at whether they have an end position:
cap = {"classic_bike": 1500, "electric_bike": 480}
at_cap = (t.minutes - t.rideable_type.map(cap)).abs() <= 1
how = at_cap.map({True: "closed at the cap", False: "within the cap"}).rename("rental")
where = t.end_lat.isna().map({True: "no end position", False: "end position"}).rename("end")
print(pd.crosstab(t.rideable_type, [how, where]).to_string())
rental closed at the cap within the cap
end end position no end position end position no end position
rideable_type
classic_bike 129 4410 2408098 85
electric_bike 56 0 4249798 0
4,539 classic-bike rentals were closed at 25 hours, and 4,410 of those have no end position: the bike was never seen again by the system that day. 129 were closed at the cap but do have an end, the bike having turned up at a dock later. 85 classic-bike trips within the cap also lack an end position, which is a different kind of gap. E-bikes are different again: 56 were closed at eight hours, every one of them with an end position, because an e-bike reports its own location.
Caps, riders, stations and seasons
1. Find the caps in the duration tail
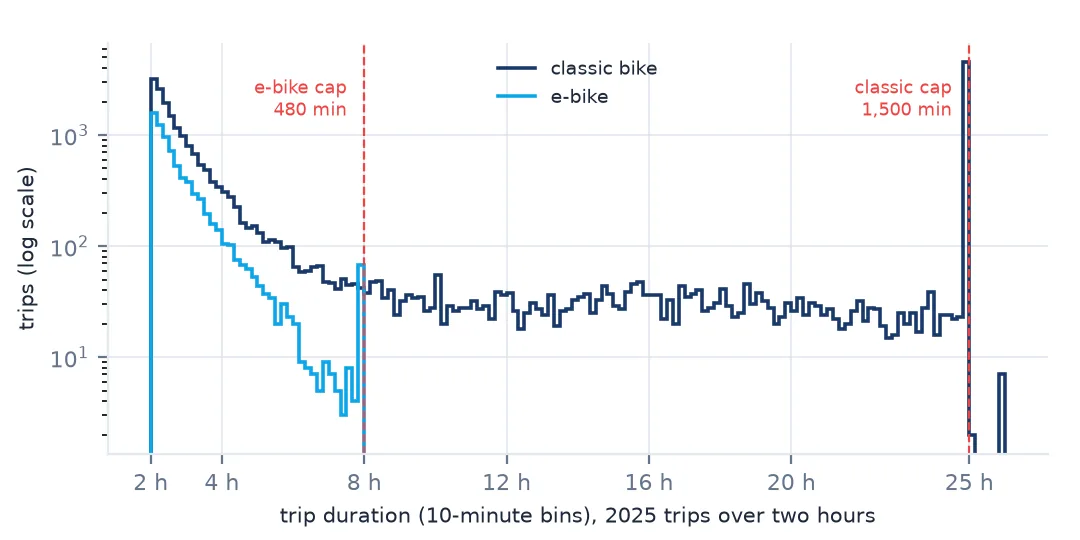
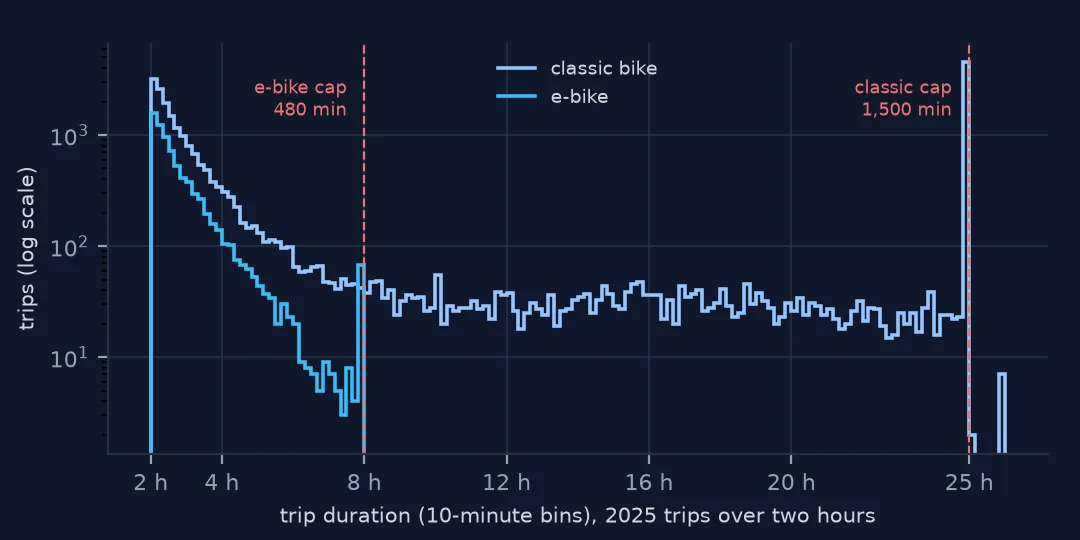
The caps are not documented on the system data page, but they are easy to find: count the long trips in ten-minute bins and look for the spike.
for kind, d in t.groupby("rideable_type"):
    tail = d.minutes[d.minutes > 300].round(-1).value_counts().sort_index()
    print(kind, "trips over 5 h, by 10-min bin, largest bins:", tail.nlargest(3).to_dict(), " max", round(d.minutes.max(), 1))
classic_bike trips over 5 h, by 10-min bin, largest bins: {1500.0: 4547, 310.0: 131, 350.0: 112} max 1560.0
electric_bike trips over 5 h, by 10-min bin, largest bins: {480.0: 59, 310.0: 38, 320.0: 34} max 480.0
For classic bikes the 1,500-minute bin holds 4,547 trips, against 131 in the next largest bin over five hours. For e-bikes the spike is at 480 minutes and nothing is longer. A few classic trips run to 1,560 minutes; the daylight-saving page shows that this is the cap plus the hour gained when a rental spans the clock change.
2. Who takes the bikes that do not come back
lost = t[at_cap & (t.rideable_type == "classic_bike")]
print(f"{len(lost):,} classic-bike rentals closed at 25 hours")
print("member share:", f"{(lost.member_casual == 'member').mean():.1%}", "against", f"{(t.member_casual == 'member').mean():.1%} of all trips")
print("start hour, share of these vs all classic trips:")
cl = t[t.rideable_type == "classic_bike"]
print(pd.DataFrame({"closed at cap": lost.started_at.dt.hour.value_counts(normalize=True),
                    "all classic": cl.started_at.dt.hour.value_counts(normalize=True)}).loc[[0, 3, 8, 12, 17, 21]].round(3).to_string())
4,539 classic-bike rentals closed at 25 hours
member share: 26.9% against 71.0% of all trips
start hour, share of these vs all classic trips:
closed at cap all classic
started_at
0 0.024 0.010
3 0.010 0.002
8 0.044 0.070
12 0.063 0.058
17 0.086 0.105
21 0.036 0.035
Casual riders take most of the bikes that do not come back: members account for only 26.9% of capped rentals, against 71.0% of all trips. The hours lean late — 2.4% of these rentals started in the midnight hour against 1.0% of classic trips, and 1.0% at 3 a.m. against 0.2% — while the morning commute is under-represented. A bike taken in the small hours by someone without an account is the typical case.
3. Where they start
rate = (cl.assign(lost=at_cap[cl.index]).groupby("start_station_name")
        .agg(trips=("ride_id", "size"), lost=("lost", "sum")))
rate["per 1,000"] = 1000 * rate.lost / rate.trips
busy = rate[rate.trips >= 2000]
print(f"{len(busy)} stations with 2,000+ classic trips; per 1,000 trips: median {busy['per 1,000'].median():.2f}")
print(busy.nlargest(5, "per 1,000").round(1).to_string())
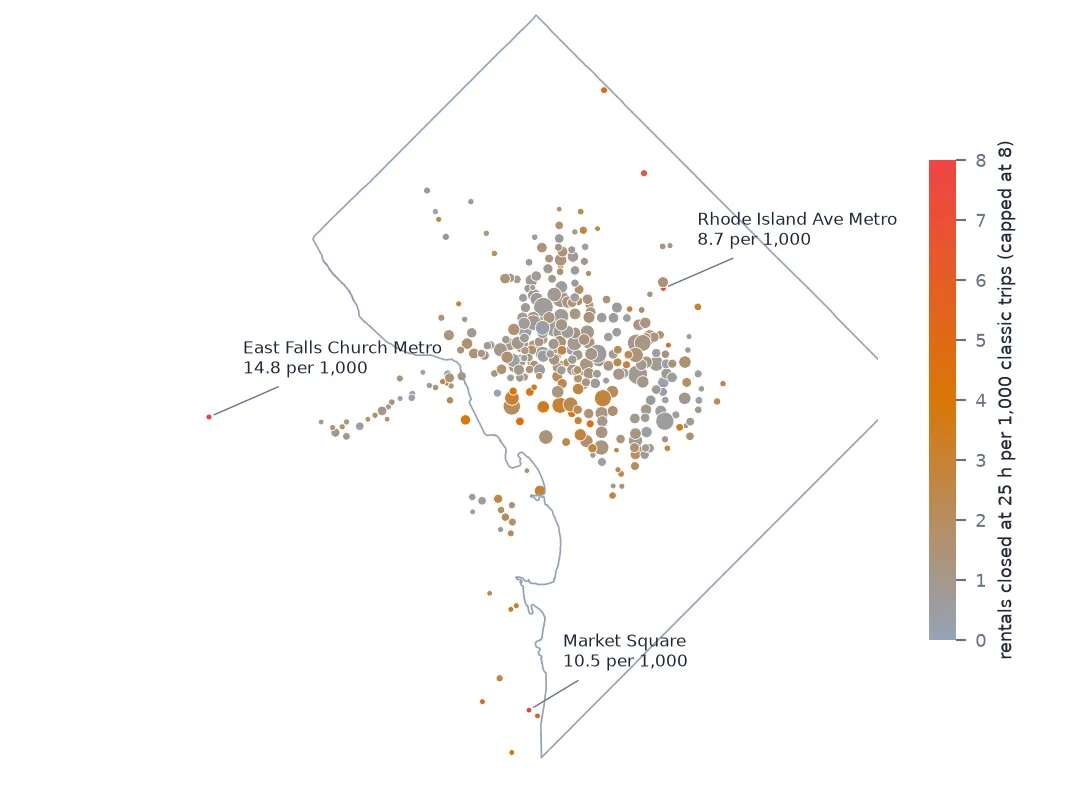
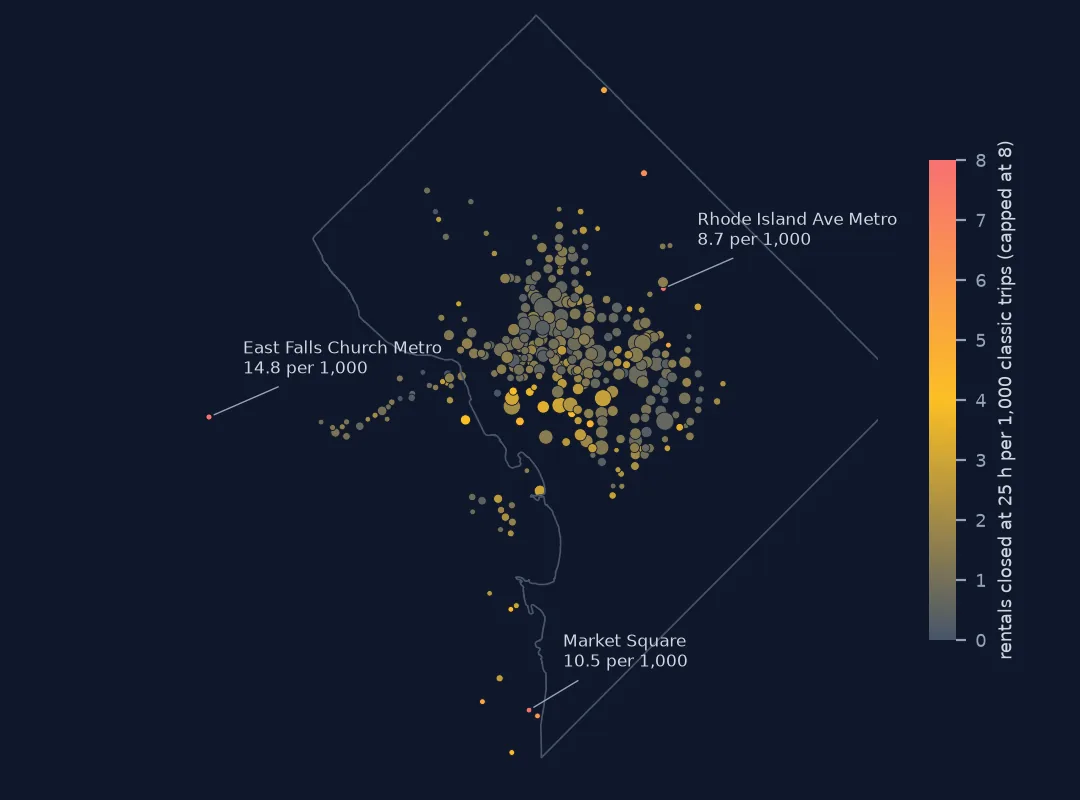
325 stations with 2,000+ classic trips; per 1,000 trips: median 1.21
trips lost per 1,000
start_station_name
East Falls Church Metro / Sycamore St & 19th St N 2302 34 14.8
Market Square / King St & Royal St 2091 22 10.5
Rhode Island Ave Metro 2172 19 8.7
Fort Totten Metro 3128 21 6.7
Prince St & Union St 2165 13 6.0
The median busy station loses 1.21 rentals per 1,000 classic trips to the cap. Five stand out, at five to twelve times that rate. Three of them are Metro stations — East Falls Church, Rhode Island Avenue and Fort Totten — and two are on the Old Town Alexandria waterfront. The file cannot say why; a bike left at a Metro station by someone who took the train onward, or ridden out of the service area, would both look like this.
4. When in the year
by_month = pd.DataFrame({"closed at cap": lost.groupby(lost.started_at.dt.month).size(),
                         "classic trips": cl.groupby(cl.started_at.dt.month).size()})
by_month["per 1,000"] = (1000 * by_month["closed at cap"] / by_month["classic trips"]).round(2)
print(by_month.T.to_string())
started_at 1 2 3 4 5 6 7 8 9 10 11 12
closed at cap 185.00 138.00 324.00 435.00 579.00 632.00 700.00 479.00 382.0 342.00 197.00 146.00
classic trips 78950.00 112441.00 235004.00 265335.00 268054.00 274015.00 266437.00 248793.00 224059.0 214619.00 144672.00 80343.00
per 1,000 2.34 1.23 1.38 1.64 2.16 2.31 2.63 1.93 1.7 1.59 1.36 1.82
In absolute numbers the capped rentals follow riding — 700 in July, 138 in February — but per 1,000 trips they also rise in summer, to 2.63 in July from 1.23 in February. January's 2.34 is a winter exception on small numbers.
5. E-bikes stop at eight hours, with a position
ecap = t[at_cap & (t.rideable_type == "electric_bike")]
print(f"{len(ecap):,} e-bike rentals closed at 480 min; with an end position: {ecap.end_lat.notna().mean():.0%}; "
      f"ending at a station: {ecap.end_station_id.notna().mean():.0%}")
print(f"start and end in the same 0.01° cell: {((ecap.start_lat.round(2) == ecap.end_lat.round(2)) & (ecap.start_lng.round(2) == ecap.end_lng.round(2))).mean():.0%}")
56 e-bike rentals closed at 480 min; with an end position: 100%; ending at a station: 0%
start and end in the same 0.01° cell: 23%
None of the 56 e-bikes closed at eight hours was at a station when the rental closed, and only 23% were in the same 0.01° cell they started in. They were ridden somewhere and left, which is what the shorter cap is for: a dockless bike cannot wait 25 hours for a dock to notice it.
Keep them out of averages, not out of the data
The data used on this page
Capital Bikeshare system data, the twelve monthly trip files for 2025. Only the 36 trips that started in 2024 and the 35 with negative durations (see the daylight-saving night) are removed; everything else is kept, because the long tail is the subject.
from pathlib import Path
import zipfile

import numpy as np
import pandas as pd
import requests

Path("data").mkdir(exist_ok=True)
MONTHS = [f"2025{m:02d}" for m in range(1, 13)]
for m in MONTHS:
    f = Path(f"data/{m}-capitalbikeshare-tripdata.zip")
    if not f.exists():
        f.write_bytes(requests.get(f"https://s3.amazonaws.com/capitalbikeshare-data/{f.name}", timeout=600).content)


def read_month(m):
    with zipfile.ZipFile(f"data/{m}-capitalbikeshare-tripdata.zip") as z, z.open(f"{m}-capitalbikeshare-tripdata.csv") as fh:
        return pd.read_csv(fh, dtype={"start_station_id": "Int64", "end_station_id": "Int64"},
                           parse_dates=["started_at", "ended_at"])


t = pd.concat([read_month(m) for m in MONTHS], ignore_index=True)
t["minutes"] = (t.ended_at - t.started_at).dt.total_seconds() / 60
t = t[(t.started_at >= "2025-01-01") & (t.minutes >= 0)].reset_index(drop=True)
print(f"{len(t):,} trips")
6,662,576 trips
Example 1: what capped rentals do to a station's mean
st = cl.dropna(subset=["start_station_name"]).assign(capped=at_cap[cl.index])
g = st.groupby("start_station_name")
means = pd.DataFrame({"trips": g.size(), "mean, all": g.minutes.mean(),
                      "mean, without capped": st[~st.capped].groupby("start_station_name").minutes.mean(),
                      "median": g.minutes.median()})
means = means[means.trips >= 2000]
print(means.nlargest(5, "mean, all").round(1).to_string())
print(f"stations whose rank by mean duration moves 50+ places: "
      f"{(means['mean, all'].rank() - means['mean, without capped'].rank()).abs().ge(50).sum()} of {len(means)}")
trips mean, all mean, without capped median
start_station_name
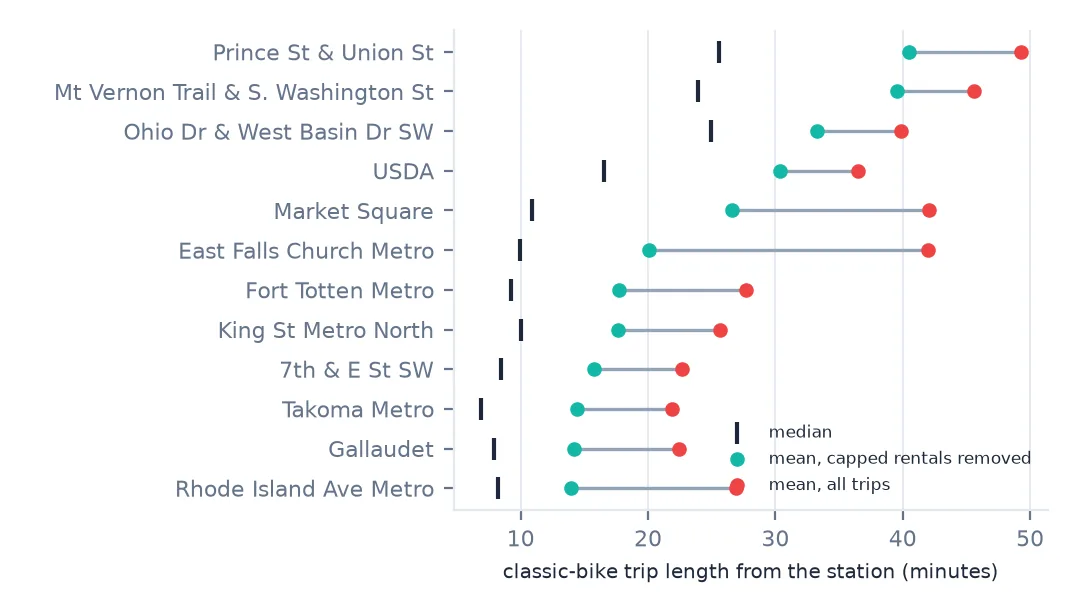
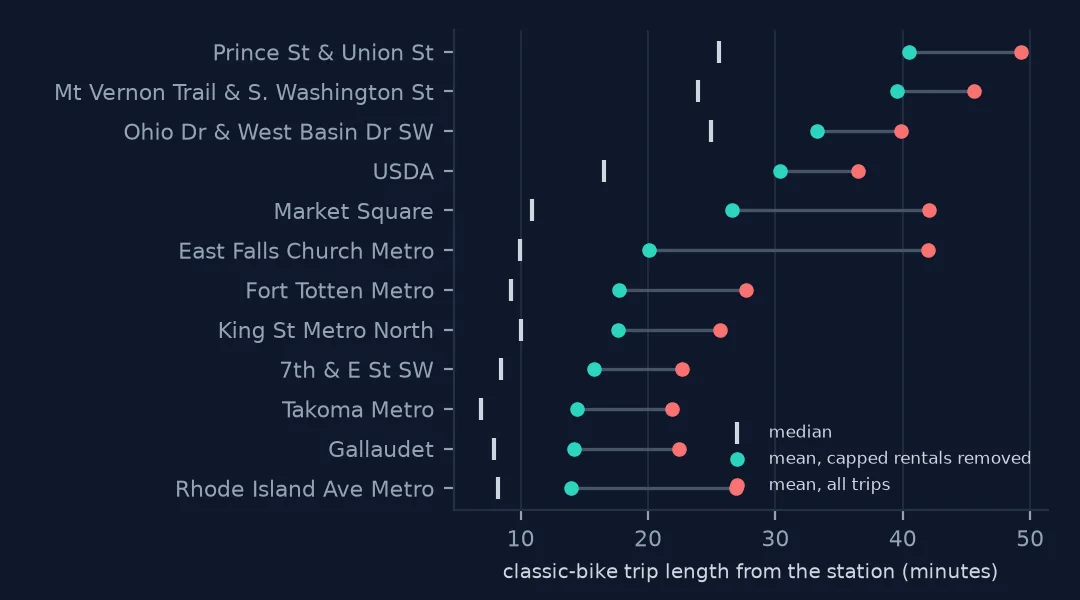
Prince St & Union St 2165 49.3 40.5 25.6
Mt Vernon Trail & S. Washington St. 2170 45.6 39.5 23.9
19th St & Constitution Ave NW 4929 42.2 36.9 23.0
Market Square / King St & Royal St 2091 42.1 26.6 10.9
East Falls Church Metro / Sycamore St & 19th St N 2302 41.9 20.1 10.0
stations whose rank by mean duration moves 50+ places: 24 of 325
Station-level means are where capped rentals do their damage. At Market Square in Old Town Alexandria the mean classic trip is 42.1 minutes with them and 26.6 without, while the median is 10.9; at East Falls Church Metro, 41.9 against 20.1. Across the 325 busy stations, 24 move 50 or more places in a ranking by mean trip length when the capped rentals are removed. A ranking by median is barely affected.
Example 2: separate the capped rentals instead of dropping them
t["ended_as"] = np.select([at_cap & t.end_lat.isna(), at_cap], ["unreturned, closed at cap", "closed at cap"], "returned")
print(t.groupby(["rideable_type", "ended_as"]).minutes.agg(["size", "median"]).round(1).to_string())
size median
rideable_type ended_as
classic_bike closed at cap 129 1499.9
returned 2408183 10.0
unreturned, closed at cap 4410 1499.9
electric_bike closed at cap 56 479.9
returned 4249798 8.9
A labelled column keeps the rows for what they are good for — counting lost bikes by station and season — while every duration statistic is computed on ended_as == "returned". The median returned trip is 10.0 minutes on a classic bike and 8.9 on an e-bike; the capped ones sit at 1,499.9 and 479.9.
A duration that measures the system, not the ride
Every trip duration is the time between two events recorded by the system: an unlock and a lock. When the second event never happens, the system eventually invents one, and the duration becomes a property of the system's rules rather than of anyone's ride. That is why the capped rentals cluster on exact values, why the value differs between bike types, and why it differs between cities using the same file format (five systems compared).
Treating them as outliers to trim — the top 1% of durations, say — would be the wrong tool. A percentile cut-off removes real long rides along with them and moves whenever the share of lost bikes changes. Identifying them by the rule that created them removes exactly them, and leaves a column that can be counted on its own: lost bikes per station is an operational measure an operator cares about, not noise.
Reading the long tail
- Find the cap per bike type with a histogram of the tail; do not assume 24 hours.
- A capped rental can have an end position if the bike was docked after the cap. Use the duration, not the missing position, to find them.
- The daylight-saving night adds or removes an hour from rentals that span it.
- Use medians for station comparisons, or remove capped rentals before taking means.
- A trip without an end position is not always capped. 85 classic-bike trips here ended within the cap with no position.
Internal links
- How to clean a year of bike-share trip data — the other cleaning rules
- Bike-share trip data explained — the caps in four other cities
- Bike-share trips with negative durations — the other way durations go wrong
FAQ
Why do some bike-share trips last exactly 25 hours?
Because the system closes a classic-bike rental that has not been returned after 1,500 minutes. In Capital Bikeshare's 2025 data, 4,539 rentals were closed this way, 4,410 of them with no end position.
How long can a Capital Bikeshare e-bike rental last?
No 2025 e-bike trip ran past 480 minutes; 56 were closed at that limit, all with an end position and none at a station.