
How to Separate Commuting from Leisure in Bike-Share Trips
On this page
Problem statement
A bike-share system serves two kinds of rider with the same bikes: people going to work, who ride short, fast and at the same hours every weekday, and people out for the afternoon, who ride longer and whenever the weather is good. Planners want to know which is which — rebalancing, station siting and pricing all depend on it — but a trip file does not say why anyone rode. What it does record is when, where and whether the rider was a member.
This page uses the 6.5 million clean 2025 trips of Capital Bikeshare in Washington, D.C. to separate the two: by hour and day, by membership, by station, and against the calendar — federal holidays, and the six weeks in autumn 2025 when much of the federal workforce was told to stay home.
Quick answer
Label each trip's day as a working day or a weekend or holiday, then compare the share of trips that start in the six commuting hours (7–10 a.m. and 4–7 p.m.):
trips["hour"] = trips.started_at.dt.hour
trips["daytype"] = np.where(trips.started_at.dt.normalize().isin(HOLIDAYS) | (trips.started_at.dt.dayofweek >= 5),
                            "weekend or holiday", "working day")
profile = pd.crosstab([trips.daytype, trips.member_casual], trips.hour, normalize="index")
peaks = profile[[7, 8, 9, 16, 17, 18]].sum(axis=1)
print((100 * peaks).round(1).to_string())
daytype member_casual
weekend or holiday casual 29.7
member 31.4
working day casual 41.6
member 47.7
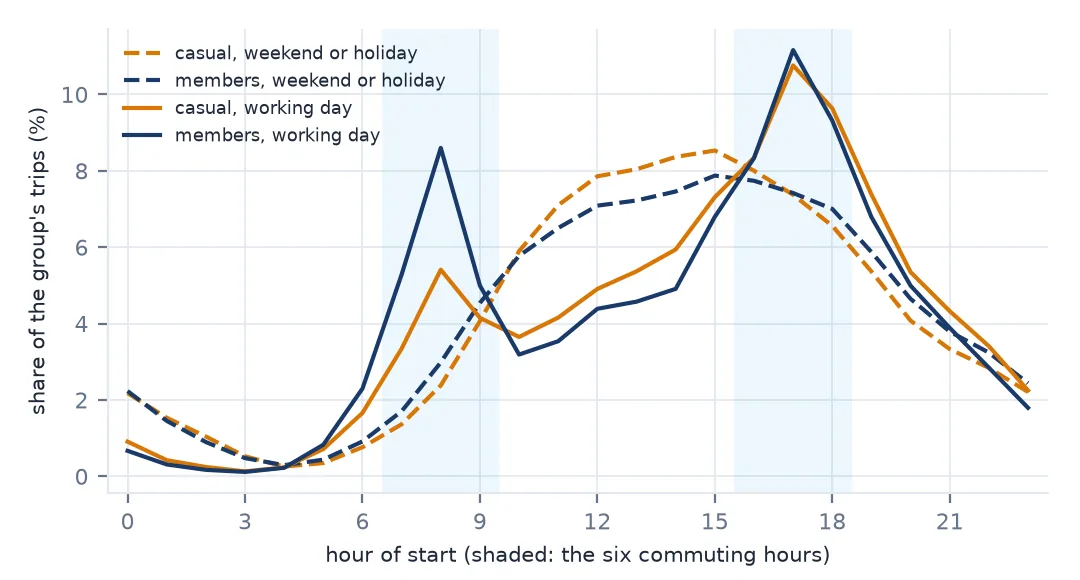
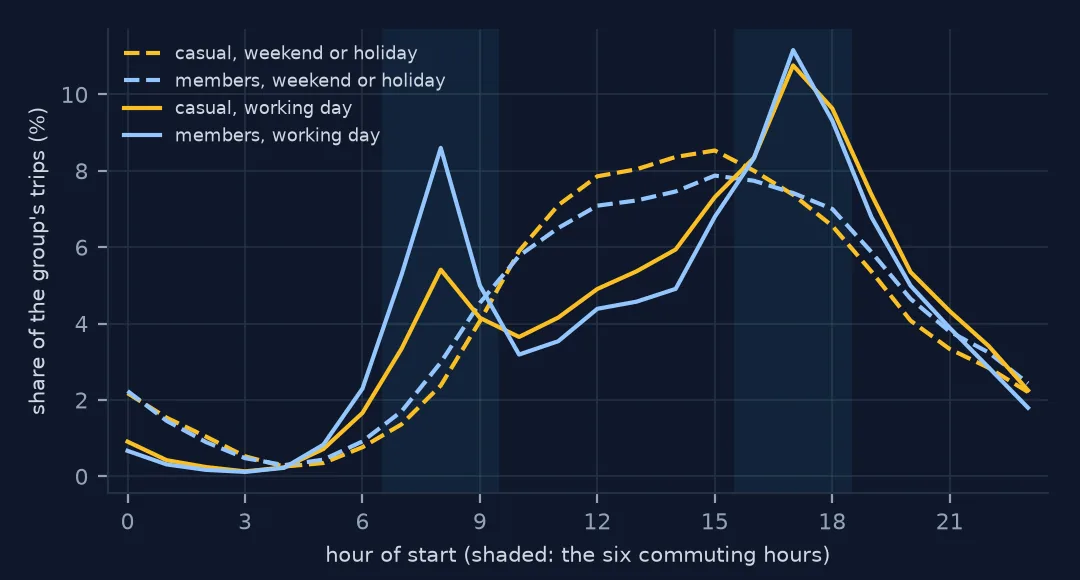
Six hours of the day carry 47.7% of members' working-day trips and 41.6% of casual riders' working-day trips — against about 30% for both on weekends, which is what six hours would hold if riding were spread evenly from mid-morning to evening. Membership alone does not separate commuting from leisure here: casual riders commute too.
Hours, days and stations
1. Mark holidays as well as weekends
Federal holidays close the offices that much of D.C.'s commuting serves, so a holiday Monday is not a working day. pandas has the federal calendar built in:
days = trips.groupby(trips.started_at.dt.normalize()).size()
kind = pd.Series(np.where(days.index.dayofweek >= 5, "weekend", "weekday"), index=days.index)
kind[kind.index.isin(HOLIDAYS)] = "holiday"
print(days.groupby(kind).agg(["count", "median"]).astype(int).to_string())
print(", ".join(f"{d:%d %b}" for d in HOLIDAYS))
count median
holiday 11 11591
weekday 250 19653
weekend 104 19357
01 Jan, 20 Jan, 17 Feb, 26 May, 19 Jun, 04 Jul, 01 Sep, 13 Oct, 11 Nov, 27 Nov, 25 Dec
Weekends are as busy as working days — a median of 19,357 trips against 19,653 — so the difference between them is when people ride, not how many. Holidays are quieter than both, at 11,591, partly because four of the eleven fall in winter.
2. The hour-by-day matrix
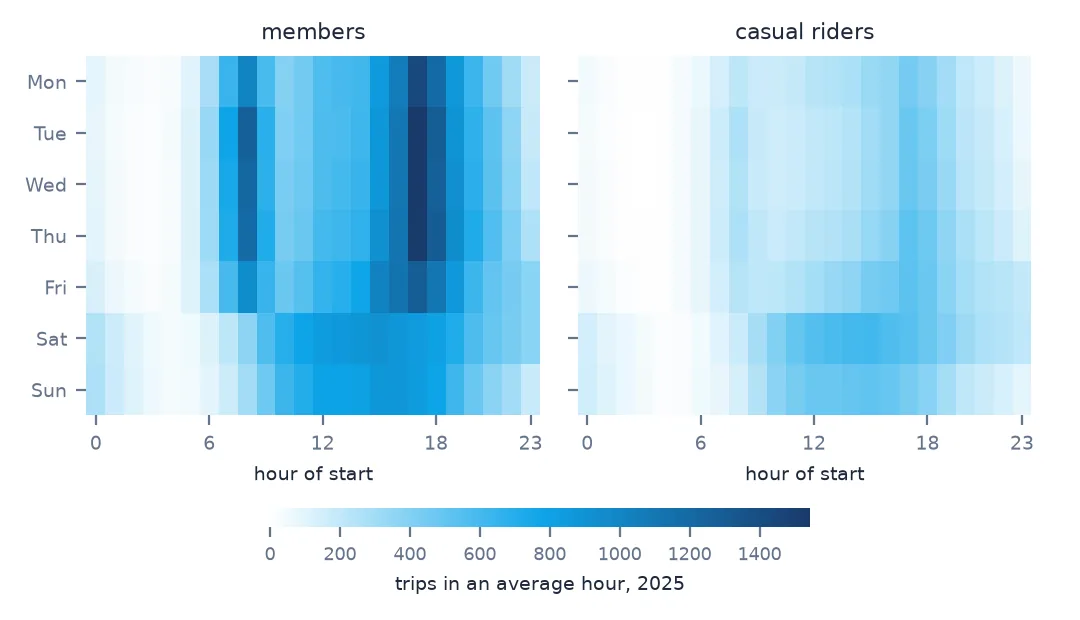
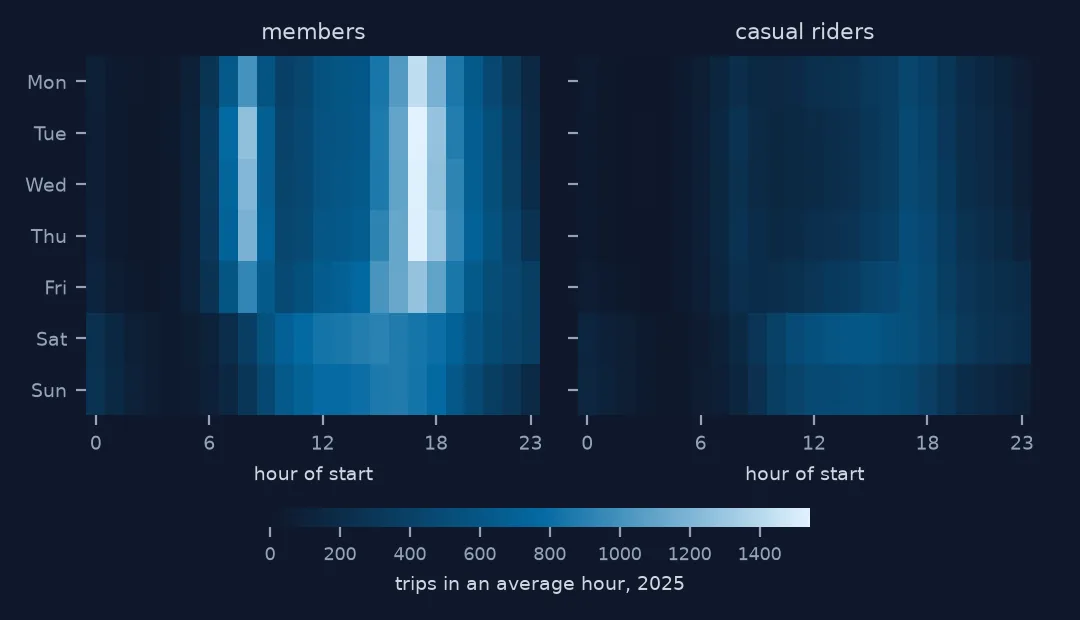
Count trips by weekday and hour, and divide by the number of each weekday in the year so that the cells are trips in an average hour:
grid = trips.groupby([trips.started_at.dt.dayofweek, "hour"]).size().unstack()
grid = grid / days.groupby(days.index.dayofweek).size().values[:, None]     # trips per average day
print(grid.loc[:, [6, 8, 12, 17, 22]].round(0).astype(int)
      .set_axis(["Mon", "Tue", "Wed", "Thu", "Fri", "Sat", "Sun"]).to_string())
hour 6 8 12 17 22
Mon 348 1215 799 1874 415
Tue 403 1525 765 2021 486
Wed 393 1466 768 2012 519
Thu 389 1446 823 2045 586
Fri 343 1168 941 1804 666
Sat 157 536 1381 1371 673
Sun 142 433 1260 1271 426
Tuesday to Thursday mornings at 8 a.m. carry 1,446–1,525 trips; Monday and Friday carry 1,215 and 1,168. That is a fifth fewer, the footprint of hybrid working, with offices fullest midweek. Friday makes up for it after work: 666 trips at 10 p.m., more than any other weeknight. Weekends have a single broad hump that peaks around midday.
3. Members and casual riders
wk = trips[trips.daytype == "working day"]
share = wk.groupby("hour").member_casual.apply(lambda s: (s == "member").mean())
print("member share of working-day trips by hour:", (100 * share.loc[[5, 8, 12, 14, 17, 23]]).round(0).astype(int).to_dict())
print("median minutes:", trips.groupby(["daytype", "member_casual"]).minutes.median().round(1).to_dict())
member share of working-day trips by hour: {5: 77, 8: 82, 12: 72, 14: 71, 17: 75, 23: 70}
median minutes: {('weekend or holiday', 'casual'): 13.2, ('weekend or holiday', 'member'): 8.8, ('working day', 'casual'): 10.9, ('working day', 'member'): 8.6}
Members make 82% of trips at 8 a.m. on working days and 70–72% in the early afternoon. Their trips are short whatever the day — a median of 8.6–8.8 minutes — while casual riders' trips lengthen from 10.9 minutes on working days to 13.2 on weekends.
4. A commute score for each station
The same split works for places. A station's commute score is the share of its starts that fall in the working-day peaks. Stations with fewer than 2,000 starts in the year are left out, and so are the e-bike trips with no station:
st = trips.dropna(subset=["start_station_id"])
peak = (st.daytype == "working day") & st.hour.isin([7, 8, 9, 16, 17, 18])
by = st.assign(peak=peak).groupby("start_station_id").agg(
    name=("start_station_name", "last"), lat=("start_lat", "median"), lng=("start_lng", "median"),
    trips=("ride_id", "size"), peak=("peak", "mean"), member=("member_casual", lambda s: (s == "member").mean()))
by = by[by.trips >= 2000]
print(f"{len(by)} stations with 2,000+ starts; share of starts in working-day peaks: "
      f"median {by.peak.median():.0%}, range {by.peak.min():.0%}-{by.peak.max():.0%}")
cols = ["name", "trips", "peak", "member"]
print(by.nlargest(4, "peak")[cols].round(2).to_string(index=False))
print(by.nsmallest(4, "peak")[cols].round(2).to_string(index=False))
441 stations with 2,000+ starts; share of starts in working-day peaks: median 33%, range 18%-63%
name trips peak member
20th St & Virginia Ave NW 3565 0.63 0.75
19th St & Pennsylvania Ave NW 5806 0.52 0.77
19th & G St NW 9070 0.52 0.80
19th & I St NW 8935 0.51 0.79
name trips peak member
National Harbor Carousel 2424 0.18 0.10
17th St & Independence Ave SW 13436 0.18 0.26
Rock Creek Pkwy & Pkwy Dr NW 6430 0.18 0.48
Prince St & Union St 3718 0.19 0.35
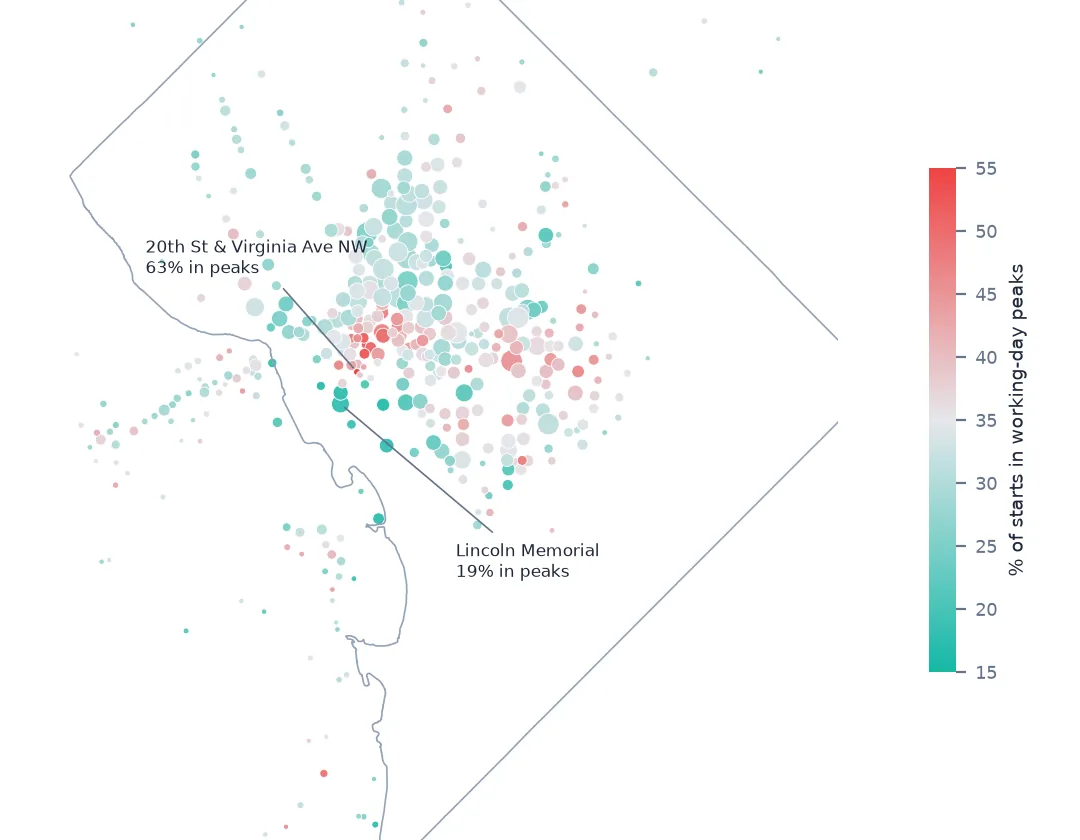
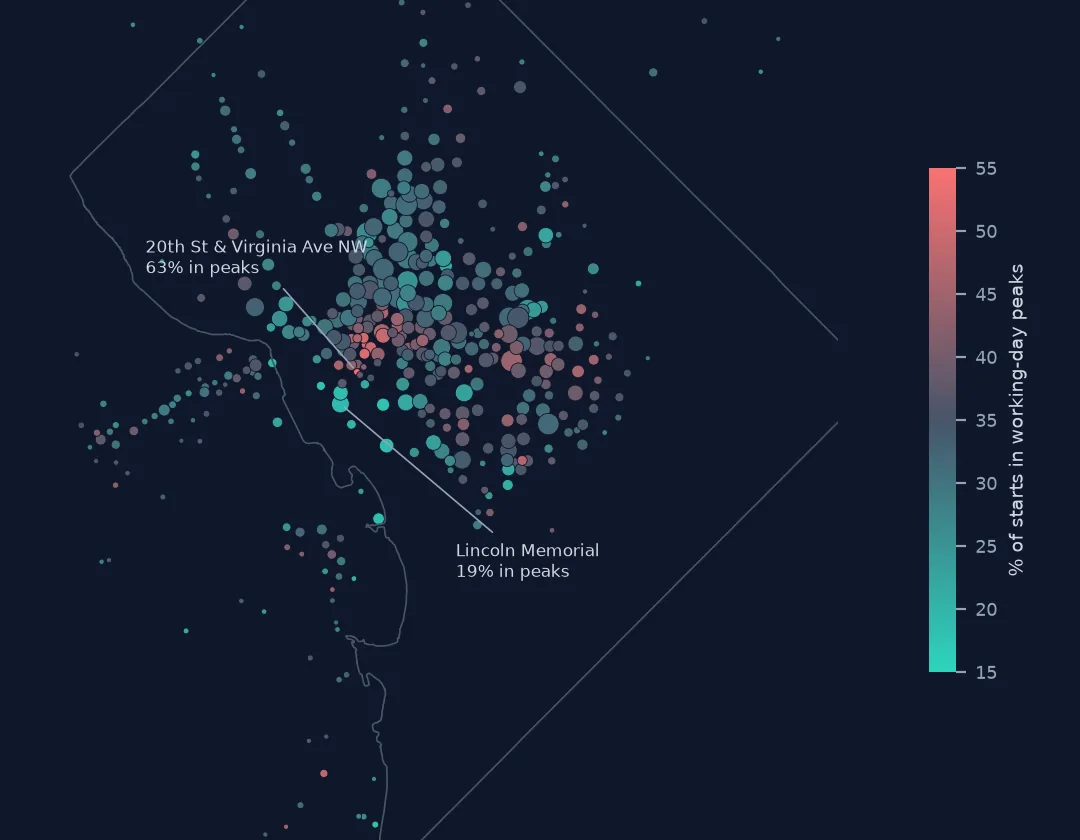
The most commuter-heavy stations are in Foggy Bottom and the blocks west of the White House — 20th Street & Virginia Avenue starts 63% of its trips in working-day peaks, three-quarters of them by members. The least are where people go on a day out: the carousel at National Harbor (10% members), the Mall at 17th Street, Rock Creek Parkway and the Old Town Alexandria waterfront. A median station sits at 33%.
Holidays, seasons and the shutdown
The data used on this page
Capital Bikeshare system data, the twelve monthly trip files for 2025, cleaned as in how to clean a year of bike-share trip data: trips that started in 2024, ran under a minute or ended before they began, and bikes never returned are removed. Federal holidays come from pandas' USFederalHolidayCalendar.
from pathlib import Path
import zipfile

import numpy as np
import pandas as pd
import requests
from pandas.tseries.holiday import USFederalHolidayCalendar

Path("data").mkdir(exist_ok=True)
MONTHS = [f"2025{m:02d}" for m in range(1, 13)]
for m in MONTHS:
    f = Path(f"data/{m}-capitalbikeshare-tripdata.zip")
    if not f.exists():
        f.write_bytes(requests.get(f"https://s3.amazonaws.com/capitalbikeshare-data/{f.name}", timeout=600).content)


def read_month(m):
    with zipfile.ZipFile(f"data/{m}-capitalbikeshare-tripdata.zip") as z, z.open(f"{m}-capitalbikeshare-tripdata.csv") as fh:
        return pd.read_csv(fh, dtype={"start_station_id": "Int64", "end_station_id": "Int64"},
                           parse_dates=["started_at", "ended_at"])


trips = pd.concat([read_month(m) for m in MONTHS], ignore_index=True)
trips["minutes"] = (trips.ended_at - trips.started_at).dt.total_seconds() / 60
trips = trips[(trips.started_at >= "2025-01-01") & (trips.minutes >= 1) & trips.end_lat.notna()].reset_index(drop=True)
HOLIDAYS = USFederalHolidayCalendar().holidays("2025-01-01", "2025-12-31")
print(f"{len(trips):,} clean trips; {len(HOLIDAYS)} federal holidays")
6,508,775 clean trips; 11 federal holidays
Example 1: a holiday rides like a Sunday
Treating holidays as weekends was an assumption. Each holiday's hourly shape can be compared with the average working day and the average Sunday:
hourly = trips.groupby([trips.started_at.dt.normalize(), "hour"]).size().unstack(fill_value=0)
shape = hourly.div(hourly.sum(axis=1), axis=0)
ref = {"working day": shape[kind == "weekday"].mean(), "Sunday": shape[shape.index.dayofweek == 6].mean()}
for d in HOLIDAYS:
    r = {k: np.corrcoef(shape.loc[d], v)[0, 1] for k, v in ref.items()}
    print(f"{d:%a %d %b}  like a working day {r['working day']:.2f}  like a Sunday {r['Sunday']:.2f}")
Wed 01 Jan like a working day 0.52 like a Sunday 0.88
Mon 20 Jan like a working day 0.77 like a Sunday 0.98
Mon 17 Feb like a working day 0.81 like a Sunday 0.97
Mon 26 May like a working day 0.80 like a Sunday 0.97
Thu 19 Jun like a working day 0.62 like a Sunday 0.90
Fri 04 Jul like a working day 0.72 like a Sunday 0.82
Mon 01 Sep like a working day 0.75 like a Sunday 0.99
Mon 13 Oct like a working day 0.83 like a Sunday 0.92
Tue 11 Nov like a working day 0.97 like a Sunday 0.86
Thu 27 Nov like a working day 0.43 like a Sunday 0.81
Thu 25 Dec like a working day 0.72 like a Sunday 0.95
Ten of the eleven holidays ride more like a Sunday than a working day, with correlations of 0.81–0.99. Veterans Day does not: at 0.97 it is closer to a working day than to a Sunday (0.86), because federal offices close for it and most other employers do not. Thanksgiving is the least work-like day of the year, at 0.43. A holiday calendar is a better start than the weekend rule, but it is not the same as a calendar of days off.
Example 2: the commuting share through the year
month = trips.started_at.dt.month
peak_all = (trips.daytype == "working day") & trips.hour.isin([7, 8, 9, 16, 17, 18])
by_month = pd.DataFrame({"peak share": peak_all.groupby(month).mean(),
                         "member share": (trips.member_casual == "member").groupby(month).mean()})
print((100 * by_month).round(1).T.to_string())
started_at 1 2 3 4 5 6 7 8 9 10 11 12
peak share 33.5 34.7 32.0 33.5 29.5 29.6 31.1 30.7 34.0 33.9 29.7 34.8
member share 79.0 77.9 70.0 70.2 69.6 69.5 69.2 66.1 70.5 70.9 74.6 79.5
The commuting share is lowest in late spring and summer (29.5–31.1% from May to August) and highest in winter and autumn, because leisure riding grows with the weather and commuting does not. Member share moves with it: 66.1% in August, 79.5% in December.
Example 3: the morning commute during the 2025 shutdown
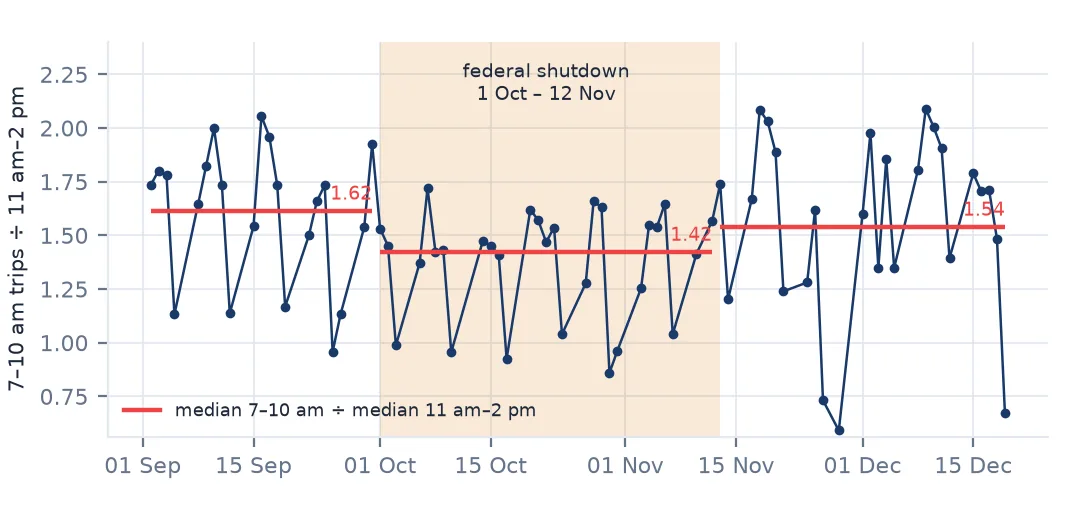
From 1 October to 12 November 2025 the federal government was shut down, and many of the city's federal employees were furloughed. Comparing the morning peak with the middle of the day, on working days only, separates a commuting effect from a general fall in riding:
wd = trips[trips.daytype == "working day"]
day = wd.started_at.dt.normalize()
am = wd[wd.hour.isin([7, 8, 9])].groupby(day).size()
noon = wd[wd.hour.isin([11, 12, 13])].groupby(day).size()
edges = pd.to_datetime(["2025-09-01", "2025-10-01", "2025-11-13", "2025-12-20"])
period = pd.cut(am.index, edges, right=False, labels=["September", "1 Oct-12 Nov", "13 Nov-19 Dec"])
tab = pd.DataFrame({"7-10 am": am, "11 am-2 pm": noon}).groupby(period, observed=True).median()
tab["morning / midday"] = tab["7-10 am"] / tab["11 am-2 pm"]
print(tab.round(2).to_string())
7-10 am 11 am-2 pm morning / midday
September 3947.0 2443.0 1.62
1 Oct-12 Nov 3554.0 2496.0 1.42
13 Nov-19 Dec 2603.0 1689.5 1.54
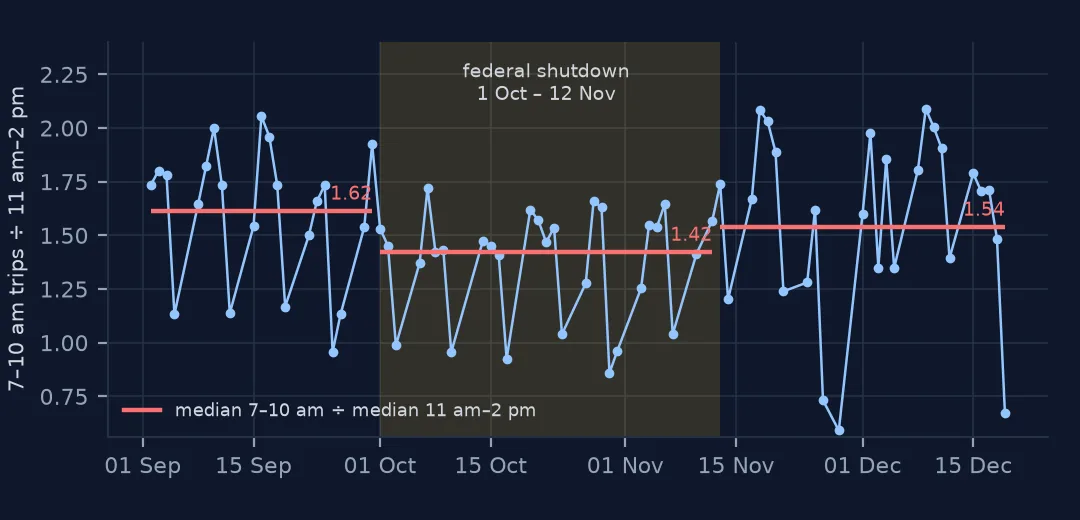
On a median working day of the shutdown, the morning peak fell from 3,947 trips to 3,554 while midday riding held (2,443, then 2,496). The ratio fell from 1.62 to 1.42 and recovered to 1.54 once offices reopened, even as both counts fell into winter. A day count would have missed it: a 10% loss at one time of day is hidden in the total.
Why membership is not a trip purpose
Trip purpose is never in the file. Every method on this page infers it from a pattern — the hour, the day, the station, the rider's plan — and each of these is a proxy with its own leaks. Members include the many residents who use an annual pass for shopping and evenings out; casual riders include visitors on their way to a meeting and residents who never bought a plan. The commute score of a station is mixed by design: a station between offices and a park serves both.
The patterns are still strong enough to use, because commuting is so regular. Six of twenty-four hours hold almost half of members' working-day trips; the same hours on a weekend hold the share they would hold by chance. When something interrupts commuting — a holiday, a shutdown — the morning peak collapses towards the weekend shape while the rest of the day barely moves. The useful measures are therefore shape measures: shares, ratios and correlations of the hourly profile, not totals.
Calendars, clocks and missing stations
- Start hour is local wall-clock time. Two nights a year have a missing or doubled hour; it does not matter for hourly shares, but it does for anything that counts trips per hour on those dates.
- Holidays are not days off. Veterans Day rides like a working day; the days around Christmas and Thanksgiving ride like holidays without being on the calendar.
- Station scores leave out a third of e-bike trips, the ones with no station. Score places on a grid instead if they matter.
- Hybrid work moves the weekday baseline. Monday and Friday are not interchangeable with Tuesday to Thursday any more; compare like days.
Internal links
- How to clean a year of bike-share trip data — the cleaning this page starts from
- How much rain and cold cut bike-share ridership — the day-to-day changes this page averages out
- How to estimate bike-share trip distance and speed — how far the commuters go
- How to map bike-share trips as flows — where the morning trips go
FAQ
What share of Capital Bikeshare trips are commutes?
The file cannot say. On working days in 2025, 47.7% of members' trips and 41.6% of casual riders' trips started in the six peak hours, against about 30% on weekends; the excess over the weekend share is a rough lower bound on commuting.
Did the 2025 federal shutdown change bike-share use in D.C.?
Yes, at the time of day you would expect. The median working day's 7–10 a.m. trips fell from 3,947 in September to 3,554 during the shutdown, while midday trips held steady.