
How to Measure How Many People Live Near a Bike-Share Station
On this page
Problem statement
"How many residents live within a five-minute walk of a bike-share station?" is the question every expansion plan and equity report asks. It is a nearest-facility measure — distance from each home to the closest station, summed over people — and in Python it is a few lines with GeoPandas. The answer still depends on choices the few lines hide: which points stand for where people live, which stations count, how far is "near", and what area the answer is reported for.
This page measures it for Washington, D.C. with the 2020 census population of every block, Capital Bikeshare's stations as of December 2025 and the city's eight wards, and shows how far the headline number moves with each choice.
Quick answer
Put each populated census block on a point inside it, find the nearest station with sjoin_nearest in a metric CRS, and sum the population within each distance:
homes = blocks[blocks.POP20 > 0].copy()
homes["geometry"] = homes.representative_point()
near = gpd.sjoin_nearest(homes, stations[["geometry"]], distance_col="metres")
near = near[~near.index.duplicated()]                      # ties: keep one station per block
share = lambda d: near.loc[near.metres <= d, "POP20"].sum() / near.POP20.sum()
print(f"{near.POP20.sum():,} residents in {len(near):,} populated blocks")
print("  ".join(f"within {d} m: {share(d):.1%}" for d in (200, 400, 800)))
689,545 residents in 4,500 populated blocks
within 200 m: 42.3% within 400 m: 77.6% within 800 m: 97.9%
Of the District's 689,545 residents in 2020, 77.6% live in a block whose point lies within 400 m of a station — about a five-minute walk — and 97.9% within 800 m. sjoin_nearest returns one row per tie when two stations are exactly equally close; dropping the duplicate index keeps each block counted once.
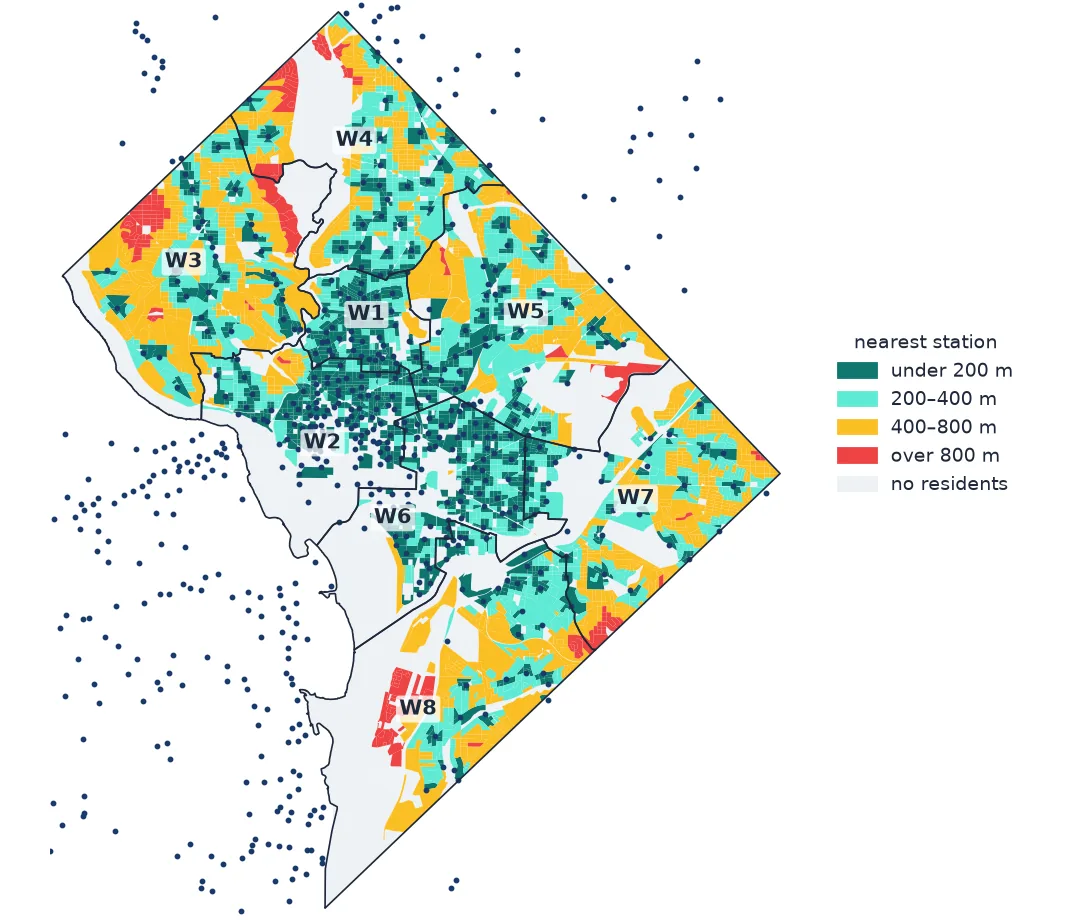
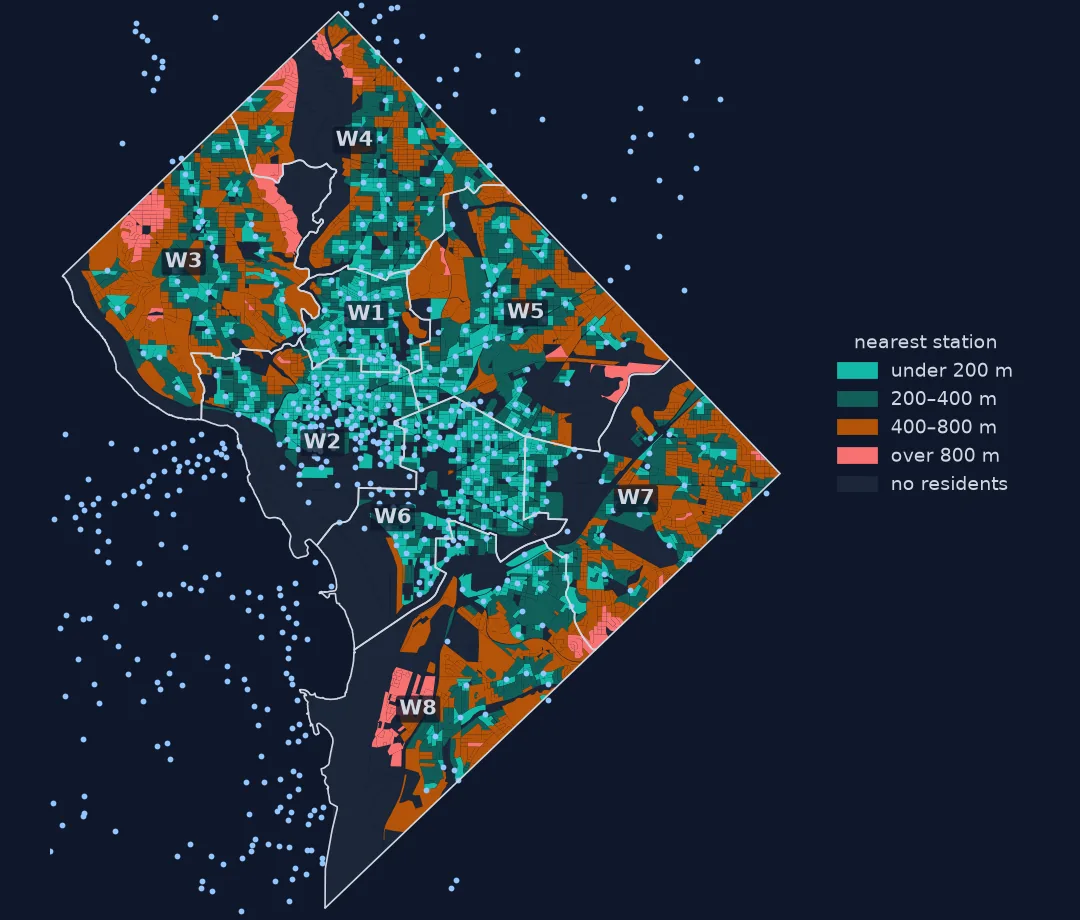
From blocks and stations to a coverage curve
1. Blocks with their population
print(f"{len(blocks):,} blocks, {blocks.POP20.sum():,} residents; {(blocks.POP20 == 0).sum():,} blocks with nobody living in them")
print(blocks.POP20.describe(percentiles=[0.5, 0.9, 0.99]).round(0).to_string())
6,012 blocks, 689,545 residents; 1,512 blocks with nobody living in them
count 6012.0
mean 115.0
std 191.0
min 0.0
50% 62.0
90% 268.0
99% 949.0
max 3060.0
A quarter of the 6,012 blocks have nobody living in them — parks, the Mall, rail yards, federal campuses — and they are dropped, or a station beside the Lincoln Memorial would count as covering an empty block. A median populated block has 62 residents; the largest has 3,060.
2. Stations from the trip files
print(f"{len(stations)} stations with a start in December 2025; "
      f"{stations.within(dc.union_all()).sum()} inside the District")
print(f"coordinate spread within a station, metres: median {spread.median():.1f}, max {spread.max():.0f}")
795 stations with a start in December 2025; 407 inside the District
coordinate spread within a station, metres: median 0.0, max 36
Stations come from the trip file rather than the live feed, so that the station list matches a dated period. 795 stations had a classic-bike start in December 2025, 407 of them inside the District. The rest still count: a resident on the Maryland line can walk to a Maryland station. Classic-bike start coordinates are the station's own, so their spread within a station is a few metres at most.
3. Measure from where people live, not from the block's centre
A block's centroid can fall outside the block when the block is curved or L-shaped, and a large block's centre can be far from the homes in it. representative_point() is guaranteed to lie inside:
cent = blocks[blocks.POP20 > 0].centroid
outside = ~cent.within(blocks[blocks.POP20 > 0].geometry)
print(f"centroids that fall outside their own block: {outside.sum()}")
big = homes.area_m2 > 100_000
print(f"blocks over 10 ha: {big.sum()}, holding {homes.loc[big, 'POP20'].sum():,} residents")
centroids that fall outside their own block: 30
blocks over 10 ha: 157, holding 64,367 residents
Thirty populated blocks have their centroid outside themselves, and 157 blocks are larger than 10 hectares, holding 64,367 people between them. For those, any single point is a guess at where people live; Example 1 shows how much the guess matters.
4. Coverage by distance
steps = [100, 200, 300, 400, 500, 600, 800, 1000, 1500]
curve = pd.Series({d: share(d) for d in steps})
print((100 * curve).round(1).to_string())
print(f"median resident: {near.metres.repeat(near.POP20).median():.0f} m from a station")
100 10.5
200 42.3
300 64.1
400 77.6
500 86.6
600 92.7
800 97.9
1000 99.0
1500 99.9
median resident: 231 m from a station
The curve rises steeply between 100 and 500 m and is almost flat after 800 m. A median resident lives 231 m from a station. The choice of threshold is therefore the choice of answer: 42.3% at 200 m, 64.1% at 300 m, 77.6% at 400 m.
5. Ward by ward
near["ward"] = gpd.sjoin(homes[["geometry"]], wards[["NAME", "geometry"]], predicate="within").NAME
print(f"blocks not inside any ward: {near.ward.isna().sum()}")
by = near.groupby("ward").apply(lambda g: pd.Series({
    "residents": g.POP20.sum(),
    "within 400 m": g.loc[g.metres <= 400, "POP20"].sum() / g.POP20.sum(),
    "median m": g.metres.repeat(g.POP20).median()}), include_groups=False)
by["stations"] = gpd.sjoin(stations, wards[["NAME", "geometry"]], predicate="within").groupby("NAME").size()
by["residents per station"] = by.residents / by.stations
print(by.round(3).to_string())
blocks not inside any ward: 0
residents within 400 m median m stations residents per station
ward
Ward 1 85285.0 0.991 153.987 44 1938.295
Ward 2 89485.0 0.956 141.164 111 806.171
Ward 3 85301.0 0.685 299.143 34 2508.853
Ward 4 84660.0 0.712 305.654 27 3135.556
Ward 5 89617.0 0.734 259.115 51 1757.196
Ward 6 84305.0 0.998 160.194 74 1139.257
Ward 7 85685.0 0.556 377.641 32 2677.656
Ward 8 85207.0 0.575 370.915 34 2506.088
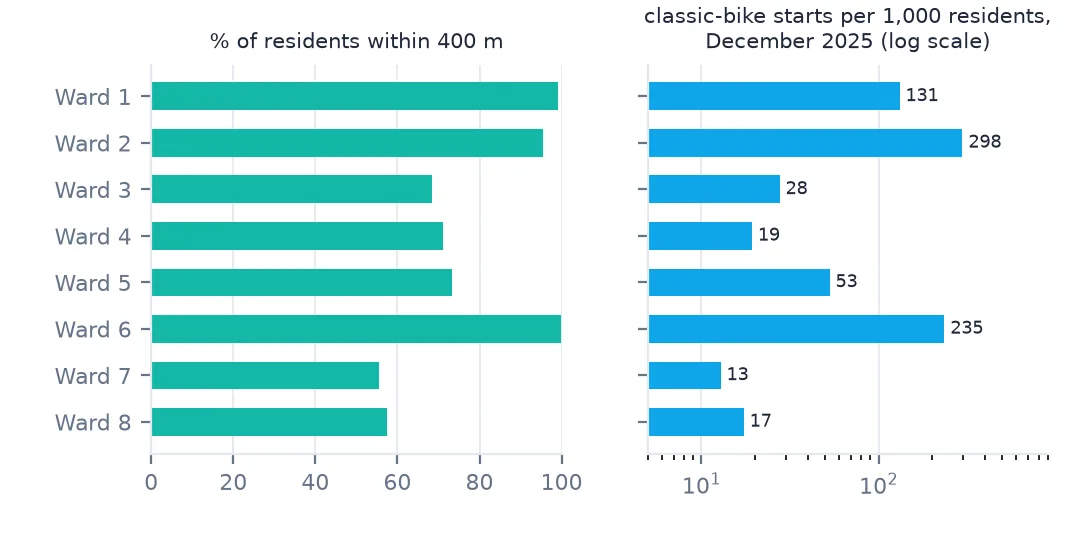
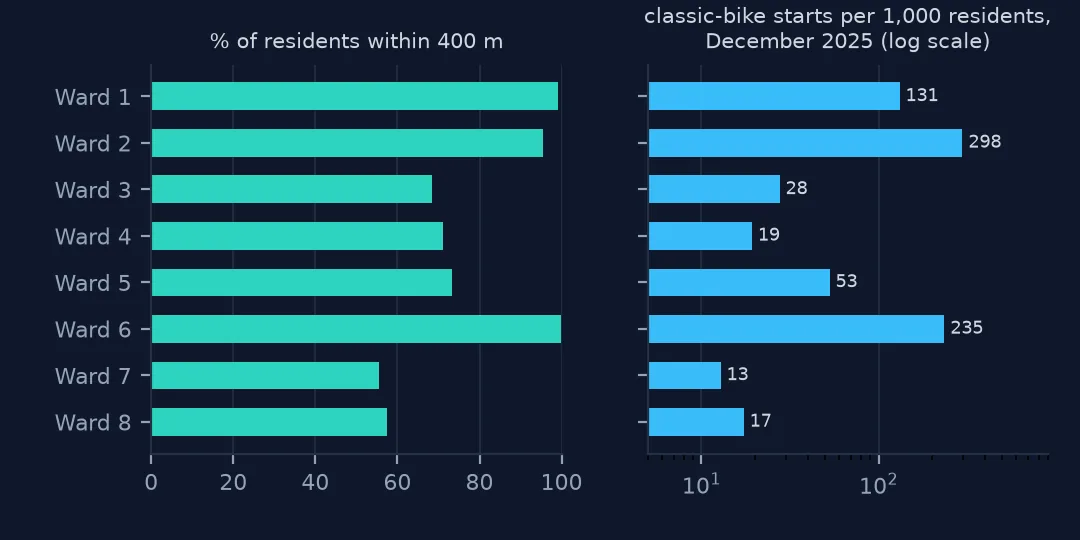
The wards each hold between 84,305 and 89,617 people, by design, which makes them comparable. Coverage is not: 99.1% of Ward 1 and 99.8% of Ward 6 live within 400 m of a station, against 55.6% of Ward 7 and 57.5% of Ward 8, east of the Anacostia River, where the median resident is 371–378 m from a dock rather than 141–160 m. Ward 2, downtown, has 111 stations for 89,485 residents — one per 806 people; Ward 4 has one per 3,136.
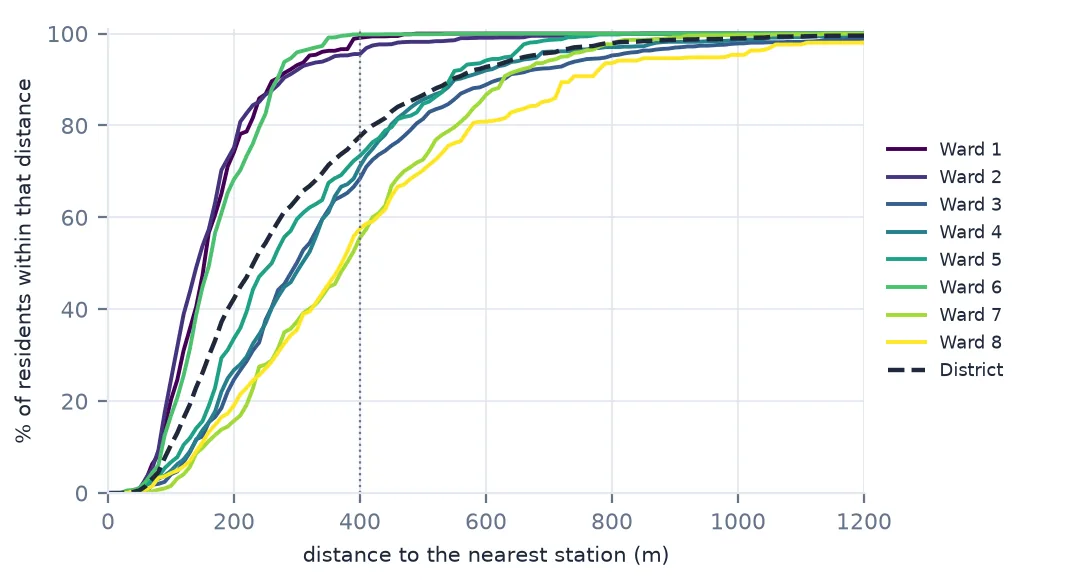
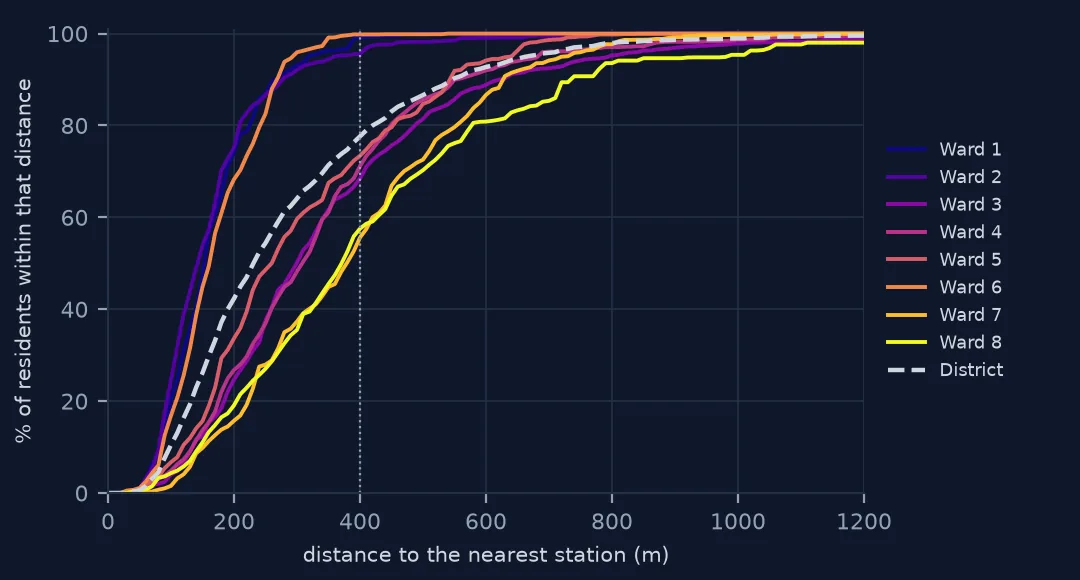
Points, polygons and use
The data used on this page
- US Census Bureau, 2020 TIGER/Line tabulation blocks for the District of Columbia (
tl_2020_11_tabblock20.zip), which carry the 2020 census population of each block inPOP20. - DC Office of the Chief Technology Officer, Ward – 2022 boundaries from the DCGIS map service.
- Capital Bikeshare system data, the December 2025 trip file: a station is any dock with a classic-bike start that month, placed at the median of those starts.
from pathlib import Path
import zipfile

import geopandas as gpd
import numpy as np
import pandas as pd
import requests

Path("data").mkdir(exist_ok=True)
SOURCES = {
    "tl_2020_11_tabblock20.zip": "https://www2.census.gov/geo/tiger/TIGER2020/TABBLOCK20/tl_2020_11_tabblock20.zip",
    "202512-capitalbikeshare-tripdata.zip": "https://s3.amazonaws.com/capitalbikeshare-data/202512-capitalbikeshare-tripdata.zip",
    "dc-wards-2022.geojson": "https://maps2.dcgis.dc.gov/dcgis/rest/services/DCGIS_DATA/"
                             "Administrative_Other_Boundaries_WebMercator/MapServer/53/query?where=1%3D1&outFields=NAME&outSR=4326&f=geojson",
}
for name, url in SOURCES.items():
    if not Path(f"data/{name}").exists():
        Path(f"data/{name}").write_bytes(requests.get(url, timeout=600).content)

UTM = 26918                                                     # NAD83 / UTM zone 18N, metres
blocks = gpd.read_file("zip://data/tl_2020_11_tabblock20.zip").to_crs(UTM)
blocks["area_m2"] = blocks.area
wards = gpd.read_file("data/dc-wards-2022.geojson").to_crs(UTM)
dc = wards.dissolve()

with zipfile.ZipFile("data/202512-capitalbikeshare-tripdata.zip") as z:
    trips = pd.read_csv(z.open("202512-capitalbikeshare-tripdata.csv"), dtype={"start_station_id": "Int64"})
classic = trips[(trips.rideable_type == "classic_bike") & trips.start_station_id.notna()]
pos = classic.groupby("start_station_id").agg(lat=("start_lat", "median"), lng=("start_lng", "median"),
                                              starts=("ride_id", "size"))
spread = classic.groupby("start_station_id").start_lat.agg(lambda s: (s.max() - s.min()) * 111_000)
stations = gpd.GeoDataFrame(pos, geometry=gpd.points_from_xy(pos.lng, pos.lat), crs=4326).to_crs(UTM)
print(f"{len(blocks):,} blocks, {len(wards)} wards, {len(stations)} stations")
6,012 blocks, 8 wards, 795 stations
Example 1: how much the choice of point matters
Measuring from the block's nearest edge instead of a point inside it gives the most generous answer: a block counts as near if any part of it is near.
poly = blocks[blocks.POP20 > 0][["POP20", "geometry"]]
edge = gpd.sjoin_nearest(poly, stations[["geometry"]], distance_col="metres")
edge = edge[~edge.index.duplicated()]
for d in (200, 400):
    print(f"within {d} m — representative point: {share(d):.1%}, any part of the block: "
          f"{edge.loc[edge.metres <= d, 'POP20'].sum() / edge.POP20.sum():.1%}")
within 200 m — representative point: 42.3%, any part of the block: 68.2%
within 400 m — representative point: 77.6%, any part of the block: 89.5%
At 400 m the generous measure says 89.5% instead of 77.6%; at 200 m, 68.2% instead of 42.3%. The truth is between the two and closer to the point measure in dense blocks, where homes fill the block. A report should say which it used: the difference is larger than the difference between most wards.
Example 2: coverage against use
stations["ward"] = gpd.sjoin(stations, wards[["NAME", "geometry"]], predicate="within").NAME
by["December classic-bike starts per 1,000 residents"] = stations.groupby("ward").starts.sum() / by.residents * 1000
print(by[["within 400 m", "residents per station", "December classic-bike starts per 1,000 residents"]].round(2)
      .sort_values("within 400 m").to_string())
within 400 m residents per station December classic-bike starts per 1,000 residents
ward
Ward 7 0.56 2677.66 12.85
Ward 8 0.58 2506.09 17.35
Ward 3 0.68 2508.85 27.67
Ward 4 0.71 3135.56 19.31
Ward 5 0.73 1757.20 52.94
Ward 2 0.96 806.17 297.61
Ward 1 0.99 1938.30 131.41
Ward 6 1.00 1139.26 235.36
Use follows coverage, and then far exceeds it. Ward 2's stations recorded 297.61 classic-bike starts per 1,000 residents in December against 12.85 in Ward 7. This ratio is not a measure of residents' riding: Ward 2's stations are used by commuters and visitors who live elsewhere, so starts are counted where the trip began, not where the rider lives. What it does show is that a ward with 56% coverage cannot be expected to show the use of one with 99%.
What a coverage figure is made of
A coverage figure is the sum of population over the places that pass a distance test, and each of its parts is a modelling decision. The population is a census count attached to an area, so a point has to stand for it; this page used one point per block, the smallest census unit, which keeps the error to the size of a block. The distance is straight-line in a projected CRS (UTM zone 18N, in metres); a walking distance on the street network is always longer, sometimes much longer across a river or a freeway. The stations are a dated list, because a station opened in March changes the answer for March onwards.
The equity question needs more than the city-wide number. The District's 77.6% hides a range from 56% to 100% across wards of equal population. That is why the station list and the population both have to be dated: a coverage report is a comparison over time, and next year's number is only comparable with this one if it is built the same way.
Choices that move the answer
- Point or polygon. At 400 m the two measures give 77.6% and 89.5%; state which.
- Empty blocks. Drop blocks with no population, or parks count as covered.
- Stations across the boundary count for residents near it.
- Straight line is a lower bound on walking distance; rivers and highways make it worse.
- Population is from 2020; stations are from December 2025. New housing since the census is invisible here.
- Starts are counted where trips begin, not where riders live, so use per resident is not a residents' rate.
Internal links
- How to read a GBFS bike-share feed — the live station list
- How to find the nearest hospital to every address — the same nearest-facility method at city scale
- How to separate commuting from leisure in bike-share trips — what the stations are used for
FAQ
What share of Washington, D.C. residents live near a Capital Bikeshare station?
77.6% of the 2020 population lives in a block whose interior point is within 400 m of a station active in December 2025, and 97.9% within 800 m.
Which D.C. wards have the least bike-share coverage?
Wards 7 and 8, east of the Anacostia River: 55.6% and 57.5% of residents within 400 m, against 99.1% and 99.8% in Wards 1 and 6.