
Bike-Share Trip Data Explained: One Schema, Five Cities
On this page
Problem statement
Lyft runs bike-share systems in several American cities and publishes their trips in one format: thirteen columns, one row per rental, a CSV per month. Code written for Washington's files runs unchanged on Chicago's or Boston's. That is convenient and slightly dangerous, because the columns being the same does not mean the rules behind them are. Whether an e-bike can end a trip away from a dock, how its location is recorded, which short trips are deleted before publication and when a rental is closed all differ between systems, and none of it is in the file.
This page reads the June 2025 file of five systems — Washington, Chicago, the San Francisco Bay Area, Boston and Jersey City — and walks through the schema column by column, measuring what each column means in each city.
Quick answer
Read each month into a DataFrame and compare a few shares side by side; the columns match exactly, the systems do not:
print(f"{'':16s}" + "".join(f"{c:>14s}" for c in CITIES))
print(f"{'columns':16s}" + "".join(f"{len(t[c].columns):>14d}" for c in CITIES))
print(f"{'same columns':16s}" + "".join(f"{str(list(t[c].columns) == list(t['Washington'].columns)):>14s}" for c in CITIES))
print(f"{'trips, June':16s}" + "".join(f"{len(t[c]):>14,}" for c in CITIES))
print(f"{'e-bike share':16s}" + "".join(f"{(t[c].rideable_type == 'electric_bike').mean():>14.1%}" for c in CITIES))
print(f"{'member share':16s}" + "".join(f"{(t[c].member_casual == 'member').mean():>14.1%}" for c in CITIES))
Washington Chicago Bay Area Boston Jersey City
columns 13 13 13 13 13
same columns True True True True True
trips, June 691,620 678,904 378,745 488,202 97,124
e-bike share 60.4% 62.6% 78.4% 28.3% 61.5%
member share 69.4% 57.0% 76.9% 67.8% 74.9%
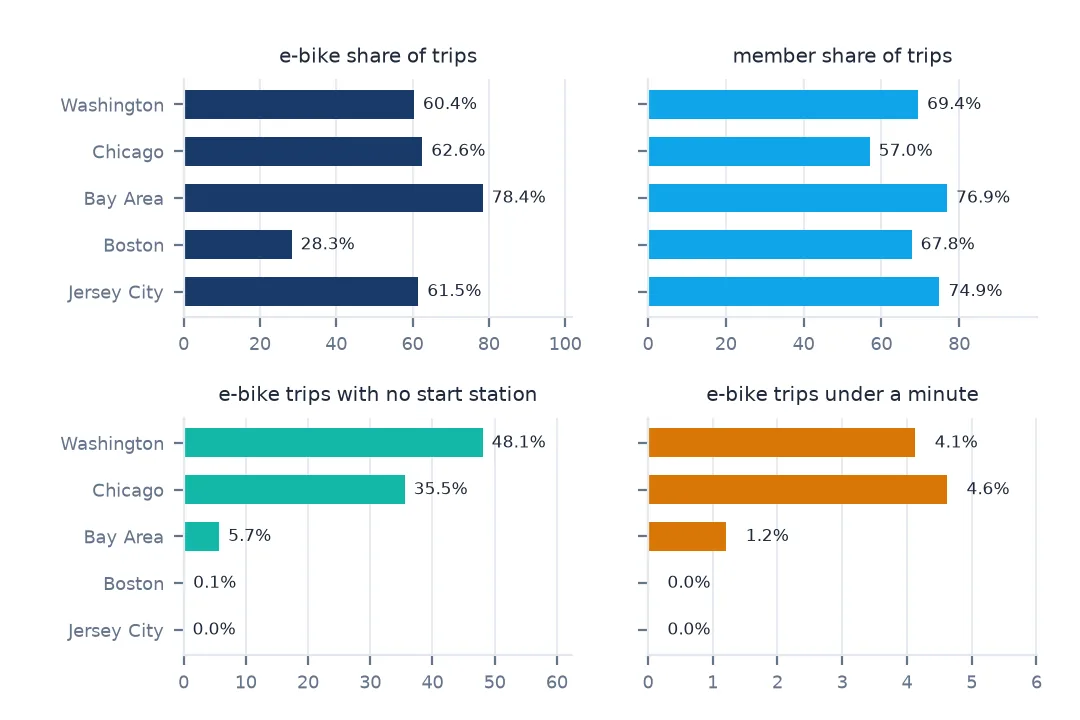
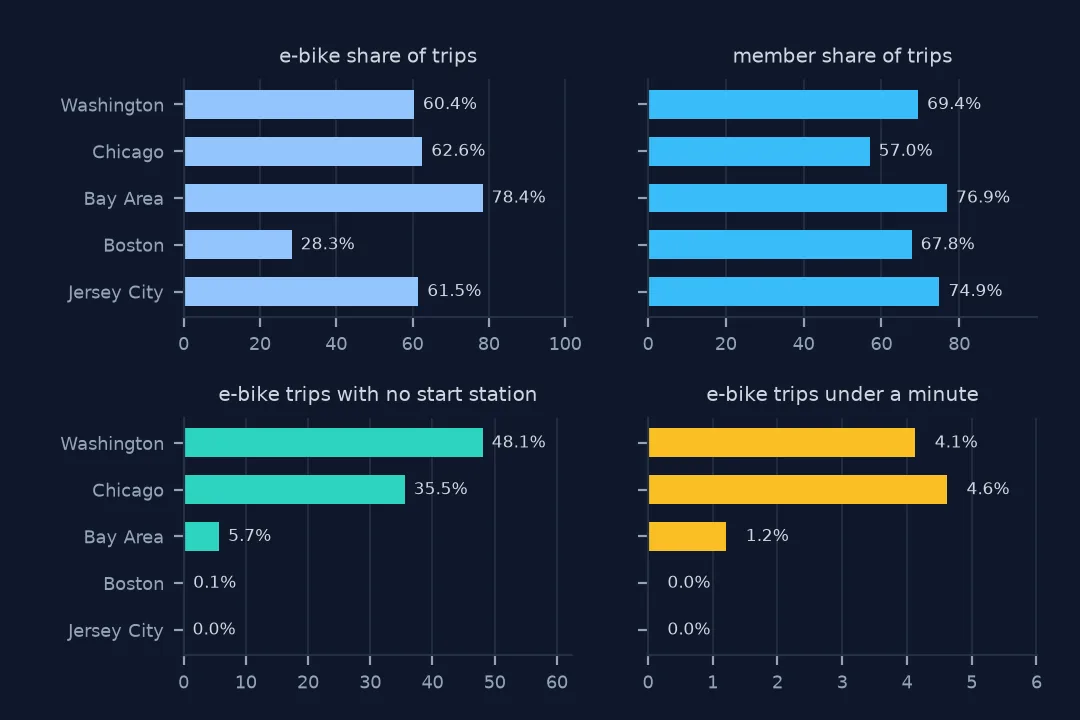
All five have the same thirteen columns in the same order. Within them, the e-bike share runs from 28.3% of trips in Boston to 78.4% in the Bay Area, and members take from 57.0% of trips in Chicago to 76.9% in the Bay Area. Those are differences in the systems. The differences below are in the records.
The thirteen columns, city by city
1. A row is a rental
row = t["Chicago"].iloc[0]
print(row.to_string())
print({c: t[c].ride_id.is_unique for c in CITIES})
ride_id 0E43949BF937C7DA
rideable_type electric_bike
started_at 2025-06-05 21:24:56.104000
ended_at 2025-06-05 21:38:44.446000
start_station_name Clark St & Armitage Ave
start_station_id CHI00474
end_station_name Dearborn Pkwy & Delaware Pl
end_station_id CHI00306
start_lat 41.918306
start_lng -87.636282
end_lat 41.898969
end_lng -87.629912
member_casual member
{'Washington': True, 'Chicago': True, 'Bay Area': True, 'Boston': True, 'Jersey City': True}
A row is one rental: an anonymous ride_id, unique within every file; the bike type; local start and end times to the millisecond; a start and end station (name and id) when there was one; start and end coordinates; and whether the rider had a membership. There is no rider id, no bike id and no route. Nothing links two trips by the same person or the same bike, by design.
2. Bike types and what each implies
for c in CITIES:
    print(f"{c:12s}", t[c].rideable_type.value_counts().to_dict())
Washington {'electric_bike': 417566, 'classic_bike': 274054}
Chicago {'electric_bike': 424789, 'classic_bike': 254115}
Bay Area {'electric_bike': 296885, 'classic_bike': 81860}
Boston {'classic_bike': 349936, 'electric_bike': 138266}
Jersey City {'electric_bike': 59763, 'classic_bike': 37361}
Every system has two types, classic_bike and electric_bike (older files also had docked_bike). The type matters for more than speed: as the next steps show, in three of the five cities it decides whether a trip has a station at all.
3. Stations: ids, names and trips without one
for c in CITIES:
    d = t[c]
    e = d[d.rideable_type == "electric_bike"]
    print(f"{c:12s} id like {str(d.start_station_id.dropna().iloc[0]):>14s}   stations {d.start_station_id.nunique():>5,}   "
          f"e-bike trips with no start station {e.start_station_id.isna().mean():6.1%}")
Washington id like 32046 stations 806 e-bike trips with no start station 48.1%
Chicago id like CHI00474 stations 1,376 e-bike trips with no start station 35.5%
Bay Area id like OK-A4 stations 584 e-bike trips with no start station 5.7%
Boston id like D32043 stations 554 e-bike trips with no start station 0.1%
Jersey City id like JC099 stations 85 e-bike trips with no start station 0.0%
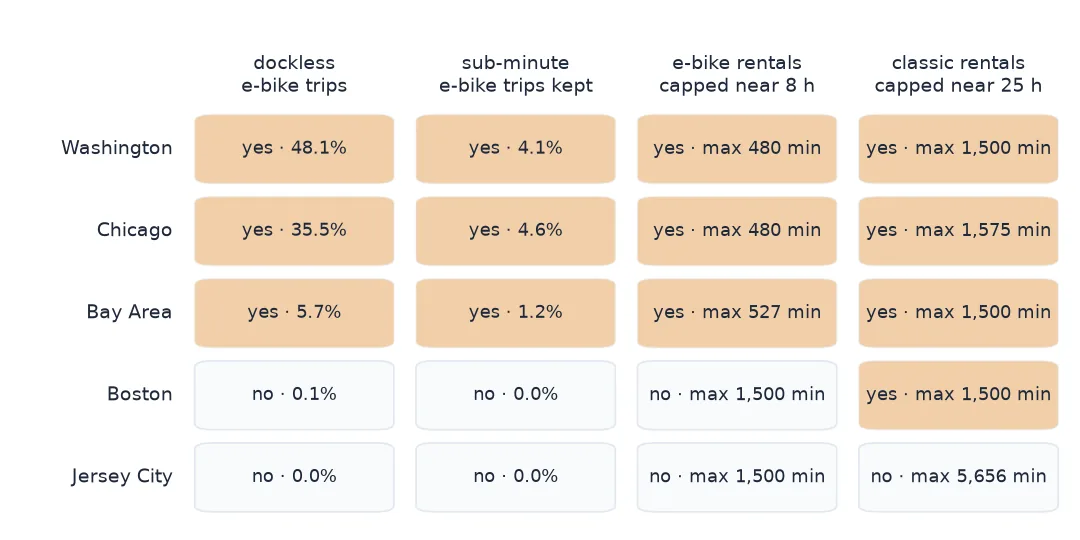
Station ids are strings in four cities and numbers in one: Washington's five-digit codes, Chicago's CHI00474, the Bay Area's city-prefixed OK-A4 (Oakland), Boston's D32043 and Jersey City's JC099. Reading them as integers, as is natural in Washington, breaks everywhere else, so read them as strings. The last column is the largest difference in the schema. In Washington 48.1% of e-bike trips had no start station in June 2025, in Chicago 35.5%; in the Bay Area 5.7%; in Boston and Jersey City practically none. The same empty field means "a dockless trip" in one city and "a data error" in another.
4. Coordinates: station positions and rounded ones
Count the decimal places of the start latitude, separately for trips with and without a station. Using repr of the float, rather than formatting, shows what the file actually held:
def decimals(s):
    return s.dropna().map(lambda v: len(repr(v).split(".")[1]) if "." in repr(v) else 0)


for c in CITIES:
    d = t[c]
    free = d[d.start_station_id.isna()]
    print(f"{c:12s} no-station starts: {decimals(free.start_lat).value_counts(normalize=True).round(2).head(2).to_dict()}   "
          f"station starts, median decimals: {decimals(d[d.start_station_id.notna()].start_lat).median():.0f}")
lat = t["Washington"].start_lat.median()
print(f"a 0.01-degree cell at {lat:.1f}°N: {0.01 * 111.13:.2f} km north-south, "
      f"{0.01 * 111.32 * np.cos(np.radians(lat)):.2f} km east-west")
Washington no-station starts: {2: 0.86, 1: 0.14} station starts, median decimals: 6
Chicago no-station starts: {2: 0.89, 1: 0.11} station starts, median decimals: 6
Bay Area no-station starts: {2: 0.89, 1: 0.11} station starts, median decimals: 7
Boston no-station starts: {2: 0.97, 1: 0.03} station starts, median decimals: 13
Jersey City no-station starts: {} station starts, median decimals: 13
a 0.01-degree cell at 38.9°N: 1.11 km north-south, 0.87 km east-west
Every trip without a station has its coordinates rounded to two decimal places (one, when the second is a zero): a grid of cells 1.11 km tall and 0.87 km wide at Washington's latitude. Trips at a station carry the station's own coordinates, with six or seven decimals in three cities — and thirteen in Boston and Jersey City, which is a floating-point artefact of how those positions were stored, not centimetre precision. Neither number describes where a rider was; one is a dock, the other a kilometre-wide cell.
5. Times: local, unzoned, and filtered differently
for c in CITIES:
    d = t[c]
    mins = (d.ended_at - d.started_at).dt.total_seconds() / 60
    by = mins.groupby(d.rideable_type)
    print(f"{c:12s} under 1 min: classic {(by.get_group('classic_bike') < 1).mean():.1%}, "
          f"e-bike {(by.get_group('electric_bike') < 1).mean():.1%}   "
          f"longest: classic {by.max()['classic_bike']:,.0f} min, e-bike {by.max()['electric_bike']:,.0f} min")
Washington under 1 min: classic 0.0%, e-bike 4.1% longest: classic 1,500 min, e-bike 480 min
Chicago under 1 min: classic 0.0%, e-bike 4.6% longest: classic 1,575 min, e-bike 480 min
Bay Area under 1 min: classic 0.0%, e-bike 1.2% longest: classic 1,500 min, e-bike 527 min
Boston under 1 min: classic 0.0%, e-bike 0.0% longest: classic 1,500 min, e-bike 1,500 min
Jersey City under 1 min: classic 0.0%, e-bike 0.0% longest: classic 5,656 min, e-bike 1,500 min
No classic-bike trip under a minute survives in any city: the operators' published rule of removing them is applied. For e-bikes it is applied in Boston and Jersey City and not in the other three, where 1.2–4.6% of e-bike trips last under a minute. The longest trips show the cut-offs at which each system closes a rental: 1,500 minutes (25 hours) for classic bikes in most cities, 480 minutes for e-bikes in Washington and Chicago, 1,500 for e-bikes in Boston and Jersey City — and a classic-bike trip of 5,656 minutes in Jersey City that no cap stopped. The timestamps themselves carry no time zone in any file; each is local wall-clock time.
The same questions in five systems
The data used on this page
The June 2025 trip files of five systems that Lyft operates and publishes in the same format: Capital Bikeshare (Washington, D.C.), Divvy (Chicago), Bay Wheels (San Francisco Bay Area), Bluebikes (Boston) and Citi Bike's Jersey City file. Each is published under its operator's data licence agreement.
from pathlib import Path
import zipfile

import numpy as np
import pandas as pd
import requests

Path("data").mkdir(exist_ok=True)
FILES = {
    "Washington": "https://s3.amazonaws.com/capitalbikeshare-data/202506-capitalbikeshare-tripdata.zip",
    "Chicago": "https://divvy-tripdata.s3.amazonaws.com/202506-divvy-tripdata.zip",
    "Bay Area": "https://s3.amazonaws.com/baywheels-data/202506-baywheels-tripdata.csv.zip",
    "Boston": "https://s3.amazonaws.com/hubway-data/202506-bluebikes-tripdata.zip",
    "Jersey City": "https://s3.amazonaws.com/tripdata/JC-202506-citibike-tripdata.csv.zip",
}
CITIES = list(FILES)
t = {}
for city, url in FILES.items():
    f = Path("data") / url.rsplit("/", 1)[-1]
    if not f.exists():
        f.write_bytes(requests.get(url, timeout=600).content)
    with zipfile.ZipFile(f) as z:
        name = next(n for n in z.namelist() if n.endswith(".csv") and not n.startswith("__MACOSX"))
        t[city] = pd.read_csv(z.open(name), dtype={"start_station_id": str, "end_station_id": str},
                              parse_dates=["started_at", "ended_at"], low_memory=False)
print({c: f"{len(d):,}" for c, d in t.items()})
{'Washington': '691,620', 'Chicago': '678,904', 'Bay Area': '378,745', 'Boston': '488,202', 'Jersey City': '97,124'}
Example 1: when each city rides
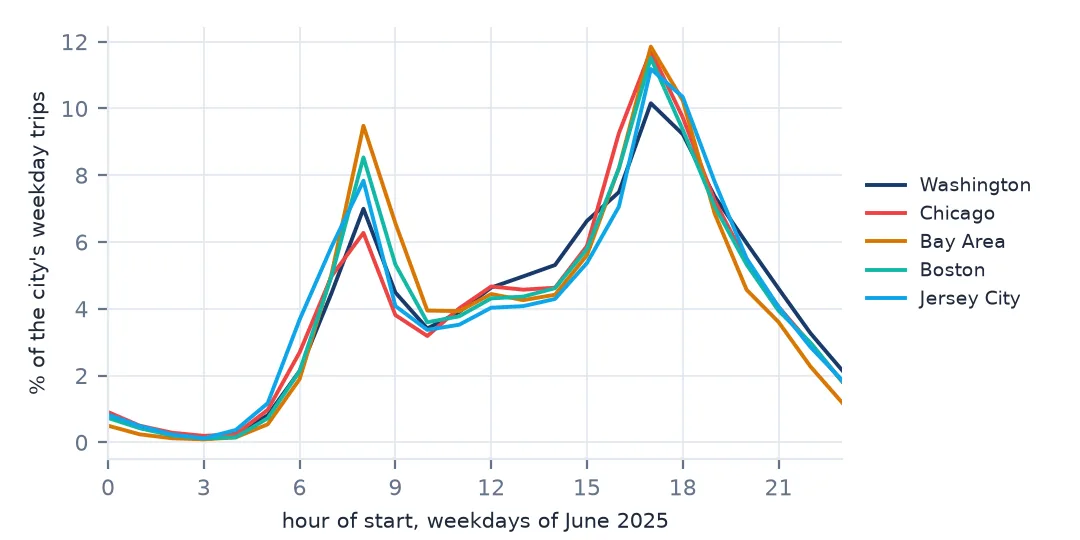
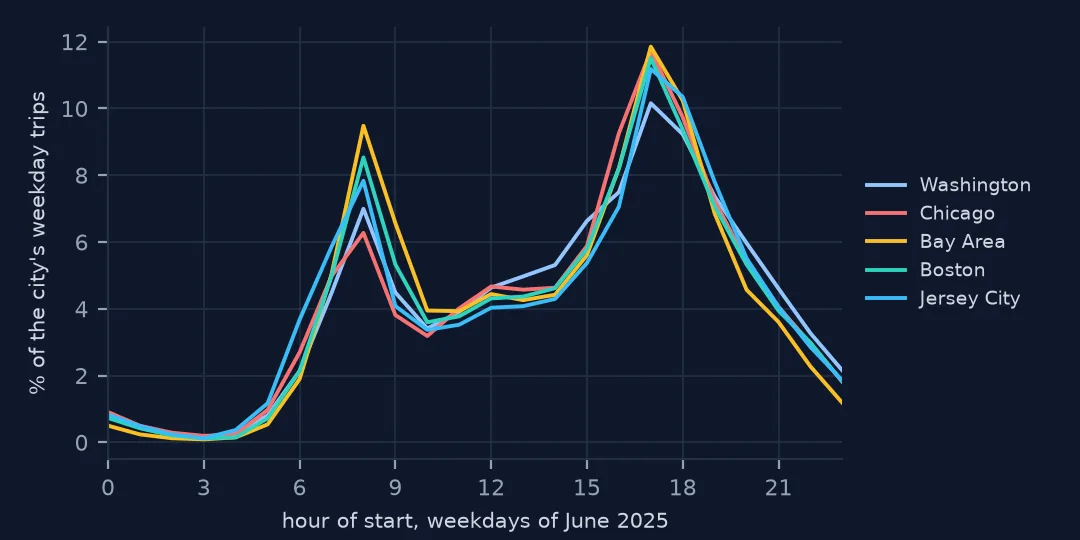
hours = pd.DataFrame({c: t[c].started_at.dt.hour.value_counts(normalize=True).sort_index() for c in CITIES})
weekday = {c: t[c][t[c].started_at.dt.dayofweek < 5] for c in CITIES}
peak = {c: weekday[c].started_at.dt.hour.isin([7, 8, 9, 16, 17, 18]).mean() for c in CITIES}
print("share of weekday trips in the six commuting hours:", {c: f"{v:.1%}" for c, v in peak.items()})
print("busiest start hour:", hours.idxmax().to_dict())
share of weekday trips in the six commuting hours: {'Washington': '42.8%', 'Chicago': '45.8%', 'Bay Area': '51.4%', 'Boston': '47.9%', 'Jersey City': '46.4%'}
busiest start hour: {'Washington': 17, 'Chicago': 17, 'Bay Area': 17, 'Boston': 17, 'Jersey City': 17}
The shared schema does make comparisons quick. All five systems peak at 5 p.m. The share of weekday trips in the six commuting hours ranges from 42.8% in Washington — where, as the commuting page shows, much of the system serves visitors to the Mall — to 51.4% in the Bay Area.
Example 2: how long a trip lasts
med = {}
for c in CITIES:
    d = t[c]
    m = (d.ended_at - d.started_at).dt.total_seconds() / 60
    ok = (m >= 1) & d.end_lat.notna()
    med[c] = m[ok].groupby([d.rideable_type[ok], d.member_casual[ok]]).median().round(1)
print(pd.DataFrame(med).to_string())
Washington Chicago Bay Area Boston Jersey City
rideable_type member_casual
classic_bike casual 14.9 17.5 14.7 16.6 11.1
member 8.5 10.2 7.8 9.8 5.9
electric_bike casual 10.8 11.5 12.1 13.3 7.6
member 9.7 9.3 8.8 10.5 5.6
Once trips under a minute and unreturned bikes are removed, the pattern holds in every city: members ride shorter trips than casual riders, and casual riders ride shorter on e-bikes than on classic bikes. Jersey City's trips are the shortest, with a median of 5.6–5.9 minutes for members — a small, dense system of 85 stations — and Chicago's casual classic-bike trips the longest, at 17.5 minutes.
A shared format is not a shared definition
The trip file is the end of a pipeline that starts in the bike, the dock and the app, and each system's pipeline makes its own decisions before anything is published. Three of them change what the columns mean.
Where an e-bike trip may end. A docked system records stations at both ends of every trip. A system that lets e-bikes lock to a rack or a post records a station only when the bike happened to end at one; the rest of the trips carry an empty station and a rounded position. That one policy is why "trips per station" covers all but 0.1% of e-bike trips in Boston and about half in Washington.
What is published about location. A station has a fixed position, so publishing it reveals nothing about a rider. A free-floating bike's position could be someone's front door, and the published files round it to two decimal places — most likely for that reason, though the system data pages do not say. The rounding is the same in every city; its consequence is that dockless trips can be analysed only at the scale of the rounding, never snapped to a street.
Which trips are published. Trips under a minute and rentals that never ended are handled differently by bike type and by city, and the system data pages do not always say so. Measuring them, as above, is the only way to know which rules apply to a given file — and to apply the missing ones yourself so that five cities' numbers can be compared.
Reading a new city's files
- Read station ids as strings. Only Washington's are numeric.
- Check the e-bike share with no station before any station-level analysis.
- Rounded coordinates have one or two decimals, never more; anything with more came from a station.
- Apply the one-minute rule to every bike type if comparing cities.
- Look at the longest trips to find each system's rental cap — and the trips that escape it.
- Times are local and unzoned. Comparing cities in different time zones by clock hour is fine; by instant it is not.
- File names and zip contents differ (
.csv.zipagainst.zip, Jersey City'sJC-prefix, macOS__MACOSXentries). Find the CSV inside each zip rather than guessing its name.
Internal links
- How to clean a year of bike-share trip data — the cleaning rules these differences call for
- How to read a GBFS bike-share feed — the live side of the same systems
- Dockless e-bike trips pile up on a grid — the rounded coordinates in detail
- Bike-share trips with negative durations — what unzoned timestamps do twice a year
FAQ
Do Divvy, Citi Bike, Bluebikes, Bay Wheels and Capital Bikeshare use the same data format?
Their current trip files have the same thirteen columns: ride_id, rideable_type, started_at, ended_at, start and end station name and id, start and end latitude and longitude, and member_casual. The rules behind the columns — dockless e-bikes, coordinate rounding, short-trip filtering, rental caps — differ.
Why do some bike-share trips have no start station?
Because the system lets e-bikes start or end away from a dock. In June 2025 that was 48.1% of e-bike trips in Washington, 35.5% in Chicago and practically none in Boston and Jersey City, where e-bikes stay docked.