
How Much Rain and Cold Cut Bike-Share Ridership: A Daily Model in Python
On this page
Problem statement
Everyone who runs a bike-share system knows that rain empties it. How much, though? A wet day in Washington, D.C. is also more likely to be a cool one, wet months differ from dry ones, and a rainy Saturday loses different riders from a rainy Tuesday. A scatter of trips against rainfall mixes all of these, and so does the simple comparison of wet and dry days.
This page joins Capital Bikeshare's 365 days of 2025 to the daily weather observed at Reagan National Airport and fits a model that separates rain, snow on the ground and temperature from the season and the day of the week. It then reads the days the model gets wrong, because they are where the calendar, not the weather, decided how many people rode.
Quick answer
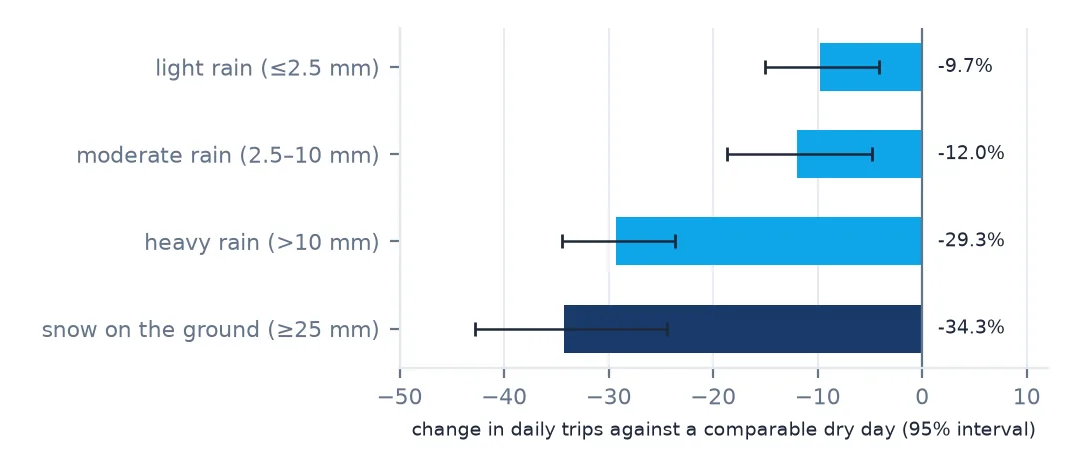
Count trips per day, join the station's rain, snow depth and maximum temperature, and regress the log of trips on rain classes, snow cover, a quadratic in temperature, the type of day and the month. Exponentiated coefficients are percentage changes:
GHCN-Daily stores precipitation in tenths of a millimetre, temperature in tenths of a degree, and snowfall and snow depth in millimetres, each with an attribute string whose second field is a quality flag. Drop flagged values before converting:
import statsmodels.formula.api as smf

day = trips.groupby(trips.started_at.dt.normalize()).size().rename("trips")
wx = pd.read_csv("data/USW00013743.csv", parse_dates=["DATE"], index_col="DATE", low_memory=False).loc["2025"]
d = pd.DataFrame({"trips": day, "rain_mm": wx.PRCP / 10, "tmax": wx.TMAX / 10, "snow_cover": wx.SNWD >= 25})
d["rain"] = pd.cut(d.rain_mm, [-1, 0, 2.5, 10, 1000], labels=["dry", "light", "moderate", "heavy"])
d["daytype"] = np.where(d.index.isin(HOLIDAYS) | (d.index.dayofweek >= 5), "weekend", "working")
d["month"] = d.index.month
fit = smf.ols("np.log(trips) ~ C(rain, Treatment('dry')) + snow_cover + tmax + I(tmax ** 2) + C(daytype) + C(month)",
              data=d).fit()
effect = (np.exp(fit.params.filter(regex="rain|snow")) - 1) * 100
print(effect.round(1).rename(lambda k: k.split("[T.")[-1].rstrip("]").replace("True", "snow on the ground")).to_string())
print(f"R² {fit.rsquared:.2f} over {int(fit.nobs)} days")
light -9.7
moderate -12.0
heavy -29.3
snow on the ground -34.3
R² 0.80 over 365 days
Fourteen days have no snow-depth reading. Eleven days had 25 mm or more of snow on the ground, all in winter, and maximum temperatures ranged from −4.3 °C to 37.2 °C.
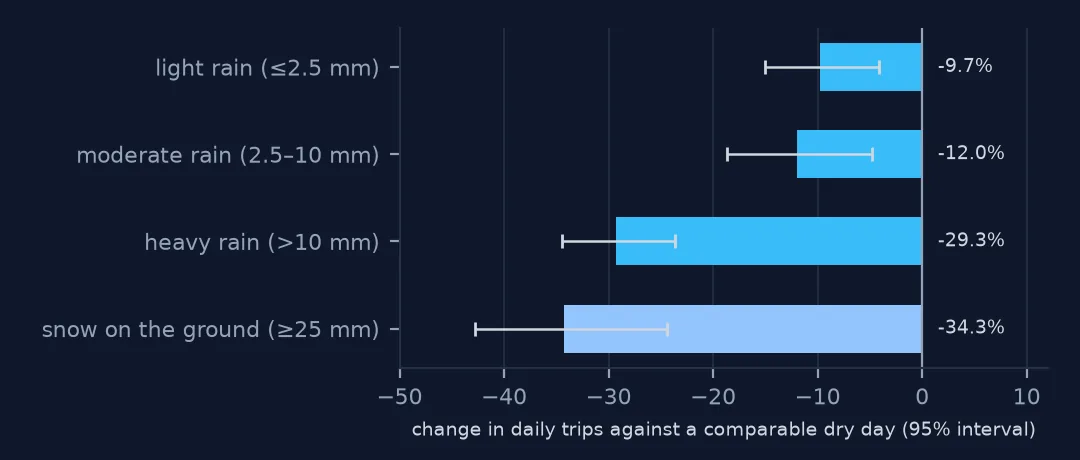
Against a dry day of the same month, temperature and type, a day with more than 10 mm of rain has 29.3% fewer trips, and a day with an inch (25 mm) of snow still on the ground 34.3% fewer. Light rain, up to 2.5 mm, costs about a tenth. Weather, season and the weekday together explain 80% of the day-to-day variation in the log of trips.
From trip counts to a daily model
1. Count trips per day
counts = trips.groupby([trips.started_at.dt.normalize(), "member_casual"]).size().unstack()
counts["trips"] = counts.sum(axis=1)
print(counts.trips.describe().round(0).astype(int).to_string())
count 365
mean 17832
std 5903
min 1798
25% 13644
50% 19589
75% 21996
max 34596
A median day has 19,589 trips; the quietest has 1,798 and the busiest 34,596. That spread of nearly twentyfold is what the model has to explain.
2. Read the weather at Reagan National
wx = pd.read_csv("data/USW00013743.csv", parse_dates=["DATE"], low_memory=False).set_index("DATE").loc["2025"]
for col in ["PRCP", "SNOW", "SNWD", "TMAX"]:
    bad = wx[f"{col}_ATTRIBUTES"].fillna(",,,").str.split(",", expand=True)[1] != ""
    wx[col] = wx[col].where(~bad)
weather = pd.DataFrame({"rain_mm": wx.PRCP / 10, "snow_mm": wx.SNOW, "depth_mm": wx.SNWD, "tmax": wx.TMAX / 10})
print(weather.describe().round(1).to_string())
print(f"{weather.isna().sum().sum()} missing or flagged values; {(weather.depth_mm >= 25).sum()} days with 25 mm or more of snow on the ground")
rain_mm snow_mm depth_mm tmax
count 365.0 365.0 351.0 365.0
mean 2.5 1.1 3.0 19.9
std 6.6 12.5 18.0 9.9
min 0.0 0.0 0.0 -4.3
25% 0.0 0.0 0.0 12.2
50% 0.0 0.0 0.0 21.7
75% 0.8 0.0 0.0 28.3
max 45.0 183.0 150.0 37.2
14 missing or flagged values; 11 days with 25 mm or more of snow on the ground
3. Join and look before modelling
daily = counts.join(weather, how="inner")
daily["rain"] = pd.cut(daily.rain_mm, [-1, 0, 2.5, 10, 1000], labels=["dry", "light", "moderate", "heavy"])
daily["daytype"] = np.where(daily.index.isin(HOLIDAYS) | (daily.index.dayofweek >= 5), "weekend", "working")
daily["month"] = daily.index.month
daily["snow_cover"] = daily.depth_mm >= 25
print(daily.groupby("rain", observed=True).agg(days=("trips", "size"), median_trips=("trips", "median")).to_string())
print(f"Spearman rho, trips vs maximum temperature: {daily.trips.corr(daily.tmax, method='spearman'):.2f}")
days median_trips
rain
dry 249 20288.0
light 54 18288.0
moderate 30 17376.5
heavy 32 15894.0
Spearman rho, trips vs maximum temperature: 0.77
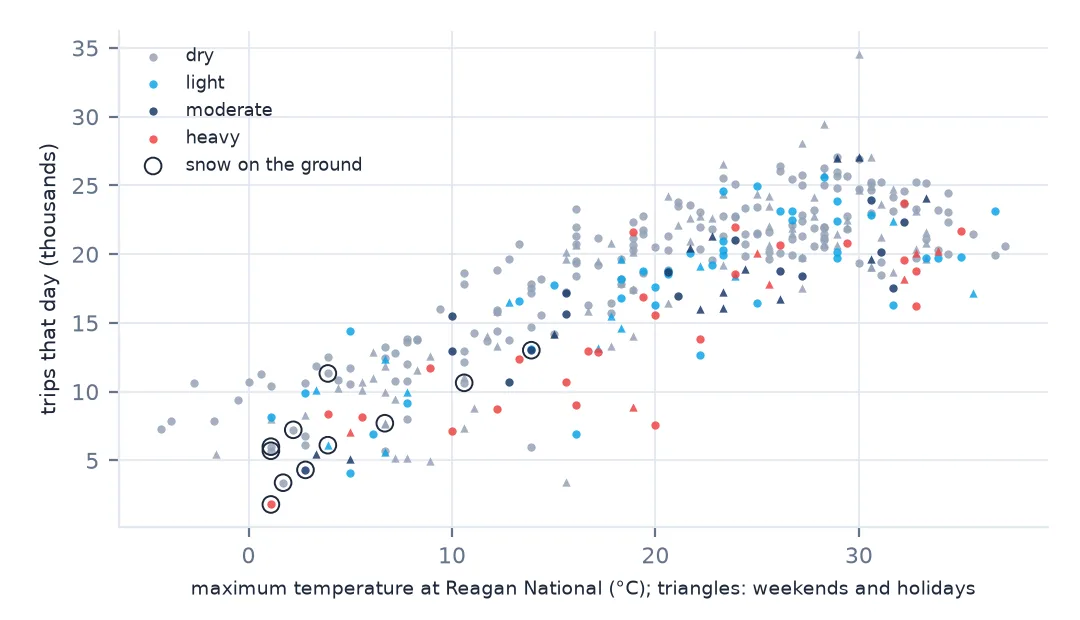
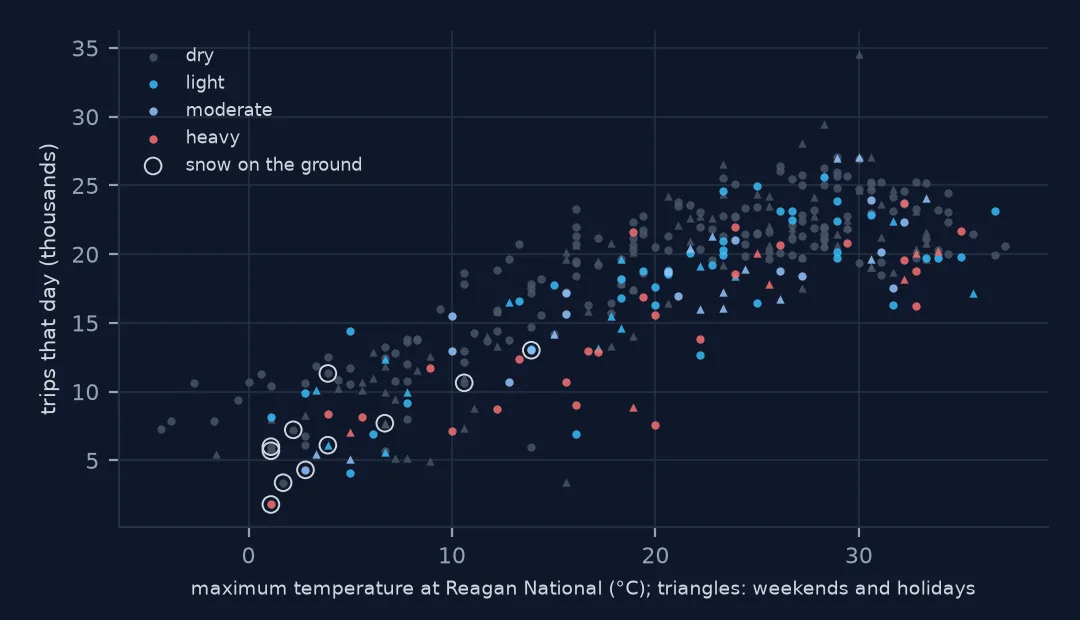
The raw comparison already shows rain mattering — the median heavy-rain day has 15,894 trips against 20,288 on dry days — but temperature matters more (a rank correlation of 0.77 with trips), and the wettest months are not the coldest. The model is what keeps the two apart.
4. Fit the model
model = smf.ols("np.log(trips) ~ C(rain, Treatment('dry')) + snow_cover + tmax + I(tmax ** 2) + C(daytype) + C(month)",
                data=daily).fit()
print(model.params.filter(regex="rain|snow|tmax|daytype").round(4).to_string())
best_t = -model.params["tmax"] / (2 * model.params["I(tmax ** 2)"])
print(f"trips peak at a maximum of {best_t:.1f} °C, other things equal")
C(rain, Treatment('dry'))[T.light] -0.1025
C(rain, Treatment('dry'))[T.moderate] -0.1276
C(rain, Treatment('dry'))[T.heavy] -0.3464
snow_cover[T.True] -0.4195
C(daytype)[T.working] 0.0831
tmax 0.0452
I(tmax ** 2) -0.0005
trips peak at a maximum of 41.3 °C, other things equal
The coefficients are on the log scale: −0.346 for heavy rain is the 29.3% above. Once weather and month are fixed, working days are busier than weekends (a coefficient of 0.0831). The temperature curve still rises at the hottest day of 2025: its turning point, 41.3 °C, is beyond anything the station recorded, so within this year's weather, warmer always meant busier.
5. Members and casual riders
for who in ["member", "casual"]:
    m = smf.ols(f"np.log({who}) ~ C(rain, Treatment('dry')) + snow_cover + tmax + I(tmax ** 2) + C(daytype) + C(month)",
                data=daily).fit()
    e = (np.exp(m.params.filter(like="rain")) - 1) * 100
    print(f"{who:7s} light {e.iloc[0]:+.0f}%  moderate {e.iloc[1]:+.0f}%  heavy {e.iloc[2]:+.0f}%")
member light -8% moderate -10% heavy -27%
casual light -12% moderate -17% heavy -35%
Casual riders are more sensitive at every level of rain: heavy rain costs them 35% against members' 27%. A member riding to work has fewer alternatives than a visitor deciding whether to tour the Mall by bike.
Reading the residuals
The data used on this page
Capital Bikeshare system data, the twelve monthly trip files for 2025, cleaned as in how to clean a year of bike-share trip data. Weather is NOAA NCEI GHCN-Daily for Washington Reagan National Airport (USW00013743): daily precipitation, snowfall and maximum temperature, with quality-flagged values removed. The station file grows daily; the values used here are for 2025, read in October 2026.
from pathlib import Path
import zipfile

import numpy as np
import pandas as pd
import requests
from pandas.tseries.holiday import USFederalHolidayCalendar

Path("data").mkdir(exist_ok=True)
MONTHS = [f"2025{m:02d}" for m in range(1, 13)]
for m in MONTHS:
    f = Path(f"data/{m}-capitalbikeshare-tripdata.zip")
    if not f.exists():
        f.write_bytes(requests.get(f"https://s3.amazonaws.com/capitalbikeshare-data/{f.name}", timeout=600).content)
f = Path("data/USW00013743.csv")
if not f.exists():
    f.write_bytes(requests.get("https://www.ncei.noaa.gov/data/global-historical-climatology-network-daily/access/"
                               "USW00013743.csv", timeout=300).content)


def read_month(m):
    with zipfile.ZipFile(f"data/{m}-capitalbikeshare-tripdata.zip") as z, z.open(f"{m}-capitalbikeshare-tripdata.csv") as fh:
        return pd.read_csv(fh, dtype={"start_station_id": "Int64", "end_station_id": "Int64"},
                           parse_dates=["started_at", "ended_at"])


trips = pd.concat([read_month(m) for m in MONTHS], ignore_index=True)
trips["minutes"] = (trips.ended_at - trips.started_at).dt.total_seconds() / 60
trips = trips[(trips.started_at >= "2025-01-01") & (trips.minutes >= 1) & trips.end_lat.notna()].reset_index(drop=True)
HOLIDAYS = USFederalHolidayCalendar().holidays("2025-01-01", "2025-12-31")
print(f"{len(trips):,} clean trips")
6,508,775 clean trips
Example 1: the days the model gets most wrong
daily["fitted"] = np.exp(model.fittedvalues)
daily["ratio"] = daily.trips / daily.fitted
cols = ["trips", "fitted", "ratio", "rain_mm", "depth_mm", "tmax"]
print("busier than the weather predicts:")
print(daily.nlargest(5, "ratio")[cols].round(2).to_string())
print("quieter than the weather predicts:")
print(daily.nsmallest(5, "ratio")[cols].round(2).to_string())
busiest = daily.trips.idxmax()
on_day = trips[trips.started_at.dt.normalize() == busiest].start_station_name.value_counts()
usual = trips[trips.started_at.dt.dayofweek == 5].start_station_name.value_counts() / 52
print(f"\n{busiest:%a %d %b}: starts against an average Saturday")
cmp = pd.DataFrame({"that day": on_day, "average Saturday": usual}).dropna()
cmp["extra"] = cmp["that day"] - cmp["average Saturday"]
print(cmp.nlargest(5, "extra").round(0).astype(int).to_string())
busier than the weather predicts:
trips fitted ratio rain_mm depth_mm tmax
started_at
2025-01-14 11327 6362.93 1.78 0.0 30.0 3.9
2025-12-06 12369 7700.83 1.61 0.5 0.0 6.7
2025-12-09 11266 7210.69 1.56 0.0 0.0 0.6
2025-12-12 12509 8302.83 1.51 0.0 0.0 3.9
2025-03-29 34596 23921.79 1.45 0.0 NaN 30.0
quieter than the weather predicts:
trips fitted ratio rain_mm depth_mm tmax
started_at
2025-12-25 3399 11444.54 0.30 0.0 0.0 15.6
2025-11-27 4938 11452.65 0.43 0.0 0.0 8.9
2025-01-06 1798 3995.48 0.45 20.6 130.0 1.1
2025-05-13 7557 15827.78 0.48 40.1 0.0 20.0
2025-11-28 5671 11480.22 0.49 0.0 0.0 6.7
Sat 29 Mar: starts against an average Saturday
that day average Saturday extra
start_station_name
Hains Point/Buckeye & Ohio Dr SW 347 35 312
Jefferson Memorial 321 73 248
Ohio Dr & West Basin Dr SW / MLK & FDR Memorials 270 33 237
Henry Bacon Dr & Lincoln Memorial Circle NW 274 78 196
Smithsonian-National Mall / Jefferson Dr & 12th St SW 259 77 182
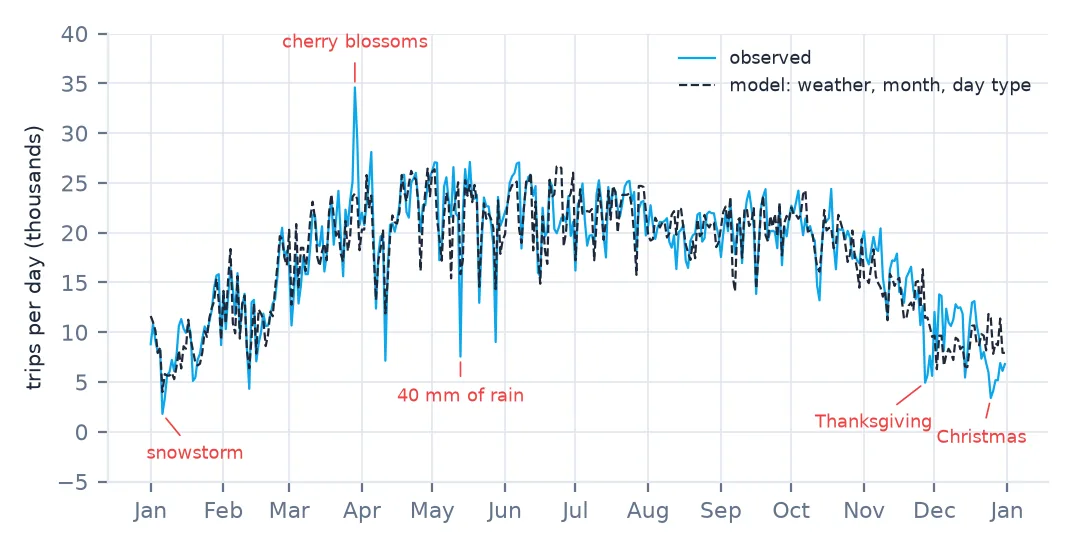
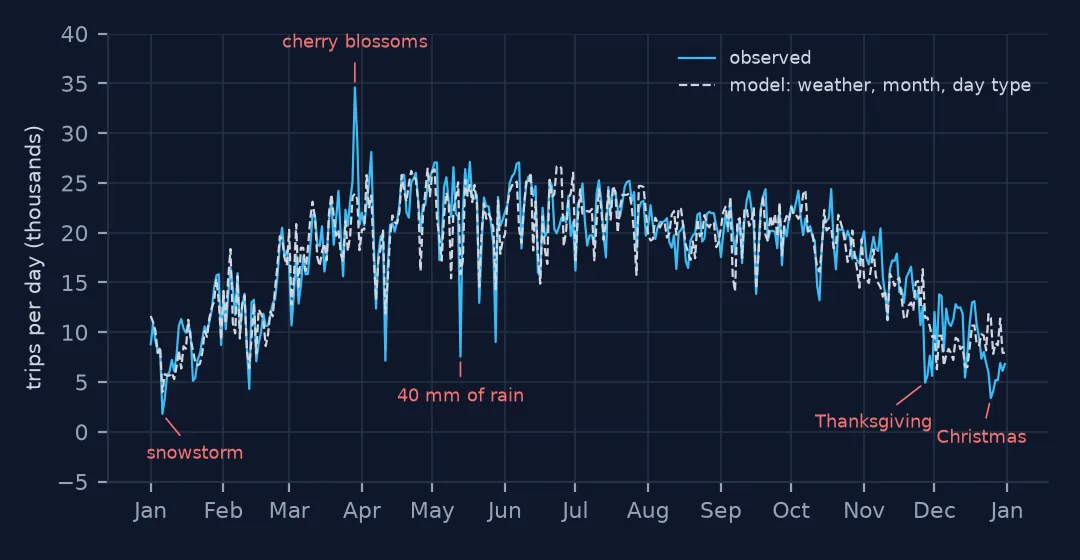
Every one of the largest misses has a reason the weather columns cannot carry. Christmas Day (30% of the predicted trips), Thanksgiving and the day after are holidays the model treats as ordinary weekend days. 13 May had 40.1 mm of rain, four times the threshold of the "heavy" class, which treats it like an 11 mm day. On the busy side, 14 January still had 30 mm of snow on the ground but clear roads and sun, so a yes/no snow flag overstated the loss. Three early-December days are busy because the December effect averages them with the near-empty holiday weeks. And 29 March, the busiest day of the year, was the cherry-blossom weekend: the stations around the Tidal Basin and the Mall started up to ten times their usual Saturday trips.
Example 2: does rain yesterday matter today?
Wet roads and forecasts carry over, so yesterday's rain might matter too:
daily["rain_yesterday"] = daily.rain_mm.shift(1) > 10
lag = smf.ols("np.log(trips) ~ C(rain, Treatment('dry')) + rain_yesterday + snow_cover + tmax + I(tmax ** 2) + C(daytype) + C(month)",
              data=daily.dropna(subset=["rain_mm"])).fit()
print(f"after a day with over 10 mm: {(np.exp(lag.params['rain_yesterday[T.True]']) - 1) * 100:+.1f}% "
      f"(p = {lag.pvalues['rain_yesterday[T.True]']:.2f})")
after a day with over 10 mm: +1.2% (p = 0.77)
It does not: a day after more than 10 mm of rain is within a percent of any other day, and the estimate is indistinguishable from zero (p = 0.77). In D.C. the effect of rain is confined to the day it falls.
Why a log model with fixed effects
Rain removes a share of riders, not a number of them: a wet July day loses more trips than a wet January day because there are more to lose. Modelling the log of trips makes every coefficient a percentage and lets one rain effect hold across the year. Month and day-type terms ("fixed effects") absorb everything that differs between, say, March and November that is not today's weather — daylight, tourists, university terms — so that rain is compared with dry days of the same kind.
Temperature enters as a curve because its effect cannot be monotonic for ever; in D.C.'s 2025 the curve never turned. The rain classes are categories rather than a straight line in millimetres because the first drops do most of the damage: a forecast of rain, and a wet seat, stop people regardless of how much falls later. The cost of that choice shows in the residuals: the class boundaries are arbitrary, and the heaviest days sit in the same bin as days four times drier.
A model at this resolution says nothing about hours. A day with 15 mm of rain at 4 a.m. and a day with 15 mm at 5 p.m. are the same row. Hourly precipitation from the airport's METAR reports, or from a reanalysis, would let the rain coincide with the trips it stopped.
One station, one year, daily totals
- One weather station for a whole system. Reagan National is on the river south of the city; summer storms can soak Columbia Heights and leave the airport dry.
- Daily totals blur timing. Night-time rain counts the same as rush-hour rain.
- Snow is better as depth than as snowfall. The trips stay away while snow lies on the ground, not just on the day it falls — and come back once roads clear even if the gauge still reads 30 mm.
- Holidays and events are not weather. Add them to the model or expect them at the top of the residuals.
- Missing station days. GHCN-Daily has gaps; an inner join silently drops days, so count them.
Internal links
- How to clean a year of bike-share trip data — the trips this page counts
- How to separate commuting from leisure in bike-share trips — who rides on which days
- How to analyse snow depth from GHCN-Daily — reading the same station files and their flags
FAQ
How much does rain reduce bike-share trips?
In Washington, D.C. in 2025, a day with more than 10 mm of rain had 29.3% fewer Capital Bikeshare trips than a comparable dry day; light rain cost 9.7%.
Are casual riders more affected by rain than members?
Yes. Heavy rain cut casual riders' trips by 35% and members' by 27% in the same model.