
How to Clean a Year of Bike-Share Trip Data in Python
On this page
Problem statement
Capital Bikeshare, the system in Washington, D.C., publishes every trip its bikes make: one CSV a month, 6.66 million rows for 2025. The files are tidy at a glance. Underneath are trips that end before they start, a few thousand bikes that were taken and never docked again, 149,306 e-bike rentals that lasted under a minute, and more than a third of e-bike trips with no station at all. Each of these moves a different statistic: the mean trip length, the busiest station, the share of round trips.
This page reads all twelve 2025 files into one table, measures each problem on the full year, and decides for each one whether to drop the rows, flag them, or keep them as they are.
Quick answer
Compute a duration, name each rule as a boolean mask, report how many rows each one catches, and drop the union:
t = trips.assign(minutes=(trips.ended_at - trips.started_at).dt.total_seconds() / 60)
rules = {
    "started in 2024": t.started_at < "2025-01-01",
    "ends before it starts": t.minutes < 0,
    "under a minute": t.minutes.between(0, 1, inclusive="left"),
    "never returned (no end location)": t.end_lat.isna(),
}
flags = pd.DataFrame(rules)
for name, mask in rules.items():
    print(f"{name:34s} {mask.sum():>8,}")
clean = t[~flags.any(axis=1)]
print(f"kept {len(clean):,} of {len(t):,} trips ({len(clean) / len(t):.2%}); dropped {len(t) - len(clean):,}")
started in 2024 36
ends before it starts 35
under a minute 149,306
never returned (no end location) 4,497
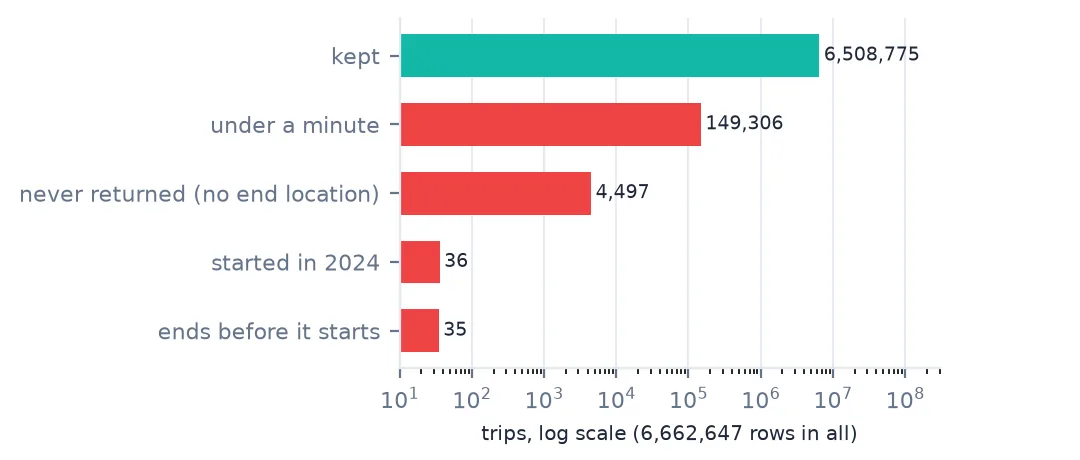
kept 6,508,775 of 6,662,647 trips (97.69%); dropped 153,872
Four rules remove 153,872 trips and keep 97.69% of the year; almost all of them are e-bike rentals shorter than a minute. Three other problems on this page are kept on purpose: an e-bike trip without a station is a real trip, a long ride is a long ride, and a renamed station is the same dock.
Six checks on 6.66 million trips
1. See what a row is
Every row is one rental: a bike type, a start and end time, a start and end station when there was one, coordinates, and whether the rider was a member or a casual user. The first thing to know is how many rows have a station at each end, because the e-bikes do not need one:
at = trips.start_station_id.notna().map({True: "from a station", False: "no station"})
print(pd.crosstab(trips.rideable_type, at, margins=True).to_string())
print(f"\n{trips.member_casual.value_counts(normalize=True)['member']:.1%} of trips by members")
start_station_id from a station no station All
rideable_type
classic_bike 2412746 0 2412746
electric_bike 2739959 1509942 4249901
All 5152705 1509942 6662647
71.0% of trips by members
Classic bikes always start at a dock; 1,509,942 e-bike trips — 36% of them — start somewhere else and carry only coordinates. Anything keyed on a station id, a station ranking, a station-to-station matrix, silently leaves those trips out.
2. Look at both tails of the duration
A duration is two timestamps subtracted. Its quantiles show the problems before any rule is written:
print(t.minutes.quantile([0, 0.001, 0.01, 0.5, 0.99, 0.999, 1]).round(2).to_string())
print(f"{(t.minutes < 0).sum()} negative, {(t.minutes < 1).sum():,} under a minute, "
      f"{(t.minutes > 24 * 60).sum():,} over a day")
0.000 -56.53
0.001 0.03
0.010 0.30
0.500 9.24
0.990 84.39
0.999 765.13
1.000 1559.95
35 negative, 149,341 under a minute, 4,675 over a day
The median trip is nine minutes. The tails are the problem: the shortest trip is minus 56 minutes, a tenth of a percent of trips last under two seconds, and the longest lasts 1,560 minutes, a little over a day. Each tail turns out to have a single cause.
3. Trips that end before they start
neg = t[t.minutes < 0]
print(neg.started_at.dt.strftime("%Y-%m-%d %H:00").value_counts().to_string())
print(neg[["started_at", "ended_at", "minutes"]].head(3).round(1).to_string(index=False))
started_at
2025-11-02 01:00 35
started_at ended_at minutes
2025-11-02 01:54:55.159 2025-11-02 01:01:01.811 -53.9
2025-11-02 01:55:17.707 2025-11-02 01:01:04.969 -54.2
2025-11-02 01:59:23.976 2025-11-02 01:24:07.870 -35.3
All 35 start between 01:00 and 02:00 on 2 November 2025, the night the clocks went back. The timestamps are local wall-clock time with no offset, so a ride that starts at 01:55 daylight time and ends at 01:01 standard time looks as if it ended 54 minutes before it began. Bike-share trips with negative durations repairs them instead of dropping them; here they are dropped, because 35 trips change nothing else.
4. Trips under a minute
short = t[t.minutes.between(0, 1, inclusive="left")]
print(short.rideable_type.value_counts().to_string())
classic = t[(t.rideable_type == "classic_bike") & (t.minutes >= 0)]
print(f"shortest classic-bike trip: {classic.minutes.min() * 60:.1f} s")
same_dock = (short.start_station_id == short.end_station_id).fillna(False)
both = short.start_station_id.notna() & short.end_station_id.notna()
neither = short.start_station_id.isna() & short.end_station_id.isna()
where = np.select([same_dock, both, neither], ["same dock", "two different docks", "no station at either end"],
                  "a dock at one end only")
print(pd.Series(where).value_counts().to_string())
still = (short.start_lat == short.end_lat) & (short.start_lng == short.end_lng)
print(f"{still.mean():.0%} start and end at the same coordinates")
rideable_type
electric_bike 149306
shortest classic-bike trip: 60.1 s
no station at either end 90120
a dock at one end only 32466
same dock 25690
two different docks 1030
74% start and end at the same coordinates
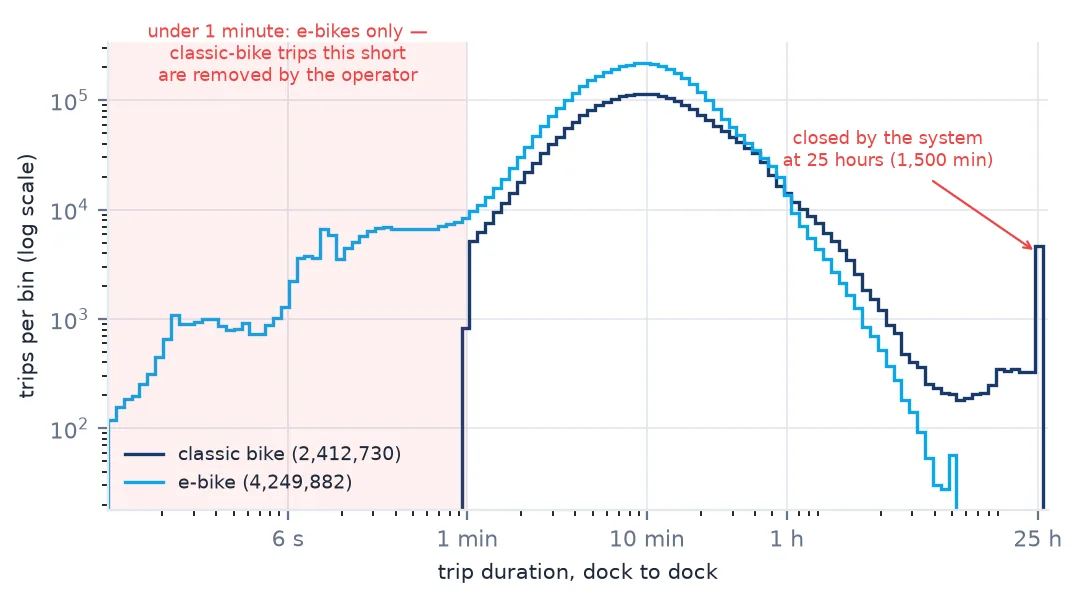
Every one of the 149,306 trips under a minute is an e-bike, and the shortest classic-bike trip lasts 60.1 seconds. Capital Bikeshare's system data page says trips under 60 seconds are removed as "potentially false starts or users trying to re-dock a bike". The files show that rule applied to the docked classic bikes and not to the e-bikes. Most of these e-bike trips never touch a dock (90,120 have no station at either end), and 74% end at exactly the coordinates they started from: a rider unlocked a bike, changed their mind or found it faulty, and locked it again. A rule written as "same dock, under a minute" — the obvious one for a docked system — catches only 25,690 of them. Applying the operator's own one-minute rule to both bike types makes the two comparable.
5. Bikes that never came back
lost = t[t.end_lat.isna()]
print(lost.rideable_type.value_counts().to_string())
print(f"median {lost.minutes.median():,.1f} min; {lost.minutes.between(1499, 1501).mean():.0%} "
      f"within a minute of 1,500")
print("longest trip by bike type, minutes:", t.groupby("rideable_type").minutes.max().round(1).to_dict())
rideable_type
classic_bike 4497
median 1,499.9 min; 98% within a minute of 1,500
longest trip by bike type, minutes: {'classic_bike': 1560.0, 'electric_bike': 480.0}
Every trip with no end location is a classic bike, and 98% of them end within a minute of 1,500 minutes — 25 hours. That is not how long people rode; it is when the system gives up on an unreturned bike and closes the rental. E-bike rentals have a different limit: none runs past 480 minutes, eight hours. Left in, these 4,497 classic-bike rows add 1,500 minutes each to every mean. Bike-share trips that last 25 hours follows them up.
6. Station ids that changed name
names = trips.dropna(subset=["start_station_id"]).groupby("start_station_id").start_station_name.unique()
renamed = names[names.str.len() > 1]
print(f"{len(renamed)} of {len(names)} station ids carry two names in 2025, for example:")
for sid, n in renamed.head(3).items():
    print(f"  {sid}: {' / '.join(n)}")
moved = (trips[trips.start_station_id == 31232].groupby("start_station_name")
         .agg(trips=("ride_id", "size"), lat=("start_lat", "median"), lng=("start_lng", "median"),
              last=("started_at", "max")))
print(moved.assign(last=moved["last"].dt.date).round(5).to_string())
10 of 839 station ids carry two names in 2025, for example:
31070: Arlington Blvd & Fillmore St / Arlington Blvd & N Fillmore St
31097: Saint Asaph St & Madison St / St Asaph St & Madison St
31232: 7th & F St NW / National Portrait Gallery / 9th & F St NW
trips lat lng last
start_station_name
7th & F St NW / National Portrait Gallery 14825 38.89732 -77.02222 2025-11-04
9th & F St NW 1411 38.89693 -77.02394 2025-12-31
Most of the ten are spelling: "Saint" and "St", a street name with or without its "N". Station 31232 is different. Its coordinates move west along F Street from 7th to 9th Street after 4 November: the dock was relocated and kept its id. An analysis that takes one coordinate per station id puts the 1,411 trips since the move two blocks from where they started. Keying stations on id and name together, or taking the coordinates per month, keeps them in place.
What the cleaning changes
The data used on this page
Capital Bikeshare system data, the twelve monthly trip files for 2025 from the operator's public S3 bucket (s3.amazonaws.com/capitalbikeshare-data), published under the Capital Bikeshare data licence agreement. About 259 MB zipped; reading them takes under half a minute.
from pathlib import Path
import zipfile

import numpy as np
import pandas as pd
import requests

Path("data").mkdir(exist_ok=True)
MONTHS = [f"2025{m:02d}" for m in range(1, 13)]
for m in MONTHS:
    f = Path(f"data/{m}-capitalbikeshare-tripdata.zip")
    if not f.exists():
        f.write_bytes(requests.get(f"https://s3.amazonaws.com/capitalbikeshare-data/{f.name}", timeout=600).content)


def read_month(m):
    with zipfile.ZipFile(f"data/{m}-capitalbikeshare-tripdata.zip") as z, z.open(f"{m}-capitalbikeshare-tripdata.csv") as fh:
        return pd.read_csv(fh, dtype={"start_station_id": "Int64", "end_station_id": "Int64"},
                           parse_dates=["started_at", "ended_at"])


trips = pd.concat([read_month(m) for m in MONTHS], ignore_index=True)
print(f"{len(trips):,} trips, first start {trips.started_at.min():%Y-%m-%d %H:%M}, last {trips.started_at.max():%Y-%m-%d %H:%M}")
6,662,647 trips, first start 2024-12-31 19:50, last 2025-12-31 23:53
Example 1: the statistics each rule moves
def summary(df):
    return pd.Series({"trips": len(df), "mean min": df.minutes.mean(), "median min": df.minutes.median(),
                      "round trips": (df.start_station_id == df.end_station_id).mean()})


before, after = summary(t), summary(clean)
print(pd.DataFrame({"raw": before, "clean": after}).round(3).to_string())
raw clean
trips 6662647.000 6508775.000
mean min 15.071 14.390
median min 9.237 9.440
round trips 0.040 0.034
Dropping 153,872 trips of 6.66 million moves the mean trip from 15.1 to 14.4 minutes, mostly through the 4,497 unreturned bikes, and the median from 9.2 to 9.4 minutes, through the short e-bike trips. The share of round trips falls from 4.0% to 3.4%. Which statistic a report quotes decides how much the cleaning mattered: the mean and the median move in opposite directions.
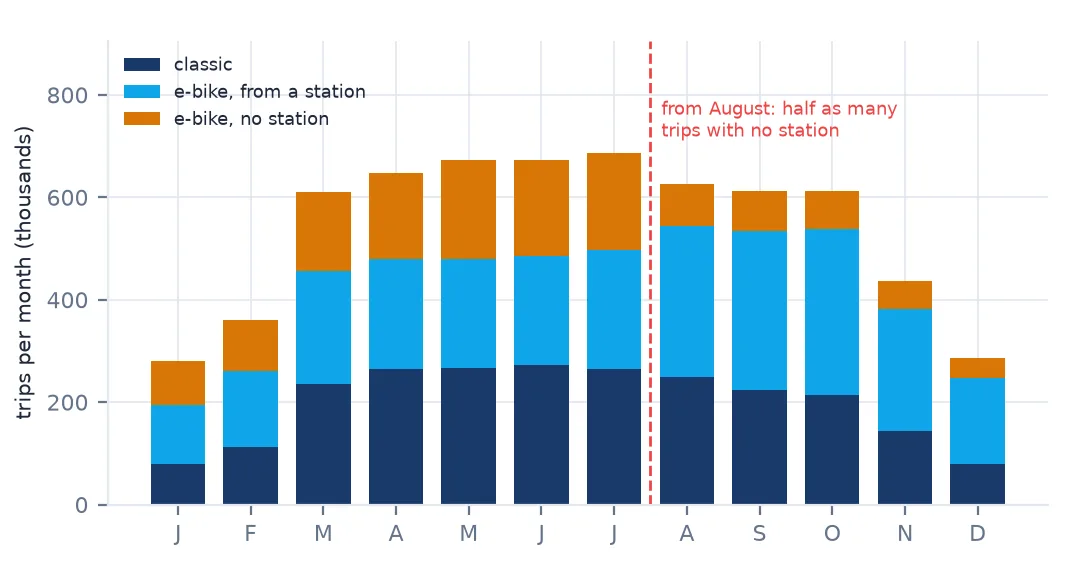
Example 2: monthly totals and the e-bike share
monthly = clean.groupby([clean.started_at.dt.month, "rideable_type"]).size().unstack()
monthly["e-bike share"] = monthly.electric_bike / monthly.sum(axis=1)
monthly["no start station"] = clean.start_station_id.isna().groupby(clean.started_at.dt.month).mean()
print(monthly.round(3).to_string())
rideable_type classic_bike electric_bike e-bike share no start station
started_at
1 78768 200874 0.718 0.302
2 112311 247551 0.688 0.277
3 234686 375660 0.615 0.254
4 264915 382997 0.591 0.261
5 267491 406296 0.603 0.287
6 273391 400265 0.594 0.280
7 265736 420617 0.613 0.276
8 248320 378615 0.604 0.134
9 223676 389320 0.635 0.129
10 214277 398945 0.651 0.123
11 144459 292483 0.669 0.128
12 80197 206925 0.721 0.139
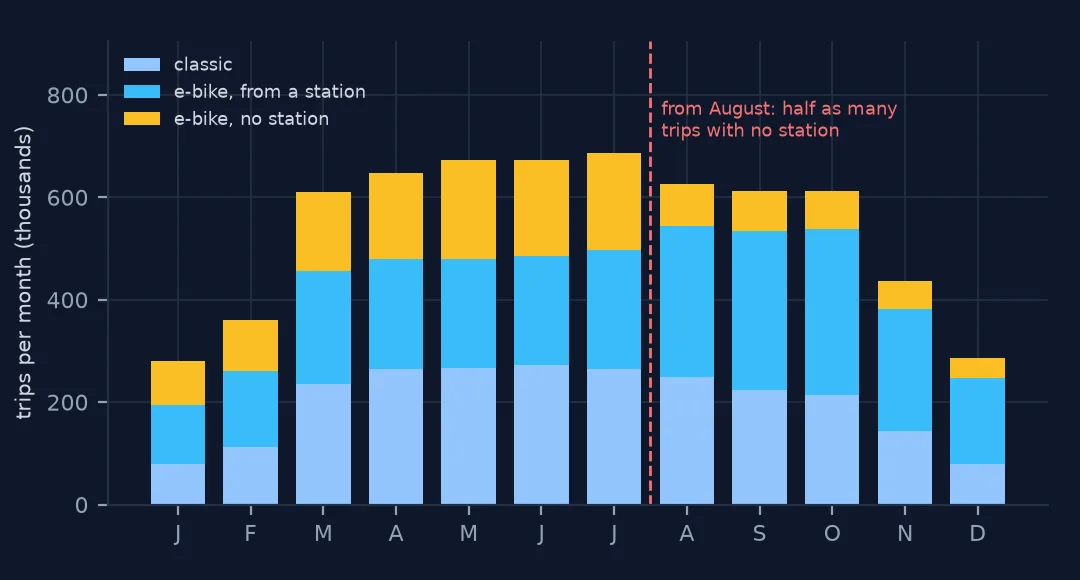
E-bikes carry most of the system's trips all year, and their share rises in winter, from 59% in April to 72% in December and January: classic-bike trips fall to under a third of their June level in January, e-bike trips only to half. The last column has a break in it. Until July, 25–30% of all trips start with no station; from August on, 12–14% do. The files do not say why — a change in how e-bike trips near a dock are assigned to it is the likeliest reading — but any comparison of dockless use across that date compares two recording rules, not two riding habits.
Example 3: save the clean year once
The clean table is read by every later analysis, so it is worth writing once. What makes the file large is not the trips but one column: ride_id is sixteen random hexadecimal characters per row, which no compressor can shrink.
out = clean.drop(columns="minutes")
for c in ["rideable_type", "member_casual", "start_station_name", "end_station_name"]:
    out[c] = out[c].astype("category")
sizes = {}
for label, df, kw in [("as read, snappy", clean.drop(columns="minutes"), {}),
                      ("categories, zstd", out, {"compression": "zstd"}),
                      ("categories, zstd, no ride_id", out.drop(columns="ride_id"), {"compression": "zstd"})]:
    df.to_parquet("data/cabi-2025-clean.parquet", index=False, **kw)
    sizes[label] = Path("data/cabi-2025-clean.parquet").stat().st_size / 1e6
csv_mb = sum(Path(f"data/{m}-capitalbikeshare-tripdata.zip").stat().st_size for m in MONTHS) / 1e6
print(f"zipped CSV, 12 files: {csv_mb:.0f} MB")
for label, mb in sizes.items():
    print(f"{label:30s} {mb:.0f} MB")
zipped CSV, 12 files: 259 MB
as read, snappy 276 MB
categories, zstd 207 MB
categories, zstd, no ride_id 148 MB
The plain Parquet file is larger than the zipped CSVs it came from. Categories for the four repeated text columns and zstd compression bring it to 207 MB; dropping ride_id, which nothing on this page joins on, brings it to 148 MB. Keep the id if the clean table will be joined back to the raw files.
Drop, flag or keep
Each problem above has a cause, and the cause decides what to do with the rows. A rule that cannot name its cause is a filter on the data you did not like.
- Drop what is not a trip: a bike unlocked and locked again inside a minute, a rental the system closed after 25 hours because nobody returned the bike, and a trip filed in the wrong year. None of these describe someone riding somewhere.
- Drop or repair what is a trip recorded wrongly: the 35 trips on the daylight-saving night are real rides with a wrong clock reading. With 35 of 6.66 million, dropping is honest; on a page about one night it would not be.
- Keep and flag what is a trip recorded differently: the 1.5 million e-bike trips without a station, and the change in how many of them there are from August. They belong in every count of trips and in no table keyed on stations.
- Keep and fix the key where the record is right but the identifier is not stable: a station that moved without changing its id.
Writing the rules as named masks, rather than chaining filters, is what makes the report in the quick answer possible: each rule says how many rows it catches on its own, the overlaps are visible, and adding a rule later does not change the meaning of the others.
Things the files do not say
- Timestamps have no time zone. They are Washington wall-clock time, so two nights a year are wrong by an hour: one has a missing hour, the other a repeated one.
- Files are split by end time, not start time. The January file holds 36 trips that started on 31 December 2024; concatenating months and filtering on
started_atis the only safe way to get a calendar year. - The coordinates of an e-bike trip without a station are rounded to two decimal places, roughly a kilometre — see dockless e-bike trips pile up on a grid.
- Station ids survive renames and moves. Check the names per id each time a new month is added.
- The operator's one-minute rule covers classic bikes only. Apply it to e-bikes yourself.
- Duration is dock to dock, not time in motion: a rider who stops for coffee with the bike still out is riding as far as the file knows.
Internal links
- Bike-share trips with negative durations — the daylight-saving night in detail
- Bike-share trips that last 25 hours — the bikes that never came back
- Dockless e-bike trips pile up on a grid — what the missing stations do to coordinates
- Bike-share trip data explained — the same schema in five cities
- How to map bike-share trips as flows — the next step once trips are clean
FAQ
How many Capital Bikeshare trips were there in 2025?
6,662,647 rows in the twelve 2025 files, of which 6,508,775 remain once trips under a minute, unreturned bikes, the daylight-saving night and the 36 trips from 2024 are removed.
Why is the mean trip length so sensitive to cleaning?
Because a few thousand rentals closed at 25 hours sit in a distribution whose median is nine minutes. Removing them and the sub-minute e-bike trips lowers the mean by 0.7 minutes and raises the median by 0.2.