
How to Estimate Bike-Share Trip Distance and Speed in Python
On this page
Problem statement
A bike-share trip file gives two places and two times, so distance and speed look like one line of arithmetic. They are not quite. The straight line between two docks is shorter than any route a bike can take; a trip that ends where it started has no distance at all; an e-bike left on the pavement carries coordinates rounded to a kilometre; and some "trips" are a rider who stopped for lunch with the bike still out. Each of these turns into a speed that describes nothing.
This page measures distance and speed for Capital Bikeshare's 2025 trips in Washington, D.C., decides which trips the measures are valid for, and compares e-bikes with classic bikes on the same routes — which is the only fair comparison, because e-bike riders choose different trips.
Quick answer
Keep trips between two different stations, take the great-circle (haversine) distance between their coordinates, and divide by the duration:
def haversine_km(lat1, lon1, lat2, lon2):
    lat1, lon1, lat2, lon2 = map(np.radians, (lat1, lon1, lat2, lon2))
    a = np.sin((lat2 - lat1) / 2) ** 2 + np.cos(lat1) * np.cos(lat2) * np.sin((lon2 - lon1) / 2) ** 2
    return 2 * 6371.0088 * np.arcsin(np.sqrt(a))


a2b = trips[trips.start_station_id.notna() & trips.end_station_id.notna()
            & (trips.start_station_id != trips.end_station_id)].copy()
a2b["km"] = haversine_km(a2b.start_lat, a2b.start_lng, a2b.end_lat, a2b.end_lng)
a2b["kmh"] = a2b.km / (a2b.minutes / 60)
print(f"{len(a2b):,} station-to-station trips")
print(a2b.groupby(["rideable_type", "member_casual"])[["km", "minutes", "kmh"]].median().round(2).to_string())
4,359,719 station-to-station trips
km minutes kmh
rideable_type member_casual
classic_bike casual 1.59 14.93 7.37
member 1.29 8.28 9.77
electric_bike casual 1.84 9.98 11.91
member 1.85 8.64 13.31
The median member on a classic bike covers 1.29 km in 8.3 minutes, 9.8 km/h in a straight line; on an e-bike, 1.85 km in 8.6 minutes, 13.3 km/h. Members ride shorter and faster than casual riders on both bikes, and the median casual classic-bike trip, at 7.4 km/h, is barely faster than a brisk walk would manage on the same straight line. That is the first sign that a speed computed this way mixes riding with everything else that happens during a rental.
Which distance, which trips
1. Choose the trips a distance means something for
same = (trips.start_station_id == trips.end_station_id).fillna(False)
nostation = trips.start_station_id.isna() | trips.end_station_id.isna()
print(f"round trips: {same.mean():.1%}   a trip end with no station: {nostation.mean():.1%}   "
      f"station to station: {len(a2b) / len(trips):.1%}")
round trips: 2.4% a trip end with no station: 30.7% station to station: 67.0%
Two trips in three can be measured from station to station. Round trips (2.4%) have a distance of zero between their ends, however far they went. The 30.7% with a station missing at one end are e-bike trips whose coordinates are rounded to two decimal places — roughly a kilometre north–south, less east–west — which is as long as the median trip itself. Dockless e-bike trips pile up on a grid shows what that rounding does.
2. One coordinate per station
A station has one location, but every trip records the coordinates again, and e-bikes record their own GPS fix. Comparing each trip end with the station's median position shows how far to trust them:
ends = pd.concat([trips[["start_station_id", "start_lat", "start_lng"]].set_axis(["id", "lat", "lng"], axis=1),
                  trips[["end_station_id", "end_lat", "end_lng"]].set_axis(["id", "lat", "lng"], axis=1)]).dropna()
pos = ends.groupby("id")[["lat", "lng"]].median()
off = haversine_km(ends.lat.values, ends.lng.values, pos.lat.reindex(ends.id).values, pos.lng.reindex(ends.id).values) * 1000
print(f"{len(pos)} stations; {(off > 100).sum():,} of {len(off):,} trip ends lie over 100 m from their station's "
      f"median position, the farthest {off.max() / 1000:.1f} km")
fixed = haversine_km(pos.lat.reindex(a2b.start_station_id).values, pos.lng.reindex(a2b.start_station_id).values,
                     pos.lat.reindex(a2b.end_station_id).values, pos.lng.reindex(a2b.end_station_id).values)
print(f"median trip: {a2b.km.median():.3f} km from the recorded coordinates, {np.median(fixed):.3f} km between station positions")
839 stations; 10,010 of 10,164,752 trip ends lie over 100 m from their station's median position, the farthest 16.6 km
median trip: 1.584 km from the recorded coordinates, 1.584 km between station positions
Only 10,010 of 10.2 million trip ends are more than 100 m from their station, though one is 16.6 km away — a GPS fix gone wrong on an e-bike that the system still filed at its dock. Using station positions instead of trip coordinates leaves the median trip unchanged at 1.584 km, so the outliers do not move the totals, but station positions are what keep a single bad fix from producing a 100 km/h trip.
3. Straight line against the street network
A rider cannot follow the straight line. Without routing every trip on the street network, the Manhattan distance — east–west plus north–south — gives an upper bound for a grid city like D.C.:
grid = haversine_km(a2b.start_lat, a2b.start_lng, a2b.start_lat, a2b.end_lng) + \
       haversine_km(a2b.start_lat, a2b.end_lng, a2b.end_lat, a2b.end_lng)
print(f"Manhattan distance / straight line, median: {(grid / a2b.km).median():.2f}")
Manhattan distance / straight line, median: 1.28
The grid route is a median 28% longer than the straight line. Real routes lie between the two, using the avenues that cut the grid diagonally, so the true speeds are somewhere between the straight-line speeds on this page and about a quarter more.
4. Remove the trips that were not a ride from A to B
ride = a2b[a2b.kmh.between(0, 40)]
loop = ride.kmh < 3
print(f"over 40 km/h: {(a2b.kmh > 40).sum():,}   under 3 km/h: {loop.sum():,} ({loop.mean():.1%})")
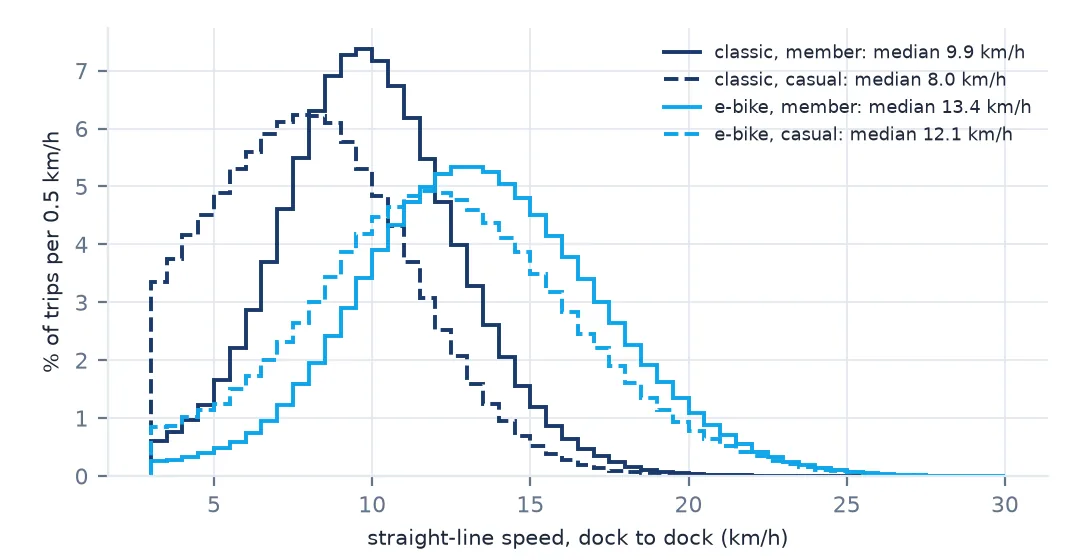
print(ride[~loop].groupby(["rideable_type", "member_casual"]).kmh.quantile([0.1, 0.5, 0.9]).unstack().round(1).to_string())
over 40 km/h: 35 under 3 km/h: 185,075 (4.2%)
0.1 0.5 0.9
rideable_type member_casual
classic_bike casual 4.4 8.0 12.2
member 6.5 9.9 13.6
electric_bike casual 6.9 12.1 17.6
member 8.8 13.4 18.4
Thirty-five trips claim more than 40 km/h, which no rental bike reaches on average, and are dropped. At the other end, 4.2% of station-to-station trips average under 3 km/h. They are not slow rides: they are detours, errands and sightseeing between two docks, and they are what pulled the casual medians down in the quick answer. Without them the median casual classic-bike trip rises from 7.4 to 8.0 km/h, and the gap between bike types is clear at every percentile: the slowest tenth of e-bike members ride faster than the median casual classic-bike rider.
Speed by distance, route and hour
The data used on this page
Capital Bikeshare system data, the twelve monthly trip files for 2025, cleaned as in how to clean a year of bike-share trip data.
from pathlib import Path
import zipfile

import numpy as np
import pandas as pd
import requests

Path("data").mkdir(exist_ok=True)
MONTHS = [f"2025{m:02d}" for m in range(1, 13)]
for m in MONTHS:
    f = Path(f"data/{m}-capitalbikeshare-tripdata.zip")
    if not f.exists():
        f.write_bytes(requests.get(f"https://s3.amazonaws.com/capitalbikeshare-data/{f.name}", timeout=600).content)


def read_month(m):
    with zipfile.ZipFile(f"data/{m}-capitalbikeshare-tripdata.zip") as z, z.open(f"{m}-capitalbikeshare-tripdata.csv") as fh:
        return pd.read_csv(fh, dtype={"start_station_id": "Int64", "end_station_id": "Int64"},
                           parse_dates=["started_at", "ended_at"])


trips = pd.concat([read_month(m) for m in MONTHS], ignore_index=True)
trips["minutes"] = (trips.ended_at - trips.started_at).dt.total_seconds() / 60
trips = trips[(trips.started_at >= "2025-01-01") & (trips.minutes >= 1) & trips.end_lat.notna()].reset_index(drop=True)
print(f"{len(trips):,} clean trips")
6,508,775 clean trips
Example 1: speed by distance
r = ride[~loop].copy()
r["band"] = pd.cut(r.km, [0, 0.5, 1, 2, 3, 5, 8, 20])
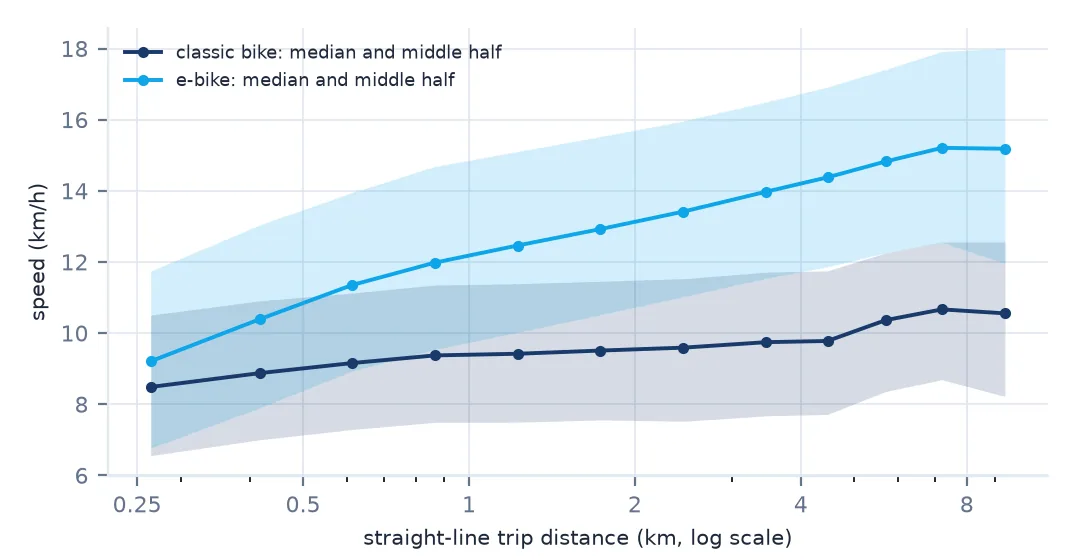
print(r.groupby(["band", "rideable_type"], observed=True).kmh.median().unstack().round(1).to_string())
rideable_type classic_bike electric_bike
band
(0.0, 0.5] 8.6 10.0
(0.5, 1.0] 9.3 11.7
(1.0, 2.0] 9.5 12.7
(2.0, 3.0] 9.6 13.4
(3.0, 5.0] 9.8 14.1
(5.0, 8.0] 10.4 14.9
(8.0, 20.0] 10.4 15.0
Speed rises with distance for both bikes, because the stops at either end weigh less on a long trip. Classic bikes level off near 10.4 km/h above 5 km; e-bikes keep accelerating to 15.0 km/h. On a trip under half a kilometre the two are close, since nobody gets the assist up to speed before arriving.
Example 2: the same route on both bikes
Comparing medians across all trips flatters the e-bike, because e-bike riders take longer trips and longer trips are faster. Holding the route fixed removes that:
pair = r.groupby(["start_station_id", "end_station_id", "rideable_type"]).minutes.agg(["median", "size"]).unstack()
both = pair[(pair[("size", "classic_bike")] >= 30) & (pair[("size", "electric_bike")] >= 30)]
saving = 1 - both[("median", "electric_bike")] / both[("median", "classic_bike")]
print(f"{len(both):,} routes ridden 30+ times on each bike type; e-bike time saving, median {saving.median():.0%}, "
      f"middle half {saving.quantile(0.25):.0%} to {saving.quantile(0.75):.0%}")
10,090 routes ridden 30+ times on each bike type; e-bike time saving, median 23%, middle half 17% to 28%
On 10,090 routes ridden at least 30 times on each type, the e-bike trip is a median 23% shorter in time. A quarter of routes save less than 17%, a quarter more than 28%.
Example 3: speed through the day
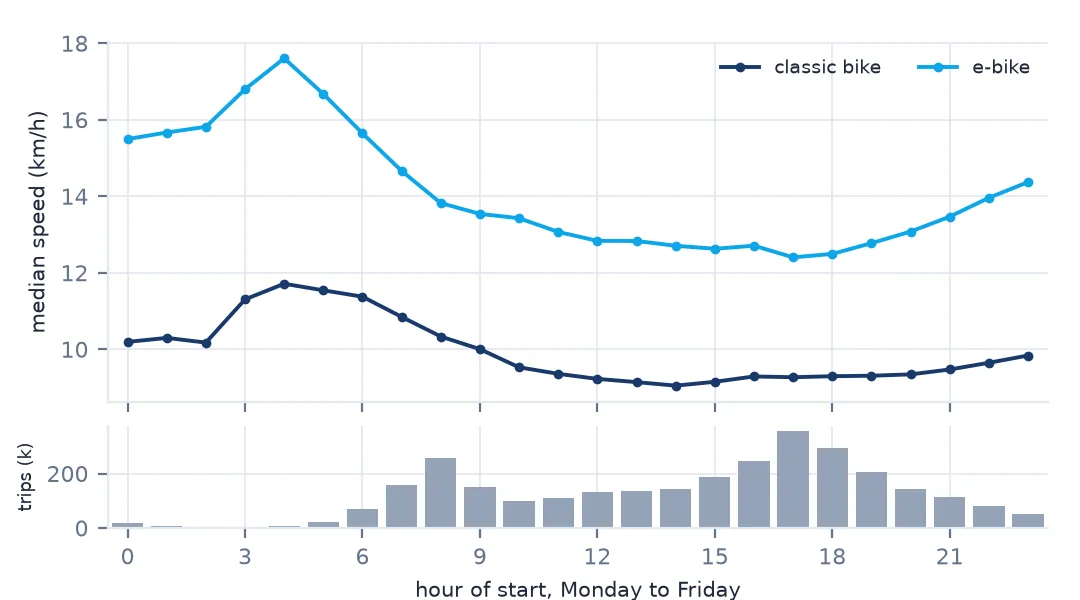
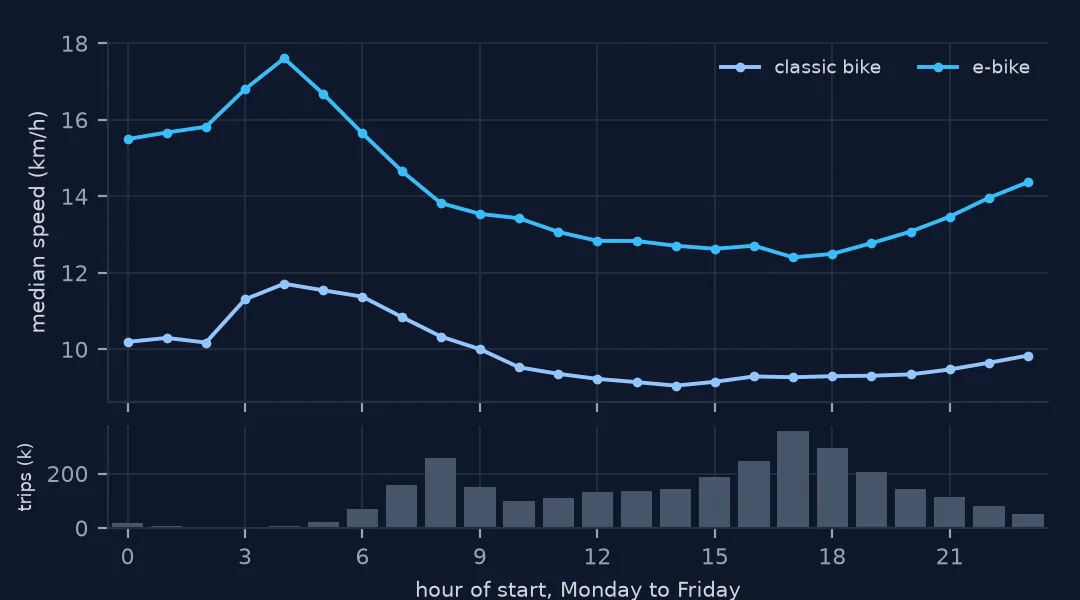
r["hour"] = r.started_at.dt.hour
wk = r[r.started_at.dt.dayofweek < 5]
print(wk.groupby(["hour", "rideable_type"]).kmh.median().unstack().loc[[2, 6, 8, 12, 17, 21]].round(1).to_string())
rideable_type classic_bike electric_bike
hour
2 10.2 15.8
6 11.4 15.6
8 10.3 13.8
12 9.2 12.8
17 9.3 12.4
21 9.5 13.5
Speeds are highest early in the morning — 11.4 km/h on a classic bike at 6 a.m., 15.6–15.8 on an e-bike at 2 and 6 a.m. — and lowest at midday and in the evening peak, when streets are busy and more of the trips are unhurried. The 8 a.m. commute is faster than the 5 p.m. one on both bikes.
What a dock-to-dock speed measures
A trip record's duration runs from unlocking to docking. It includes walking the bike out of the dock, waiting at lights, finding a free dock at the other end, and any stop along the way. Its distance is the shortest possible line between two points that the rider did not ride along. Dividing one by the other gives an effective speed: how fast the system moves a person from one dock to another, which is a useful number for comparing it with walking, transit or a car, and a poor one for estimating how fast people pedal.
The filters on this page are what make that number interpretable. Round trips and dockless trips cannot have a distance, so they are excluded rather than set to zero. Station positions replace per-trip coordinates so that one bad fix cannot invent a fast trip. And the slowest 4% are removed with a rule stated in advance, because they are a different activity, not slow cycling; keeping them would turn a median into a statement about how many people stopped for coffee.
Where the numbers mislead
- Straight-line distance understates the route. The Manhattan bound here is 28% longer; a routed distance on OpenStreetMap would sit between the two.
- E-bike trips without a station have kilometre-scale coordinates. A distance computed from them is noise for short trips.
- One coordinate can be wrong by kilometres. Use station positions, not the coordinates on each row.
- Compare bike types on the same routes. E-bike riders choose longer trips, which are faster for any bike.
- A threshold for "not a ride" is a choice. State it; 3 km/h removed 4.2% of trips here.
Internal links
- How to clean a year of bike-share trip data — the trips measured here
- Dockless e-bike trips pile up on a grid — why trips without a station are left out
- How to calculate haversine distance in Python — the formula and its error
- How to separate commuting from leisure in bike-share trips — who is riding at each hour
FAQ
How fast do bike-share e-bikes go compared with classic bikes?
On Capital Bikeshare in 2025, the median member trip between two stations averaged 13.4 km/h on an e-bike and 9.9 km/h on a classic bike in a straight line, once trips under 3 km/h were removed. On the same routes, the e-bike was a median 23% quicker.
How long is a typical bike-share trip?
The median station-to-station trip was 1.584 km in a straight line, and 28% longer on a Manhattan grid.