
How to Weigh Bridge Condition by Traffic: Daily Crossings on Poor Bridges
On this page
Problem statement
A count of poor bridges treats a farm-road culvert crossed by twenty cars a day the same as an urban Interstate bridge crossed by a quarter of a million. For questions about risk, delay or economic importance, the measure is traffic: how many crossings a day happen on poor bridges. The National Bridge Inventory records average daily traffic (ADT) and the share of trucks for every bridge, though not all counted in the same year. This guide weights condition by traffic for the 2025 inventory and finds the busiest poor bridges — including one figure that cannot be right.
Quick answer
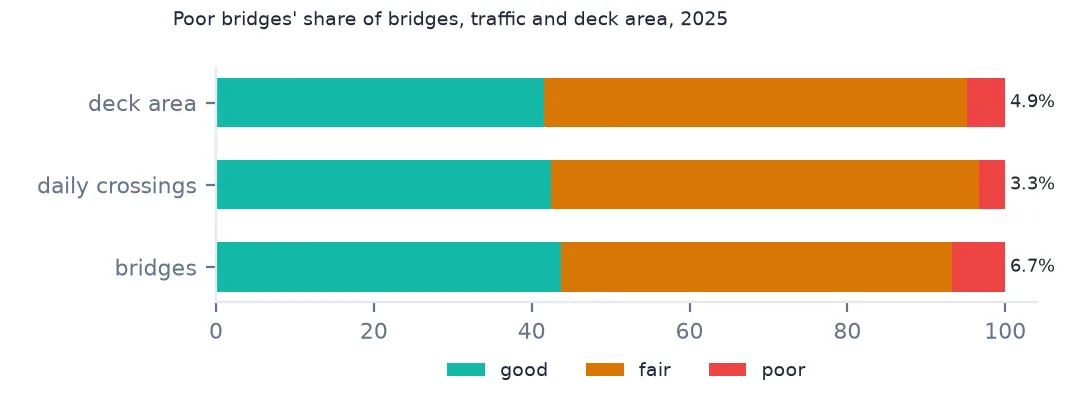
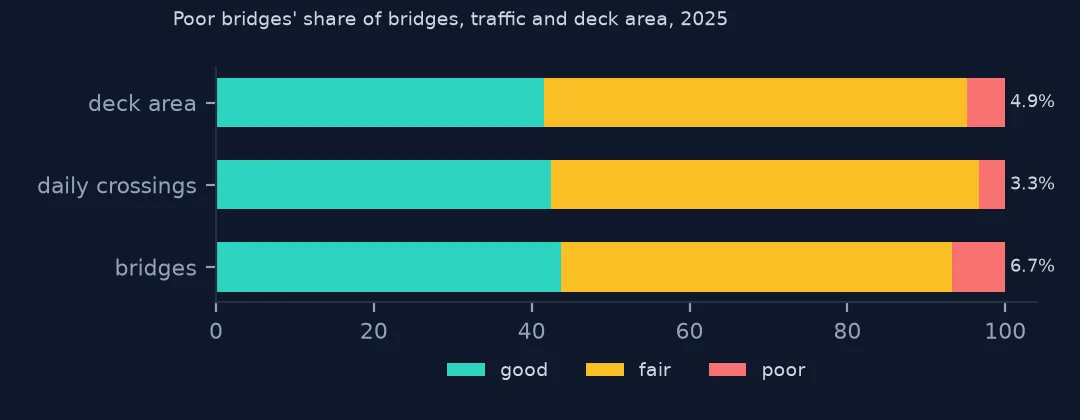
Convert ADT_029 to numbers and sum it by BRIDGE_CONDITION. Poor bridges are 6.7% of bridges but carry 3.3% of daily crossings: they are mostly low-traffic bridges.
x = nbi.groupby("cond").agg(bridges=("adt", "size"), crossings=("adt", "sum"), area=("area", "sum"))
x = x.div(x.sum()).round(3)
print(x.loc[["G", "F", "P"]].to_string())
print(f"daily crossings on poor bridges: {nbi.loc[nbi.cond == 'P', 'adt'].sum() / 1e6:,.1f} million")
bridges crossings area
cond
G 0.437 0.424 0.416
F 0.496 0.543 0.535
P 0.067 0.033 0.049
daily crossings on poor bridges: 163.8 million
Poor bridges are 6.7% of bridges, 4.9% of deck area and 3.3% of daily crossings — 163.8 million vehicle crossings a day. Fair bridges carry the largest share of traffic (54.3%), more than their share of bridges.
Daily traffic on each bridge
1. Average daily traffic on each bridge
print(nbi.adt.describe(percentiles=[0.25, 0.5, 0.75, 0.99]).round(0).to_string())
print(f"bridges carrying fewer than 100 vehicles a day: {(nbi.adt < 100).mean():.1%}")
count 624193.0
mean 8023.0
std 21473.0
min 0.0
25% 125.0
50% 954.0
75% 6400.0
99% 107707.0
max 882085.0
bridges carrying fewer than 100 vehicles a day: 20.2%
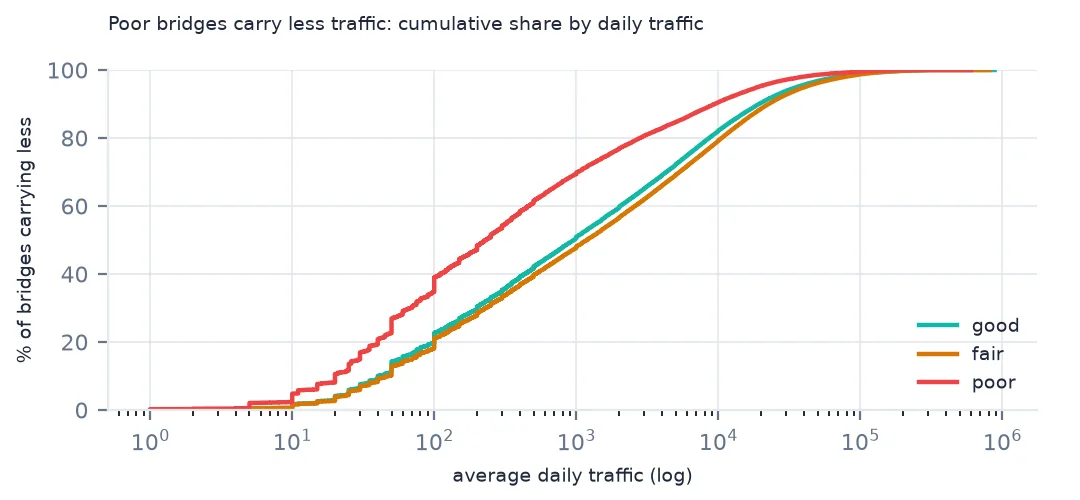
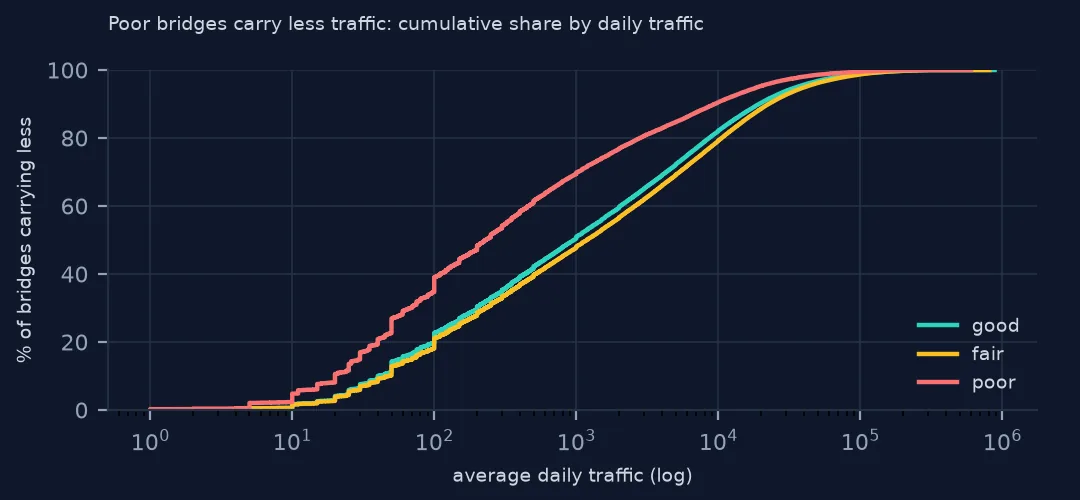
Traffic is extremely skewed: the median bridge carries 954 vehicles a day, a quarter carry 125 or fewer, and 20.2% fewer than 100. The top 1% carry more than 107,707, and the maximum recorded is 882,085.
2. When the count was taken
yr = pd.to_numeric(nbi.YEAR_ADT_030, errors="coerce")
print(f"ADT counted in 2023 or later: {(yr >= 2023).mean():.1%}; before 2015: {(yr < 2015).mean():.1%}; oldest {yr.min():.0f}")
print("median ADT by count year band:", nbi.adt.groupby(pd.cut(yr, [1900, 2014, 2019, 2022, 2026])).median().to_dict())
ADT counted in 2023 or later: 28.3%; before 2015: 14.8%; oldest 0
median ADT by count year band: {Interval(1900, 2014, closed='right'): 300.0, Interval(2014, 2019, closed='right'): 1038.0, Interval(2019, 2022, closed='right'): 891.0, Interval(2022, 2026, closed='right'): 1566.0}
The counts are not current. 28.3% were taken in 2023 or later, 14.8% before 2015, and some have no year at all (0). Old counts are on quiet roads: the median ADT of bridges counted before 2015 is 300, against 1,566 for those counted since 2023. States recount busy roads more often.
3. The busiest poor bridges
busy = nbi[nbi.cond == "P"].nlargest(6, "adt")
print(busy[["state", "FACILITY_CARRIED_007", "FEATURES_DESC_006A", "adt", "built"]].assign(
    FACILITY_CARRIED_007=lambda d: d.FACILITY_CARRIED_007.str.strip(), FEATURES_DESC_006A=lambda d: d.FEATURES_DESC_006A.str.strip()).to_string(index=False))
state FACILITY_CARRIED_007 FEATURES_DESC_006A adt built
WV MON CO RT 19/25 SCOTTS RUN 600500 1930
CA INTERSTATE 110 SLAUSON AVE & BNSF RY 300000 1996
CA U.S. HIGHWAY 101 KESTER AVE 293000 1959
PA INTERSTATE 95 TACONY ST.AND BRIDGE ST. 280088 1967
PA INTERSTATE 95 FRALEY STREET 280088 1967
CA INTERSTATE 405 VERMONT AVE 190TH ST 269000 1962
The list of the busiest poor bridges starts with an error: a West Virginia county route over Scotts Run recorded at 600,500 vehicles a day, more than any freeway bridge in the country — almost certainly a mistyped count. Below it are real ones: Interstate 110 and US 101 in Los Angeles (300,000 and 293,000) and Interstate 95 in Philadelphia (280,088 on two adjacent bridges). Check the top of any ranking by hand.
4. Trucks
trk = pd.to_numeric(nbi.PERCENT_ADT_TRUCK_109, errors="coerce")
nbi["trucks"] = nbi.adt * trk / 100
print(f"daily truck crossings on poor bridges: {nbi.loc[nbi.cond == 'P', 'trucks'].sum() / 1e6:,.2f} million "
      f"({nbi.loc[nbi.cond == 'P', 'trucks'].sum() / nbi.trucks.sum():.1%} of truck crossings)")
daily truck crossings on poor bridges: 13.72 million (2.9% of truck crossings)
Trucks make 13.72 million crossings a day on poor bridges, 2.9% of all truck crossings — a smaller share than for all traffic, so poor bridges carry fewer trucks than average.
States and growth
The data used on this page
The Federal Highway Administration's National Bridge Inventory for 2025: average daily traffic, the year it was counted, and the percentage of trucks.
import zipfile
from pathlib import Path

import geopandas as gpd
import numpy as np
import pandas as pd
import requests

Path("data").mkdir(exist_ok=True)
# FHWA National Bridge Inventory, 2025 submission, highway bridges, all states in one comma-delimited file (53 MB zip).
# The server is slow and drops long downloads, so resume until the file is complete.
URL = "https://www.fhwa.dot.gov/bridge/nbi/2025hwybronefiledel.zip"
f = Path("data/2025hwybronefiledel.zip")
size = int(requests.head(URL, allow_redirects=True, timeout=60).headers["Content-Length"])
while not f.exists() or f.stat().st_size < size:
    have = f.stat().st_size if f.exists() else 0
    try:
        with requests.get(URL, headers={"Range": f"bytes={have}-"}, stream=True, timeout=120) as r, open(f, "ab") as out:
            for chunk in r.iter_content(1 << 20):
                out.write(chunk)
    except requests.RequestException:
        pass                                                   # resume from what arrived
with zipfile.ZipFile(f) as z:
    nbi = pd.read_csv(z.open("2025HwyBridgesDelimitedAllStates.txt"), quotechar="'", dtype=str, low_memory=False)


def dms(s, west=False):
    """NBI packs coordinates as DDMMSSss (latitude) and DDDMMSSss (longitude, positive west)."""
    s = s.str.strip().str.zfill(9 if west else 8)
    d = s.str[:-6].astype(float) + s.str[-6:-4].astype(float) / 60 + s.str[-4:].astype(float) / 100 / 3600
    return -d if west else d


nbi["lat"], nbi["lon"] = dms(nbi.LAT_016), dms(nbi.LONG_017, west=True)
nbi["cond"] = nbi.BRIDGE_CONDITION                                   # G, F or P, derived by FHWA
nbi["adt"] = pd.to_numeric(nbi.ADT_029, errors="coerce")
nbi["built"] = pd.to_numeric(nbi.YEAR_BUILT_027, errors="coerce")
nbi["area"] = pd.to_numeric(nbi.DECK_AREA, errors="coerce")
for name in ["cb_2023_us_state_20m.zip"]:
    if not Path(f"data/{name}").exists():
        Path(f"data/{name}").write_bytes(requests.get(f"https://www2.census.gov/geo/tiger/GENZ2023/shp/{name}", timeout=300).content)
states = gpd.read_file("data/cb_2023_us_state_20m.zip").to_crs(4326)
nbi["state"] = nbi.STATE_CODE_001.map(states.set_index("STATEFP").STUSPS)
print(f"{len(nbi):,} highway bridges, {nbi.shape[1]} fields, {nbi.STATE_CODE_001.nunique()} state codes")
624,193 highway bridges, 130 fields, 53 state codes
Example 1: states by traffic on poor bridges
st = nbi.groupby("state").apply(lambda d: d.loc[d.cond == "P", "adt"].sum() / d.adt.sum(), include_groups=False).sort_values(ascending=False)
print("share of each state's bridge crossings on poor bridges, highest:", st.head(5).round(3).to_dict())
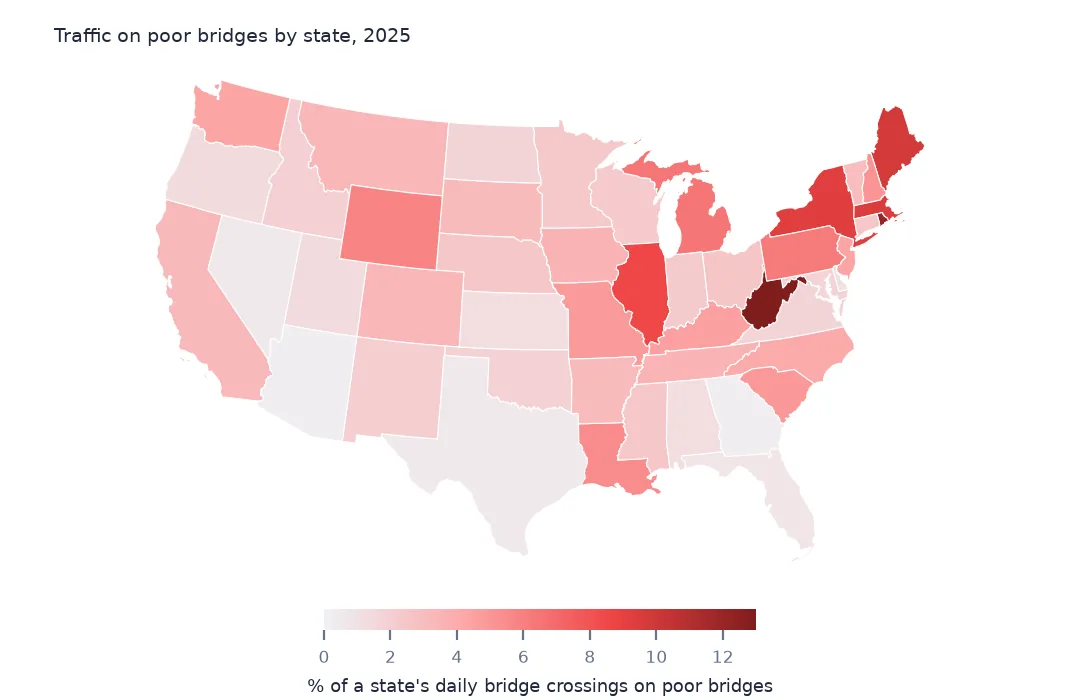
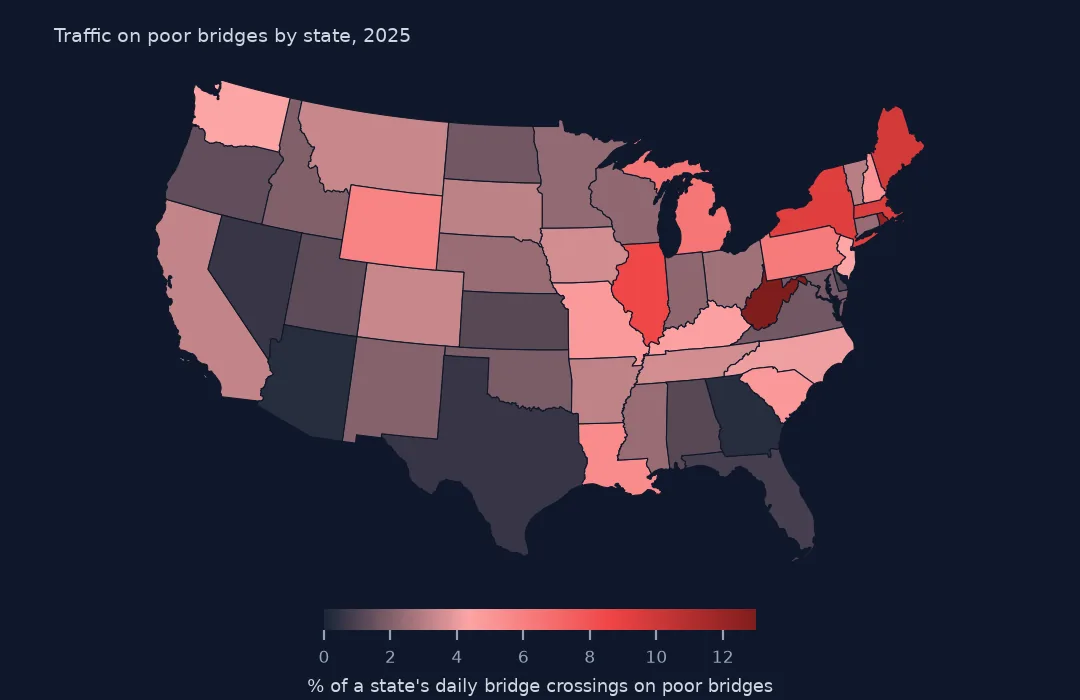
share of each state's bridge crossings on poor bridges, highest: {'WV': 0.131, 'RI': 0.121, 'PR': 0.11, 'ME': 0.098, 'MA': 0.095}
West Virginia has the highest share of its bridge crossings on poor bridges (0.131) — inflated by the one impossible count — followed by Rhode Island (0.121), Puerto Rico, Maine and Massachusetts. The ranking differs from the share of poor bridges: Rhode Island and Massachusetts have urban poor bridges with heavy traffic.
Example 2: projected traffic
fut = pd.to_numeric(nbi.FUTURE_ADT_114, errors="coerce")
fy = pd.to_numeric(nbi.YEAR_OF_FUTURE_ADT_115, errors="coerce")
g = (fut / nbi.adt) ** (1 / (fy - yr)) - 1
print(f"median implied annual traffic growth in the future-ADT field: {g[(fy > yr) & (nbi.adt > 0)].median():.2%}")
median implied annual traffic growth in the future-ADT field: 1.41%
The inventory also stores a forecast of future traffic for each bridge. The growth rate it implies has a median of 1.41% a year — a planning assumption, not a measurement.
Exposure, not risk
Weighting by traffic measures exposure: how much travel depends on bridges in poor condition. It is not a risk of collapse — poor bridges are inspected more often, often weight-posted, and failures are rare — but it is the right weight for questions about disruption, since closing a busy urban freeway bridge costs far more than closing a farm-road crossing. Transportation agencies prioritise repair partly this way.
ADT is an estimate for a year, from a count of a few days factored up or a modelled value, and the year varies by bridge. For a national total that averages out; for a ranking of individual bridges it does not, and one bad value can top the list.
Pitfalls with traffic fields
- Outliers. Compare a bridge's ADT with the road it carries; a county road with freeway traffic is an error.
- Two directions. Divided highways often have one bridge per direction, each with that direction's traffic — or each with the total. Check before summing a corridor.
- Count year. Filter or adjust by
YEAR_ADT_030when comparing places. - Percent trucks is often blank or estimated on minor roads.
Internal links
- How to find the counties with the most poor bridges — counts by place
- Annual average daily flow explained — what a daily traffic figure means
- Bridge condition ratings explained — Poor, Fair and Good
FAQ
How much traffic crosses poor bridges in the US?
About 163.8 million vehicle crossings a day in the 2025 inventory, 3.3% of all bridge crossings.
How old are the traffic counts in the National Bridge Inventory?
Mixed: 28.3% were counted in 2023 or later and 14.8% before 2015.