
The coastline paradox explained for GIS work
Problem statement
"How long is the coast?" has no answer. The measured length depends on the length of the ruler, and as the ruler shortens the measurement grows without converging — which is the coastline paradox, and it is not a curiosity. It means any published coastline length is a statement about a dataset and a generalisation level, not about the world.
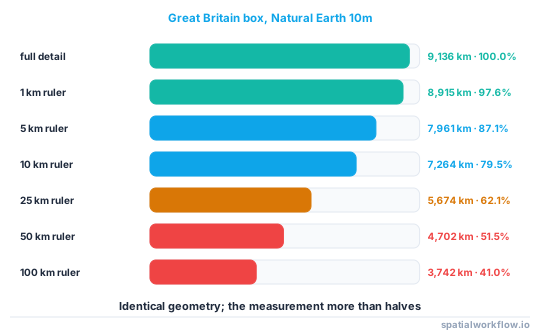
The effect is large enough to notice in ordinary work. Measured on the Natural Earth 10 m coastline within a box around Great Britain, the length falls from 9,136 km at full detail to 3,742 km when simplified with a 100 km tolerance — 41% of the original.
This guide quantifies it on a real dataset, explains why it happens, and covers what to do instead of quoting a length.
Quick answer
Measure geodesically and always publish the source and generalisation with the number:
import numpy as np, geopandas as gpd
from pyproj import Geod

geod = Geod(ellps="WGS84")

def geodesic_length_km(gdf):
    total = 0.0
    for g in gdf.geometry:
        c = np.asarray(g.coords)
        if len(c) < 2:
            continue
        _, _, d = geod.inv(c[:-1, 0], c[:-1, 1], c[1:, 0], c[1:, 1])
        total += float(np.nansum(d))
    return total / 1000
The same coastline at seven generalisation levels:
| ruler | length | share of full | vertices |
|---|---|---|---|
| full 10 m detail | 9,136 km | 100.0% | 4,794 |
| 1 km | 8,915 km | 97.6% | 1,668 |
| 2 km | 8,635 km | 94.5% | 1,006 |
| 5 km | 7,961 km | 87.1% | 490 |
| 10 km | 7,264 km | 79.5% | 304 |
| 25 km | 5,674 km | 62.1% | 141 |
| 50 km | 4,702 km | 51.5% | 97 |
| 100 km | 3,742 km | 41.0% | 75 |
Step-by-step solution
1. Stop treating length as a property of the coast
It is a property of the coast and the measurement scale. Two datasets of the same coast at different generalisation will always disagree, and neither is wrong.
2. Measure geodesically, not in degrees
Summing degree distances and multiplying by 111.32 km treats a degree of longitude as a degree of latitude. At 54°N a degree of longitude is 65 km, not 111 km, so the naive figure is far too large — and the error depends on how much of the coast runs east–west.
3. Measure in a projected CRS only if the projection preserves length
Most do not, and none does in every direction. For a national coastline an equidistant conic or the national grid is adequate; for anything continental, use geodesic distances.
4. State the source and its scale with the number
"9,136 km, Natural Earth 1:10 m, geodesic" is a reproducible statement. "9,136 km" is not.
5. Prefer scale-stable quantities
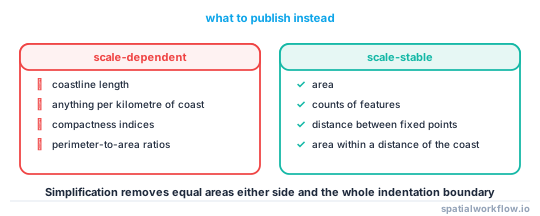
Area is far more stable than perimeter under generalisation, because simplification removes indentations that cancel. So are counts of features, distances between fixed points, and areas within a distance of the coast. If a metric can be expressed without a perimeter, express it that way.
6. If you must compare lengths, generalise both to the same tolerance
Two coastlines from different sources are only comparable after both have been simplified with the same tolerance — and that comparison measures change, not length.
7. Use the fractal dimension if the roughness itself is the point
The slope of log(length) against log(ruler) is 1 − D, where D is the fractal dimension. For coastlines D is typically 1.1 to 1.3, and it is a genuine descriptor of coastal character — much more meaningful than any single length.
Code examples
Example 1 — the full sweep on your own data
import numpy as np, geopandas as gpd
from shapely.geometry import box

coast = gpd.read_file("ne_10m_coastline.zip")
gb = gpd.clip(coast, box(-6.5, 49.8, 2.0, 58.8))
gb = gb[gb.geom_type == "LineString"]

base = geodesic_length_km(gb)
print(f"{len(gb)} parts, {sum(len(g.coords) for g in gb.geometry):,} vertices, "
      f"{base:,.0f} km")

for tol_km in (1, 2, 5, 10, 25, 50, 100):
    simp = gb.copy()
    simp["geometry"] = gb.geometry.simplify(tol_km / 111.32, preserve_topology=False)
    simp = simp[~simp.geometry.is_empty]
    L = geodesic_length_km(simp)
    v = sum(len(g.coords) for g in simp.geometry if g.geom_type == "LineString")
    print(f"{tol_km:4d} km ruler: {L:8,.0f} km  {L/base:6.1%}  {v:6,} vertices")
Example 2 — the fractal dimension
import numpy as np

tolerances = np.array([1, 2, 5, 10, 25, 50, 100])          # km
lengths = np.array([8915, 8635, 7961, 7264, 5674, 4702, 3742])

slope, intercept = np.polyfit(np.log(tolerances), np.log(lengths), 1)
print(f"log-log slope {slope:.4f} → fractal dimension D = {1 - slope:.3f}")
log-log slope -0.1895 → fractal dimension D = 1.189
A dimension of 1.19 is typical of a moderately indented coast. A smooth sandy coast approaches 1.0; a deeply fjorded one approaches 1.3.
Example 3 — quantities that do not depend on the ruler
import geopandas as gpd, numpy as np

land = gpd.read_file("ne_10m_land.zip").to_crs(27700)
gb = land.clip(box(-6.5, 49.8, 2.0, 58.8).bounds)

for tol_m in (0, 1000, 5000, 25000):
    g = gb.geometry if tol_m == 0 else gb.geometry.simplify(tol_m)
    print(f"tolerance {tol_m:6,} m: area {g.area.sum()/1e6:12,.0f} km²  "
          f"perimeter {g.length.sum()/1000:9,.0f} km")
Run this on your own extract: area moves by a percent or two across the same range that halves the perimeter. That asymmetry is the practical reason to build coastal indicators on area rather than on length.
Explanation
Why the length does not converge
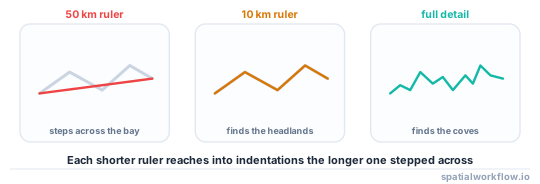
A smooth curve has a length: as the ruler shortens, the polygonal approximation converges on it. A coastline is statistically self-similar over a wide range of scales — bays contain headlands which contain coves which contain boulders — so each shorter ruler finds new detail at roughly the same rate, and the total grows as a power of the ruler length rather than approaching a limit.
Why area is stable and perimeter is not
Simplification cuts across an indentation, removing a small area on one side and adding a small area on the other; the two largely cancel. It removes the entire boundary of that indentation from the perimeter, with nothing to cancel it. The result is that area converges quickly under generalisation and perimeter does not — which makes every ratio involving perimeter, including compactness indices, scale-dependent.
Why the effect is worse for some coasts
The fractal dimension measures how fast new detail appears. Norway's fjord coast has a much higher dimension than the Namibian coast, so the same change of ruler changes the Norwegian figure far more. Published national coastline lengths differ by factors of two to five between sources for exactly this reason, and the disagreement is entirely about scale rather than about the coast.
Why this matters beyond trivia
Anything normalised by coastline length inherits the problem: pollution per kilometre of coast, defences per kilometre, erosion rates per kilometre. Two regions measured from different source scales cannot be compared, and a time series that switches source mid-way records a change that did not happen.
Edge cases or notes
simplifytolerance is in CRS units. In degrees it is not a distance.preserve_topology=Truelimits simplification and changes the curve.- Islands dominate the count. A coast's length is mostly its islands at fine scales.
- Tidal datum changes the line too. That is a separate, additive effect.
- Vertex density is not scale. A dense line can be a generalised shape.
- Raster-derived coastlines are stepped. Their length is a function of cell size.
- Publish the fractal dimension if roughness is the point.
- Never compare lengths across sources. Compare areas, or generalise both first.
Internal links
- Tidal datums explained: which shoreline is the shoreline — the other reason a coastline is ambiguous
- How to extract a coastline from a raster in Python — where cell size sets the scale
- How to measure shoreline change between two dates — comparing lines without comparing lengths
- How to simplify geometry in GeoPandas — the generalisation being applied
- Map scale and detail explained — generalisation as a cartographic decision
- How to measure distance accurately in Python — geodesic versus projected length
- Zoom and generalisation explained — the same effect in web maps
- Bathymetry explained: depths, datums and grids — resolution versus accuracy offshore
FAQ
Why does the coastline length change when I simplify?
Because a coastline is statistically self-similar: every shorter ruler finds new indentations. The measured length grows as a power of the ruler rather than converging.
How much does it actually change?
On a real Great Britain extract, from 9,136 km at full 1:10 m detail to 3,742 km at a 100 km tolerance — 41% of the original.
Should I measure in a projected CRS or geodesically?
Geodesically for anything larger than a region. Degree distances multiplied by 111.32 km are badly wrong wherever the coast runs east–west.
What should I publish instead of a length?
The length with its source and generalisation, or a scale-stable alternative such as area, or the fractal dimension if roughness is what you mean.
Why is area more reliable than perimeter?
Simplification removes and adds roughly equal areas on either side of an indentation, but removes its entire boundary from the perimeter.
Can I compare two countries' coastline lengths?
Only if both come from the same source at the same scale. Published national figures differ by factors of two to five between sources.