
How to extract a coastline from a raster in Python
Problem statement
A coastline from a raster is a contour at a chosen level — and every word in that sentence is a decision. Which raster, at what resolution, thresholded at which datum, and vectorised how.
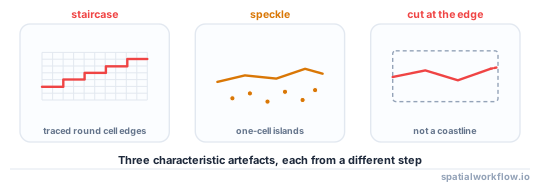
Get them wrong and the failures are characteristic: a staircase following cell edges, a coastline that ends abruptly at the tile boundary, thousands of one-pixel islands from speckle, or a line at mean sea level presented as the high-water mark. None of them raises an error, and all of them are visible once you know what to look for.
This guide extracts a coastline from an elevation grid, cleans it, and produces a line whose datum and scale are recorded.
Quick answer
Contour at the level you want, not at zero by default:
import numpy as np, rasterio, geopandas as gpd
from rasterio.features import shapes
from shapely.geometry import shape
from scipy import ndimage

LEVEL = 1.453          # MHHW in NAVD88 for this area — not 0

with rasterio.open("dtm.tif") as src:
    dem = src.read(1, masked=True)
    transform, crs = src.transform, src.crs

water = (dem <= LEVEL).filled(False)
water = ndimage.binary_opening(water, np.ones((3, 3)))     # drop speckle
water = ndimage.binary_closing(water, np.ones((3, 3)))     # fill pinholes

polys = [shape(g) for g, v in shapes(water.astype("uint8"), transform=transform) if v == 1]
sea = gpd.GeoDataFrame(geometry=polys, crs=crs)
coast = gpd.GeoDataFrame(geometry=[sea.union_all().boundary], crs=crs)
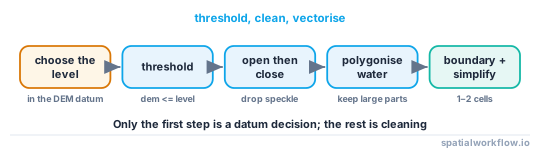
The LEVEL line is the whole guide: a coastline at 0 in a national datum is mean sea level, not the shoreline anyone means.
Step-by-step solution
1. Choose the source raster
- A LiDAR DTM gives the land surface and lets you threshold at any datum. Best where it exists.
- Satellite imagery gives a water index — NDWI or MNDWI — thresholded at a value you choose. Best for change over time, and it captures the water at the instant of the overpass, which is a tide state you did not choose.
- A global bathymetry-topography grid gives a coastline at its own resolution, which for a one-arc-minute grid is about 1.85 km — a generalised outline, not a shoreline.
2. Choose the level, in the raster's datum
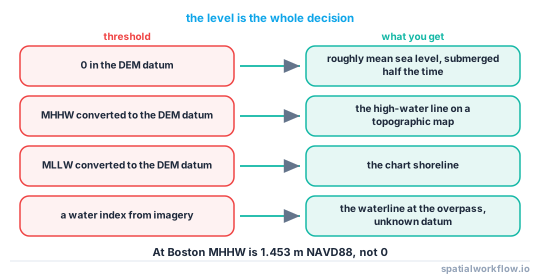
Convert the tidal datum you want into the raster's vertical datum first. At Boston, MHHW is 1.453 m above NAVD88, so a high-water shoreline from a NAVD88 DTM is the 1.453 m contour.
3. Clean the mask before vectorising
Binary opening removes isolated water pixels on land; closing fills isolated land pixels in water. A 3 × 3 structuring element removes single-cell noise; larger elements start removing real features, so check the count of components before and after.
4. Remove components below a minimum area
Real islands have a minimum size for the map you are making. Setting it explicitly is better than letting speckle decide.
5. Polygonise, then take the boundary
Vectorising the water mask and taking its boundary gives a closed, topologically sound coastline. Contouring the raster directly with skimage.measure.find_contours also works and produces open lines that need assembling.
6. Smooth deliberately, or not at all
rasterio.features.shapes follows cell edges exactly, so the output is a staircase. Simplifying with a tolerance of one to two cells removes the staircase; anything larger is generalisation and changes the length. The coastline paradox explained for GIS work covers what that does to any measurement.
7. Record the datum, the level, the source and the date
A coastline layer without those four is not comparable with anything, including a later version of itself.
Code examples
Example 1 — extraction with the cleaning reported
import numpy as np, rasterio, geopandas as gpd
from rasterio.features import shapes
from shapely.geometry import shape
from scipy import ndimage

def extract_coastline(dem_path, level, min_area_m2=10_000, open_px=1, close_px=1,
                      simplify_cells=1.5):
    with rasterio.open(dem_path) as src:
        dem = src.read(1, masked=True)
        transform, crs = src.transform, src.crs
        cell = abs(transform.a)

    water = (dem <= level).filled(False)
    raw_components = ndimage.label(water)[1]

    if open_px:
        water = ndimage.binary_opening(water, np.ones((2 * open_px + 1,) * 2))
    if close_px:
        water = ndimage.binary_closing(water, np.ones((2 * close_px + 1,) * 2))
    clean_components = ndimage.label(water)[1]

    polys = [shape(g) for g, v in shapes(water.astype("uint8"), transform=transform)
             if v == 1]
    sea = gpd.GeoDataFrame(geometry=polys, crs=crs)
    kept = sea[sea.area >= min_area_m2]

    line = kept.union_all().boundary
    if simplify_cells:
        line = line.simplify(simplify_cells * cell, preserve_topology=True)

    return gpd.GeoDataFrame(
        {"level_m": [level], "source": [dem_path], "cell_m": [cell]},
        geometry=[line], crs=crs), {
        "components_before_cleaning": raw_components,
        "components_after_cleaning": clean_components,
        "polygons": len(sea), "kept_above_min_area": len(kept),
    }

coast, report = extract_coastline("dtm_navd88.tif", level=1.453)
print(report)
The report is the point. A run that drops from thousands of components to dozens has removed speckle; one that drops from dozens to three has removed real islands.
Example 2 — from imagery, with the tide state acknowledged
import numpy as np, rasterio

def mndwi(green_path, swir_path):
    with rasterio.open(green_path) as g, rasterio.open(swir_path) as s:
        green = g.read(1).astype("float32")
        swir = s.read(1).astype("float32")
        profile = g.profile
    denom = green + swir
    out = np.where(denom == 0, np.nan, (green - swir) / denom)
    return out, profile

index, profile = mndwi("B03.tif", "B11.tif")
water = index > 0.0            # threshold: Otsu on the histogram is better than a constant
print(f"water fraction at threshold 0.0: {np.nanmean(water):.1%}")
An imagery-derived shoreline is the waterline at the moment of the overpass. Record the acquisition time and look up the tide state at the nearest gauge, or the line is a shoreline at an unknown datum.
Example 3 — check the result before shipping it
import numpy as np, geopandas as gpd

def audit_coastline(coast, cell_m, expected_datum):
    g = coast.geometry.union_all()
    parts = list(g.geoms) if hasattr(g, "geoms") else [g]
    seg = []
    for p in parts:
        c = np.asarray(p.coords)
        seg.extend(np.hypot(*np.diff(c, axis=0).T))
    seg = np.array(seg)
    return {
        "parts": len(parts),
        "vertices": sum(len(np.asarray(p.coords)) for p in parts),
        "median_segment_m": float(np.median(seg)),
        "segments_equal_to_one_cell": float(np.mean(np.isclose(seg, cell_m, rtol=0.01))),
        "length_km": float(sum(p.length for p in parts) / 1000),
        "datum": expected_datum,
    }
If segments_equal_to_one_cell is close to 1, the line is still a staircase and has not been simplified. That single number catches the commonest visual complaint about raster-derived coastlines.
Explanation
Why thresholding at zero is usually wrong
Zero in a national vertical datum is approximately mean sea level, which is submerged for half of every tidal cycle. The shoreline people mean on a topographic map is usually a high-water line, and the shoreline on a chart is a low-water one. Both are offsets from zero that have to be looked up per location.
Why morphological cleaning comes before vectorisation
Vectorising first produces tens of thousands of one-cell polygons that then have to be filtered by area — slow, and it leaves ragged edges where a single cell was removed from a larger shape. Cleaning the mask is a cheap array operation and produces a shape whose boundary is already smooth at the cell scale.
Why the staircase is not a rendering problem
rasterio.features.shapes traces the exact boundary between cells, so every segment is one cell long and axis-aligned. That is a faithful representation of the mask and a poor representation of a coast. Simplifying at one to two cells removes the staircase without meaningfully generalising; the measured length falls slightly and correctly.
Why an imagery shoreline has an unknown datum
A satellite records the water edge at the instant of the overpass, which is at whatever tide state happened then. Two images a week apart in a three-metre tidal range can show shorelines hundreds of metres apart with no change on the ground. For change detection, either correct each date to a common datum using a nearby gauge, or restrict the comparison to images acquired near the same tide state.
Edge cases or notes
- Tile edges are not coastline. Clip the boundary to the data extent and mark the cut.
- Rivers connect to the sea. A threshold floods them; decide how far upstream to cut.
- Lakes below the level get included. Keep only components connected to the sea.
- Nodata is not land. Mask it explicitly.
- Vegetation lifts a DSM. Use a DTM, or the shoreline retreats into the marsh.
- A one-arc-minute grid gives a 1.85 km coastline. That is a generalised outline.
union_all().boundaryorients rings consistently; individual boundaries may not.- Record the extraction parameters in the layer's metadata, not in a notebook.
Internal links
- Tidal datums explained: which shoreline is the shoreline — choosing the level
- The coastline paradox explained for GIS work — what simplification does to the length
- How to measure shoreline change between two dates — comparing two extractions
- How to convert raster to vector in Python — the polygonisation step in general
- How to generate contours from a DEM in Python — the contour alternative
- How to calculate spectral indices in Python — the imagery route
- Contours are jagged or noisy — the same staircase problem
- How to map coastal inundation from a DEM in Python — the connected-component rule reused
FAQ
How do I get a coastline from a DEM?
Threshold the DEM at the level you want in its own vertical datum, clean the mask morphologically, polygonise the water, and take the boundary.
What level should I threshold at?
Whatever the tidal datum you want is, converted into the DEM's datum — for example MHHW at 1.453 m NAVD88, not 0.
Why is my coastline a staircase?
Because polygonising a raster traces cell edges exactly. Simplify with a tolerance of one to two cells.
How do I get rid of the tiny islands?
Binary opening on the mask before vectorising, then a minimum area filter. Report the component count before and after so you know what you removed.
Can I use satellite imagery instead?
Yes, with a water index such as MNDWI — but the result is the waterline at the overpass time, at an unknown tide state. Record the acquisition time.
Why does my coastline stop at the tile edge?
Because the water mask does. Clip the boundary to the data extent and mark the cut so nobody measures across it.