
How to map coastal inundation from a DEM in Python
Problem statement
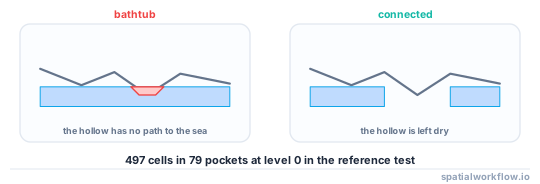
A bathtub fill — every cell below a level is flooded — is the standard first attempt and is wrong in two specific ways. It floods hollows that have no connection to the sea, and it floods land behind defences that would hold.
The connectivity fix is cheap and should always be applied. On a coarse test over the Netherlands, thresholding at 2 m flooded 23,196 cells; keeping only cells connected to the sea reduced that to 23,088, leaving 108 cells in 29 isolated pockets. At 0 m the difference was larger — 497 isolated cells in 79 pockets — because low-lying inland depressions are exactly what a coarse grid resolves.
The defences problem is not fixable by a connectivity rule, and that is the honest limit of a still-water inundation map.
Quick answer
Threshold, then keep only the component connected to the sea:
import numpy as np, rasterio
from scipy import ndimage

with rasterio.open("dtm_navd88.tif") as src:
    dem = src.read(1, masked=True)
    transform, crs = src.transform, src.crs

LEVEL = 1.953                       # MHHW 1.453 m NAVD88 plus a 0.5 m scenario

below = (dem <= LEVEL).filled(False)
labels, n = ndimage.label(below)

edge = set(labels[0, :]) | set(labels[-1, :]) | set(labels[:, 0]) | set(labels[:, -1])
edge.discard(0)
connected = np.isin(labels, list(edge))

print(f"bathtub {below.sum():,} cells, connected {connected.sum():,}, "
      f"isolated {below.sum() - connected.sum():,} in {n - len(edge)} pockets")
Seeding from the array edge works when the sea reaches the edge of the raster. Where it does not, seed from a polygon of known open water instead.
Step-by-step solution
1. Get the level right before anything else
The level is a tidal datum plus a scenario plus a surge allowance, expressed in the DEM's vertical datum. Sea level rise data explained builds the number; using a bare 0.5 m against a DEM's zero maps nothing meaningful.
2. Use a DTM, not a DSM
A surface model includes buildings and vegetation, so a bathtub fill over a DSM shows dry rooftops inside a flooded street and dry hedgerows across a flooded field.
3. Threshold and label
ndimage.label on the boolean mask gives connected components. The default connectivity is 4-neighbour; structure=np.ones((3,3)) gives 8-neighbour, which lets water pass diagonally through a one-cell gap. Choose deliberately — 4-connectivity is the conservative choice for flooding.
4. Seed from the sea, not from the edge, where you can
Seeding from the array edge is a convenience. A polygon of open water — a coastline layer, an ocean mask — is correct, and it is the only option when the raster is an inland tile.
5. Report the isolated pockets rather than discarding them silently
They are real depressions below the level. They may flood from rainfall or groundwater even if the sea never reaches them, and the count is part of the result.
6. Burn in the defences you know about
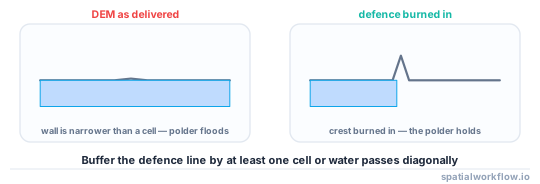
A dike, a seawall or a raised road is often narrower than the DEM cell and therefore absent from it. Rasterising a defences layer at its crest height and taking the maximum with the DEM is the standard correction, and it changes the answer substantially in defended coasts.
7. Be honest about what this is not
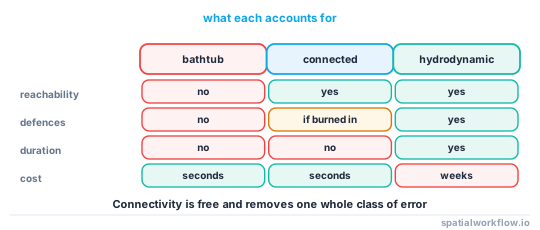
A still-water connected fill is a screening tool. It has no hydrodynamics, no duration, no wave overtopping, no drainage and no breach analysis. It answers "what is below this level and connected to the sea", which is useful and is not a flood model.
Code examples
Example 1 — connected inundation with a seed polygon
import numpy as np, rasterio, geopandas as gpd
from rasterio.features import rasterize
from scipy import ndimage

def inundate(dem_path, level, sea_polygon=None, connectivity=4, min_cells=1):
    with rasterio.open(dem_path) as src:
        dem = src.read(1, masked=True)
        transform, crs, shape = src.transform, src.crs, (src.height, src.width)
        cell_area = abs(transform.a * transform.e)

    below = (dem <= level).filled(False)
    structure = None if connectivity == 4 else np.ones((3, 3), dtype=int)
    labels, n = ndimage.label(below, structure=structure)

    if sea_polygon is not None:
        seed = rasterize([sea_polygon], out_shape=shape, transform=transform,
                         fill=0, default_value=1, dtype="uint8").astype(bool)
        seeds = set(np.unique(labels[seed & below]))
    else:
        seeds = set(labels[0, :]) | set(labels[-1, :]) | set(labels[:, 0]) | set(labels[:, -1])
    seeds.discard(0)

    connected = np.isin(labels, list(seeds))
    sizes = ndimage.sum(below, labels, index=range(1, n + 1))
    isolated = [i for i in range(1, n + 1) if i not in seeds and sizes[i - 1] >= min_cells]

    return connected, {
        "level_m": level,
        "bathtub_cells": int(below.sum()),
        "connected_cells": int(connected.sum()),
        "isolated_cells": int(below.sum() - connected.sum()),
        "isolated_pockets": len(isolated),
        "connected_km2": float(connected.sum() * cell_area / 1e6),
    }
Example 2 — the sweep that shows how much connectivity matters
import numpy as np, xarray as xr
from scipy import ndimage

dem = xr.open_dataset("etopo_2022_60s.nc")["z"].sel(
    lat=slice(50.6, 53.7), lon=slice(3.2, 7.3)).load().values

for level in (0, 1, 2, 5):
    below = dem <= level
    labels, n = ndimage.label(below)
    edge = set(labels[0, :]) | set(labels[-1, :]) | set(labels[:, 0]) | set(labels[:, -1])
    edge.discard(0)
    connected = np.isin(labels, list(edge))
    print(f"level {level:>2} m: bathtub {below.sum():6,} ({below.mean():5.1%}), "
          f"connected {connected.sum():6,} ({connected.mean():5.1%}), "
          f"isolated {below.sum()-connected.sum():5,} in {n-len(edge):,} pockets")
level 0 m: bathtub 19,067 (41.7%), connected 18,570 (40.6%), isolated 497 in 79 pockets
level 1 m: bathtub 21,678 (47.4%), connected 21,515 (47.0%), isolated 163 in 44 pockets
level 2 m: bathtub 23,196 (50.7%), connected 23,088 (50.5%), isolated 108 in 29 pockets
level 5 m: bathtub 25,310 (55.3%), connected 25,247 (55.2%), isolated 63 in 22 pockets
Two notes on this example. The isolated fraction falls as the level rises, because higher levels connect pockets to each other and to the sea. And a one-arc-minute grid is far too coarse for real inundation mapping — roughly 1.85 km cells — so this demonstrates the mechanism rather than the answer. A real study needs a 1–5 m LiDAR DTM.
Example 3 — burn in the defences
import numpy as np, rasterio, geopandas as gpd
from rasterio.features import rasterize

def with_defences(dem, transform, shape, defences, height_col="crest_m", width_cells=1):
    """Raise the DEM along defence lines to their crest height."""
    burn = rasterize(
        ((geom.buffer(width_cells * abs(transform.a)), h)
         for geom, h in zip(defences.geometry, defences[height_col])),
        out_shape=shape, transform=transform, fill=np.nan, dtype="float32")
    return np.fmax(dem, burn)

defences = gpd.read_file("sea_defences.gpkg")
dem_defended = with_defences(dem, transform, dem.shape, defences)
Buffering the line by at least one cell is essential: a defence rasterised as a one-cell-wide line can be crossed diagonally under 8-connectivity, and the flood pours through a wall that is there.
Explanation
Why connectivity is not optional
A DEM contains every depression in the landscape — quarries, gravel pits, drained polders, road cuttings — and many of them are below any sea level scenario. A bathtub fill marks all of them as flooded, which is wrong in a way that a reviewer will find immediately and that undermines the credible part of the map. The fix is one ndimage.label call.
Why 4-connectivity is the conservative choice
Under 8-connectivity, water passes diagonally between two cells that touch only at a corner, which means a one-cell-wide barrier with a diagonal step in it does not hold. Physically, water does not flow through a corner. Using 4-connectivity for the water and 8-connectivity for the barriers is the standard asymmetry in flood modelling.
Why defences need burning in
A sea wall is two to three metres wide and a LiDAR DTM is often produced at one to two metres with smoothing, so the crest is under-represented or absent. Every bathtub map of a defended coast floods behind the defences unless they are added back explicitly, and that is the single largest source of over-prediction on managed coasts.
Why this is a screening tool
A still-water map has no time in it. Real flooding depends on the duration of the high water, the volume that can pass a breach, the drainage capacity behind the defence and wave overtopping, none of which a threshold captures. The output is "land below the level, connected to the sea" — a useful first filter and not a flood extent.
Edge cases or notes
- Culverts and sluices connect where the DEM does not. Burn them in as low cells.
- Rivers carry the level inland. Decide how far upstream the tidal limit is.
- Nodata is not high ground. Mask it or it acts as a barrier.
- Vertical datum must match. DEM, tidal datum and scenario in one system.
- DEM error is large against a 0.5 m scenario. Present a band, not a line.
- Buildings in a DSM act as walls. Use a DTM.
- Isolated pockets are still information. Report them separately.
- Report the area, the level and the datum together. None is meaningful alone.
Internal links
- An inundation map floods inland areas that cannot flood — the failure in detail
- Sea level rise data explained — assembling the level
- Tidal datums explained: which shoreline is the shoreline — converting the tidal surface
- How to extract a coastline from a raster in Python — the same connectivity rule
- Height above nearest drainage explained — a better proxy for fluvial flooding
- How to fill sinks and compute flow direction in Python — depressions from the hydrological side
- Digital elevation models explained — DTM versus DSM
- How to rasterize a vector layer in Python — burning in the defences
FAQ
What is wrong with a bathtub inundation map?
It floods depressions that have no connection to the sea, and it floods land behind defences the DEM does not resolve. The first is fixable with a connected-component test; the second is not.
How do I keep only the flooding connected to the sea?
Label the below-threshold mask with ndimage.label and keep the components that touch the sea — seeded from an ocean polygon, or from the array edge if the sea reaches it.
Should I use 4- or 8-connectivity?
Four for the water, because it does not flow through a corner. Use 8-connectivity for barriers so a diagonal step in a wall still holds.
What level should I threshold at?
A tidal datum plus a scenario plus any surge allowance, all converted into the DEM's vertical datum.
Why do my defences not hold?
Because they are narrower than a DEM cell and were smoothed away. Rasterise the defence lines at their crest height, buffered by at least one cell, and take the maximum with the DEM.
Is this a flood model?
No. It has no duration, no hydrodynamics, no drainage and no overtopping. It is a screening filter for land below a level and connected to the sea.