
Bathymetry explained: depths, datums and grids
Problem statement
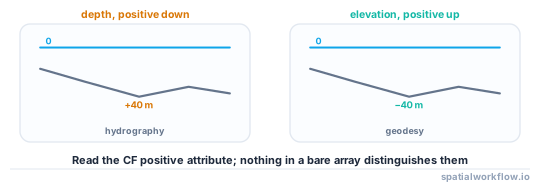
Bathymetry is elevation with the sign flipped, and that one difference breaks more code than everything else about marine data combined. A file may store depth as a positive number increasing downwards, or elevation as a negative number increasing upwards, and both are labelled "depth" by somebody.
Underneath that there are three more things a bathymetric grid has to tell you and often does not: which vertical datum the zeros are measured from, whether the values are measurements or an interpolation between sparse soundings, and whether the grid is depths at all or a blend of topography and bathymetry.
This guide covers all four, using ETOPO 2022 at one arc-minute — 10,800 × 21,600 cells covering the whole planet — as the worked example.
Quick answer
Read the metadata before the data:
import xarray as xr

ds = xr.open_dataset("etopo_2022_60s.nc")
print(ds["z"].attrs)
{'long_name': 'z', 'units': 'meters', 'positive': 'up',
'standard_name': 'height', 'vert_crs_name': 'EGM2008', 'vert_crs_epsg': 'EPSG:3855'}
positive: up settles the sign: these are elevations, so the sea is negative. vert_crs_epsg: EPSG:3855 settles the datum: heights are relative to the EGM2008 geoid, not to a chart datum and not to the ellipsoid. A file without those two attributes needs both to be established before any number from it is used.
Step-by-step solution
1. Establish the sign convention
Three checks, in order: the CF positive attribute, the sign of values in a place you know is deep ocean, and the variable name. Only the first is authoritative. If z at the middle of the Pacific is −5,000, it is elevation; if it is +5,000, it is depth.
2. Establish the vertical datum
Bathymetry can be referenced to the ellipsoid, a geoid model, mean sea level, or a chart datum such as Lowest Astronomical Tide. The differences are metres in shallow water, which is exactly where they matter. ETOPO 2022 uses EGM2008; nautical charts use a chart datum chosen so depths are conservative.
3. Establish what the grid actually is
A global product like ETOPO is a blend: topography on land, bathymetry at sea, interpolated or satellite-derived in between. Only a fraction of it is measured depth. A survey grid is measured on its tracklines and interpolated elsewhere. Neither distinction is visible in the array.
4. Weight by latitude before computing any statistic
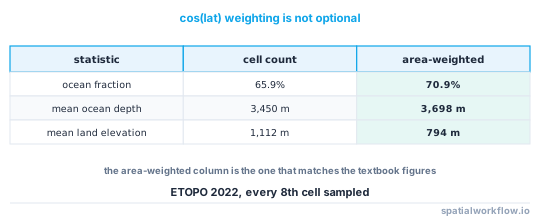
An equal-angle grid has cells that shrink towards the poles, so a plain mean over-weights high latitudes. On the ETOPO grid the difference is not subtle:
| statistic | cell count | area-weighted |
|---|---|---|
| ocean fraction | 65.9% | 70.9% |
| mean ocean depth | 3,450 m | 3,698 m |
| mean land elevation | 1,112 m | 794 m |
The area-weighted numbers are the ones that match the textbook figures — 71% ocean and a mean depth of about 3,700 m.
5. Expect a hypsometric distribution, not a spread
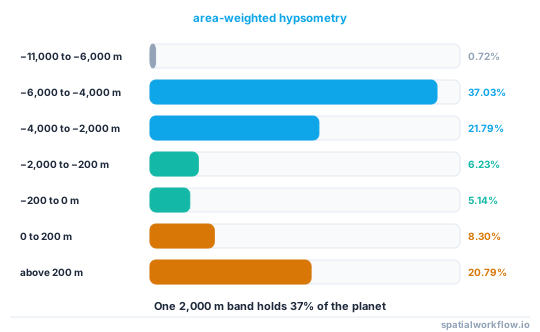
Elevation is strongly bimodal: continental surfaces near sea level and abyssal plains four to six kilometres down, with little in between. Area-weighted from ETOPO:
| band | share of the globe |
|---|---|
| −11,000 to −6,000 m | 0.72% |
| −6,000 to −4,000 m | 37.03% |
| −4,000 to −2,000 m | 21.79% |
| −2,000 to −200 m | 6.23% |
| −200 to 0 m | 5.14% |
| 0 to 200 m | 8.30% |
| above 200 m | 20.79% |
The 37% in a single 2,000 m band is the abyssal plain, and it is why a linear colour ramp over the full range shows almost no structure in the ocean.
6. Match the resolution to the question
One arc-minute is about 1.85 km at the equator — fine for ocean basins, useless for a harbour. Coastal work needs a survey grid at metres; inundation mapping needs a LiDAR DTM at 1–5 m.
Code examples
Example 1 — establish the convention before trusting anything
import xarray as xr, numpy as np

def depth_convention(ds, var="z"):
    a = ds[var]
    report = {"attrs": dict(a.attrs)}
    # a point in the deep Pacific
    probe = float(a.sel(lat=0, lon=-150, method="nearest"))
    report["deep_pacific_value"] = probe
    report["convention"] = (
        "elevation (positive up)" if probe < 0 else "depth (positive down)")
    report["declared"] = a.attrs.get("positive")
    if report["declared"] and (
            (report["declared"] == "up") != (probe < 0)):
        report["warning"] = "the declared convention disagrees with the data"
    return report

print(depth_convention(xr.open_dataset("etopo_2022_60s.nc")))
Example 2 — area-weighted statistics on a geographic grid
import xarray as xr, numpy as np

ds = xr.open_dataset("etopo_2022_60s.nc")
z = ds["z"].isel(lat=slice(None, None, 8), lon=slice(None, None, 8))
a = z.values
w = np.broadcast_to(np.cos(np.deg2rad(z["lat"].values))[:, None], a.shape)

ocean = a < 0
print(f"ocean fraction, cell count   : {ocean.mean():.3%}")
print(f"ocean fraction, area-weighted: {(ocean * w).sum() / w.sum():.3%}")

d, wd = -a[ocean], w[ocean]
print(f"mean depth, cell count   : {d.mean():,.0f} m")
print(f"mean depth, area-weighted: {(d * wd).sum() / wd.sum():,.0f} m")
ocean fraction, cell count : 65.915%
ocean fraction, area-weighted: 70.915%
mean depth, cell count : 3,450 m
mean depth, area-weighted: 3,698 m
Example 3 — a regional subset with its own statistics
import xarray as xr

ds = xr.open_dataset("etopo_2022_60s.nc")
north_sea = ds["z"].sel(lat=slice(51.0, 56.0), lon=slice(1.0, 9.0)).load()

sea = north_sea.where(north_sea < 0)
print(f"{north_sea.shape} cells, {float(north_sea.min()):.0f} to "
      f"{float(north_sea.max()):.0f} m")
print(f"sea cells: {float((north_sea < 0).mean()):.1%}, "
      f"mean depth {-float(sea.mean()):.1f} m")
for d in (10, 20, 50, 100):
    share = float(((north_sea < 0) & (north_sea > -d)).sum() / (north_sea < 0).sum())
    print(f"  shallower than {d:3d} m: {share:.1%} of the sea area")
(300, 480) cells, -93 to 775 m
sea cells: 69.0%, mean depth 32.0 m
shallower than 10 m: 12.3% of the sea area
shallower than 20 m: 20.8% of the sea area
shallower than 50 m: 91.8% of the sea area
shallower than 100 m: 100.0% of the sea area
A shelf sea: nothing in that box is deeper than 100 m, and the mean is 32 m. That is a completely different regime from the global mean of 3,698 m, and any colour ramp or contour interval has to be chosen per region.
Explanation
Why the sign convention is not standardised
Hydrography measures depth below a datum, because that is what a mariner needs: a positive number that must stay above the keel. Geodesy and geophysics measure height above a reference surface, because that is continuous with the land. Both are correct in their own field, and files circulate between the two, so any given grid may use either. The CF positive attribute exists precisely to make it explicit.
Why the vertical datum matters most in shallow water
In 4,000 m of water, a 2 m datum difference is 0.05% and irrelevant. In a 5 m channel it is 40% and decides whether a vessel grounds. That is why nautical charts use a chart datum near the lowest astronomical tide — the depth shown is close to the worst case — while scientific bathymetry uses mean sea level or a geoid, which is the wrong reference for navigation and the right one for physics.
Why a global grid is mostly not measurement
Ship-track multibeam covers a small fraction of the ocean floor. The rest of a global grid is filled by satellite-altimetry-derived gravity inversion, which resolves features of about 6 km and larger and has vertical errors of tens to hundreds of metres in places. A global grid is a best available surface, not a survey, and treating it as measurement is how a seamount appears in the wrong place.
Why the hypsometry explains most colour ramp problems
With 37% of the planet in a single 2,000 m band and a total range of 17,663 m, a linear ramp spends most of its colours on a range that barely occurs. The standard answers are a two-part ramp split at sea level, a histogram-equalised stretch, or contours at intervals chosen per depth band.
Edge cases or notes
positiveis a CF attribute and is the only authoritative statement of convention.- Nodata masquerades as depth. −9999 is a common fill and a plausible trench.
- Ice surface or bedrock. ETOPO ships both; they differ by kilometres in Antarctica.
- Grid registration matters. Cell-centre versus cell-edge shifts everything by half a cell.
- Longitude may run 0–360. Subsetting across the antimeridian needs a roll.
- Depth is not thickness. Water depth and sediment thickness are different grids.
- Chart datum varies by chart. It is defined locally, not globally.
- Resolution is not accuracy. A 15-arcsecond grid can be interpolated from 6 km data.
Internal links
- Bathymetry depths are positive in one file and negative in another — the fix when the two meet
- Tidal datums explained: which shoreline is the shoreline — the vertical reference in shallow water
- How to load and plot a bathymetry grid in Python — reading and displaying it
- How to generate depth contours from bathymetry — contour intervals for a bimodal surface
- Vertical datums explained — the land-side equivalent
- NetCDF and gridded data explained — the container
- How to compute an area-weighted mean on a latitude-longitude grid — the cos(lat) weighting in full
- Digital elevation models explained — the same ideas above water
FAQ
Is bathymetry positive or negative?
Either, depending on the file. Check the CF positive attribute first, then the sign of a value in a place you know is deep ocean.
What vertical datum is bathymetry measured from?
It varies. ETOPO 2022 uses the EGM2008 geoid; nautical charts use a chart datum near the lowest astronomical tide; survey grids often use mean sea level or an ellipsoid.
Why is my mean ocean depth too shallow?
Because an equal-angle grid over-weights the poles. Weight by cos(latitude): the ETOPO mean goes from 3,450 m unweighted to 3,698 m area-weighted.
How much of the ocean floor has actually been surveyed?
A small fraction. Most of a global grid is inferred from satellite altimetry, which resolves features of roughly 6 km and larger.
Why does my bathymetry map look flat?
Because 37% of the planet sits in one 2,000 m depth band. Use a ramp split at sea level or a histogram-equalised stretch.
What resolution do I need?
One arc-minute for ocean basins, metres for harbours, and 1–5 m LiDAR for coastal inundation. Resolution is not the same as accuracy.