
How to measure shoreline change between two dates
Problem statement
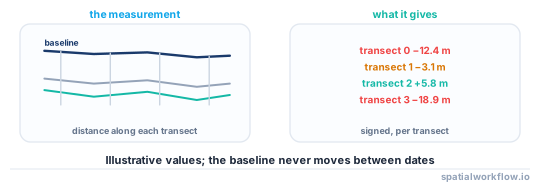
Two shorelines, two dates, and the question is how far the coast moved. The answer is not the difference in their lengths, because the length of a coastline is not a number. It is a distance measured along a set of transects, perpendicular to the coast, at positions that stay fixed between surveys.
The measurement is straightforward. What makes shoreline change hard is that most of the apparent movement is usually not change: different tidal datums, different source scales, different extraction thresholds and different tide states at the moment of acquisition each produce a shift that looks exactly like erosion.
This guide builds the transect measurement and the checks that separate signal from method.
Quick answer
Cast transects from a fixed baseline and measure where each shoreline crosses:
import numpy as np, geopandas as gpd
from shapely.geometry import LineString, Point

def transects(baseline, spacing=50, length=500):
    out = []
    for d in np.arange(0, baseline.length, spacing):
        p = baseline.interpolate(d)
        q = baseline.interpolate(min(d + 1.0, baseline.length))
        nx, ny = (q.y - p.y), -(q.x - p.x)
        n = np.hypot(nx, ny) or 1.0
        out.append(LineString([(p.x - length * nx / n, p.y - length * ny / n),
                               (p.x + length * nx / n, p.y + length * ny / n)]))
    return gpd.GeoDataFrame({"id": range(len(out))}, geometry=out)

def intersect_distance(transect, shoreline, origin):
    hit = transect.intersection(shoreline)
    if hit.is_empty:
        return np.nan
    pts = [hit] if hit.geom_type == "Point" else list(hit.geoms)
    return min(origin.distance(p) for p in pts if p.geom_type == "Point")
Positive change is accretion, negative is erosion, and the sign convention has to be fixed by the transect's direction rather than inferred.
Step-by-step solution
1. Put both shorelines in the same datum
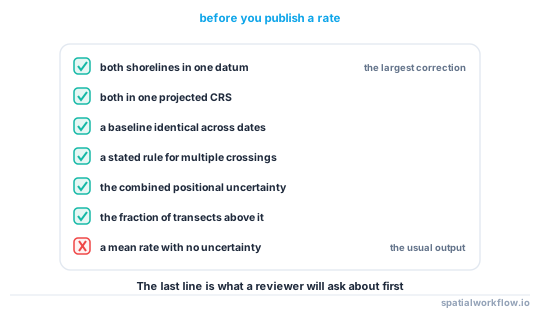
This is the step that decides whether the answer means anything. A shoreline at MHHW and one at mean sea level differ by whatever horizontal distance the vertical offset covers — on a 1% beach with a 3.1 m range, 310 m. Convert both to a common datum before measuring.
2. Put both in the same projected CRS
Distances are in metres. Use a national grid or a local UTM zone, not degrees.
3. Build a baseline that does not move
A smoothed line offset landward of both shorelines, or an existing fixed feature. It is a coordinate system, not a shoreline, and it must be identical between every pair of dates you compare.
4. Cast transects at a fixed spacing
Fifty metres is a common choice for a beach study and 500 m for a regional one. Every transect keeps its identifier across all dates, which is what makes a time series possible.
5. Handle multiple intersections explicitly
A transect crossing a spit, a barrier island or a river mouth meets the shoreline several times. Taking the nearest crossing to the baseline is one defensible rule; taking the furthest is another. Pick one, and count how often it mattered.
6. Compute the rate, not just the difference
Change per year is comparable between pairs with different intervals. With three or more dates, fit a linear rate per transect and report its standard error.
7. Establish the uncertainty before interpreting anything
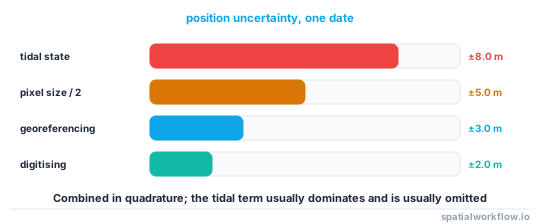
The positional uncertainty of each shoreline — georeferencing, digitising, pixel size, tidal correction — combines into a total. Change smaller than that is not detectable, and the fraction of transects above it is the honest headline.
Code examples
Example 1 — the full measurement
import numpy as np, geopandas as gpd, pandas as pd
from shapely.geometry import Point

def shoreline_change(baseline, shorelines: dict, spacing=50, length=500):
    """shorelines: {date: GeoDataFrame of lines}, all in the same projected CRS."""
    t = transects(baseline, spacing, length)
    origins = [baseline.interpolate(d) for d in np.arange(0, baseline.length, spacing)]

    rows = []
    for date, gdf in shorelines.items():
        line = gdf.union_all()
        for tid, (tr, o) in enumerate(zip(t.geometry, origins)):
            rows.append({"transect": tid, "date": pd.Timestamp(date),
                         "distance_m": intersect_distance(tr, line, o)})
    df = pd.DataFrame(rows)
    wide = df.pivot(index="transect", columns="date", values="distance_m")

    first, last = wide.columns.min(), wide.columns.max()
    years = (last - first).days / 365.25
    wide["change_m"] = wide[last] - wide[first]
    wide["rate_m_yr"] = wide["change_m"] / years
    return wide

result = shoreline_change(baseline_line, {"2014-06-01": s2014, "2026-06-01": s2026})
print(result[["change_m", "rate_m_yr"]].describe().round(2))
print(f"transects with no intersection: {result['change_m'].isna().sum()}")
Example 2 — the uncertainty budget
import numpy as np

def position_uncertainty(georef_m, digitise_m, pixel_m, tidal_m):
    """Root sum of squares of the independent contributions."""
    terms = np.array([georef_m, digitise_m, pixel_m / 2, tidal_m])
    return float(np.sqrt((terms ** 2).sum()))

u_2014 = position_uncertainty(georef_m=3.0, digitise_m=2.0, pixel_m=10.0, tidal_m=8.0)
u_2026 = position_uncertainty(georef_m=1.5, digitise_m=1.0, pixel_m=0.5, tidal_m=2.0)
u_change = float(np.hypot(u_2014, u_2026))
print(f"2014 ±{u_2014:.1f} m, 2026 ±{u_2026:.1f} m, change ±{u_change:.1f} m")

detectable = result["change_m"].abs() > u_change
print(f"transects with detectable change: {detectable.sum()} of {len(result)} "
      f"({detectable.mean():.1%})")
The tidal term usually dominates and is the one most often omitted. On a gently sloping beach, an uncorrected tide state of half a metre is tens of metres of horizontal position.
Example 3 — a rate from three or more dates
import numpy as np, pandas as pd

def linear_rates(wide_dates: pd.DataFrame):
    """wide_dates: index=transect, columns=Timestamps, values=distance in metres."""
    dates = wide_dates.columns
    x = np.array([(d - dates[0]).days / 365.25 for d in dates])
    out = []
    for tid, row in wide_dates.iterrows():
        y = row.values.astype(float)
        ok = np.isfinite(y)
        if ok.sum() < 3:
            out.append({"transect": tid, "rate_m_yr": np.nan, "se": np.nan, "n": int(ok.sum())})
            continue
        slope, intercept = np.polyfit(x[ok], y[ok], 1)
        resid = y[ok] - (slope * x[ok] + intercept)
        se = float(np.sqrt((resid ** 2).sum() / (ok.sum() - 2)
                           / ((x[ok] - x[ok].mean()) ** 2).sum()))
        out.append({"transect": tid, "rate_m_yr": float(slope), "se": se, "n": int(ok.sum())})
    df = pd.DataFrame(out)
    df["significant"] = df["rate_m_yr"].abs() > 1.96 * df["se"]
    return df
Reporting the standard error per transect turns a map of rates into a map of rates you can defend, and the significant column is usually the one a reviewer asks for.
Explanation
Why transects and not lengths or areas
Length is scale-dependent and therefore not comparable between sources. Area change between two shorelines is well defined but gives one number for a whole cell, hiding erosion in one place and accretion in another. Transects give a signed distance at a fixed location, which is what "the beach retreated 12 m" means and is what a time series needs.
Why the tidal correction is the dominant term
Horizontal position is the vertical offset divided by the beach slope. On a 2% slope — a typical sandy beach — a 0.5 m difference in water level is 25 m of horizontal shoreline position. Two images at different tide states therefore show an apparent change of tens of metres with nothing happening on the ground, which is larger than most real annual rates.
Why the baseline must be identical between comparisons
The measurement is a distance from the baseline, so a baseline that moves adds its own movement to every transect. That includes regenerating the baseline from one of the shorelines, which is a common shortcut and makes the first date's errors appear in every later measurement.
Why to report detectability rather than change
A map of change values with no uncertainty implies that every arrow is real. With a combined uncertainty of, say, 15 m, only transects whose change exceeds that are evidence of anything, and the fraction that do is a more honest summary than a mean rate.
Edge cases or notes
- Transects cross each other on a concave coast. Space them from a smoothed baseline.
- Multiple intersections need a rule. Nearest or furthest, applied consistently.
- Spits and inlets migrate along the coast, which transects perpendicular to it measure badly.
- Nourished beaches are not natural signals. Record intervention dates.
- A storm between surveys is an event, not a rate.
- Different sources mean different scales. Generalise both, or compare only like with like.
- Keep transect ids stable across every date, or the time series is meaningless.
- Vegetation lines and wet-dry lines are proxies, not datums; state which you digitised.
Internal links
- How to extract a coastline from a raster in Python — producing the lines to compare
- Tidal datums explained: which shoreline is the shoreline — the correction that dominates the budget
- The coastline paradox explained for GIS work — why not to compare lengths
- How to fetch and align tide gauge data in Python — getting the tide state at acquisition
- How to detect change between satellite images in Python — the raster approach
- How to measure distance accurately in Python — the distance underneath
- Sea level rise data explained — the longer-term signal
- Spatial data quality dimensions — building an uncertainty budget
FAQ
How do I measure shoreline change?
Cast transects perpendicular to a fixed baseline, measure where each shoreline crosses each transect, and difference the distances. Report the rate per year.
Can I just compare the two coastline lengths?
No. Length depends on the source scale, so two lengths from different sources are not comparable and neither is the difference.
What dominates the uncertainty?
Usually the tide state at acquisition. On a 2% beach slope, 0.5 m of water level is 25 m of horizontal position.
How do I handle a transect that crosses the shoreline twice?
Pick a rule — nearest crossing to the baseline, or furthest — apply it everywhere, and count how often it mattered.
How much change is real?
Only change larger than the combined positional uncertainty of both dates. Report the fraction of transects above that threshold.
Do I need more than two dates?
For a rate you can defend, yes. Three or more lets you fit a linear rate per transect and report its standard error.