
Tidal datums explained: which shoreline is the shoreline
Problem statement
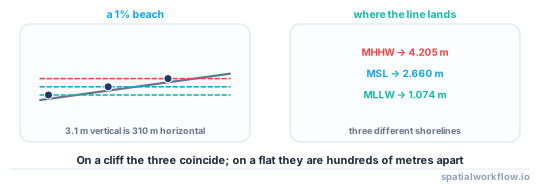
The coastline on your map is a line somebody chose. In a place with a three-metre tide it could be drawn at high water, at low water, at mean sea level or at the chart datum, and those lines can be hundreds of metres apart across a gently sloping beach.
That is not a mapping subtlety; it is the whole basis of coastal measurement. Area of a tidal flat, length of shoreline, distance from a building to the sea, whether a parcel is above the foreshore — all of them are answers to "at which datum?" and none of them is well defined without it.
This guide sets out the datums, shows real values from a tide gauge, and covers the conversion that trips people up most: tidal datums are local, and they are not heights in a national vertical datum.
Quick answer
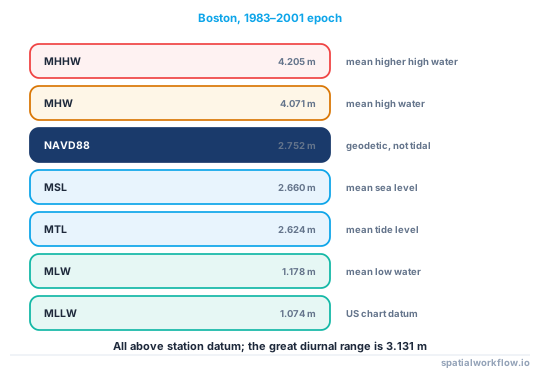
A tidal datum is a statistical surface derived from observations over a 19-year epoch. From the NOAA station at Boston, Massachusetts, over the 1983–2001 epoch:
| datum | metres above station datum |
|---|---|
| MHHW — mean higher high water | 4.205 |
| MHW — mean high water | 4.071 |
| MSL — mean sea level | 2.660 |
| MTL — mean tide level | 2.624 |
| MLW — mean low water | 1.178 |
| MLLW — mean lower low water | 1.074 |
| NAVD88 — national vertical datum | 2.752 |
The great diurnal range, MHHW − MLLW, is 3.131 m. A shoreline drawn at MHHW and one drawn at MLLW are separated by whatever horizontal distance 3.1 m of elevation covers — metres on a cliff, hundreds of metres on a flat.
Step-by-step solution
1. Know the datums you will meet
- MHHW / MHW — mean of the higher high waters, or of all high waters. The legal shoreline in much of the United States and the usual "coastline" on a topographic map.
- MSL / MTL — mean sea level over the epoch, and the midpoint of mean high and mean low water. Close but not identical.
- MLW / MLLW — the low-water equivalents. MLLW is the US chart datum.
- LAT / Chart Datum — lowest astronomical tide, the chart datum for most of the world outside the US.
- Station datum — an arbitrary local zero the gauge reports against.
- NAVD88 / ODN / NAP — national orthometric datums, defined geodetically rather than tidally.
2. Remember the epoch
A tidal datum is an average over a National Tidal Datum Epoch — currently 1983–2001 in the US. It is not the average of the last year, and it is updated infrequently, so published datums lag actual sea level where it is rising.
3. Do not assume a datum transfers between stations
Tidal datums are local because the tide is local. The range at one station tells you nothing about the range fifty kilometres along the coast, and a datum conversion published for one gauge does not apply at the next.
4. Convert through the geodetic datum, not by eye
Published datums include the offset to the national vertical datum — NAVD88 is 2.752 m above station datum at Boston, MHHW is 4.205 m, so MHHW is 1.453 m above NAVD88. That is the number you need to combine a tidal surface with a LiDAR DTM.
5. Check the units
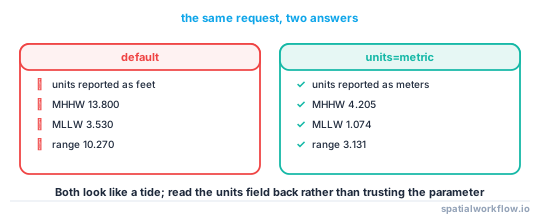
The NOAA metadata API returns datums in feet by default. The same request with units=metric returns metres. The values differ by a factor of 3.28 and both look plausible for a tide.
# default: feet
MHHW 13.800  MLLW 3.530  range 10.270
# units=metric
MHHW  4.205  MLLW 1.074  range  3.131
6. Choose the datum from the purpose
Navigation uses a low-water datum so charted depths are conservative. Legal boundaries usually use a high-water datum. Flood modelling uses a geodetic datum because that is what the terrain model is in. Habitat mapping uses whichever band it cares about.
7. Record the datum with every shoreline you produce
A coastline layer with no datum in its metadata is not reusable, and the difference between two vintages of the same coast is meaningless if they were drawn at different datums.
Code examples
Example 1 — fetch the published datums, in the units you asked for
import urllib.request, json

def datums(station, metric=True):
    url = (f"https://api.tidesandcurrents.noaa.gov/mdapi/prod/webapi/stations/"
           f"{station}/datums.json" + ("?units=metric" if metric else ""))
    with urllib.request.urlopen(url, timeout=60) as r:
        d = json.loads(r.read())
    return {"units": d.get("units"), "epoch": d.get("DatumAnalysisPeriod"),
            "values": {e["name"]: float(e["value"]) for e in d["datums"]}}

d = datums("8443970")
print(d["units"], d["epoch"])
v = d["values"]
print(f"great diurnal range MHHW−MLLW: {v['MHHW'] - v['MLLW']:.3f} m")
print(f"MHHW above NAVD88: {v['MHHW'] - v['NAVD88']:.3f} m")
meters ['01/01/1983 - 12/31/2001']
great diurnal range MHHW−MLLW: 3.131 m
MHHW above NAVD88: 1.453 m
Always read the units field back rather than trusting the parameter.
Example 2 — check the published datums against observed water levels
import urllib.request, json, pandas as pd

def water_levels(station, begin, end, datum="MLLW"):
    url = (f"https://api.tidesandcurrents.noaa.gov/api/prod/datagetter"
           f"?product=water_level&application=spatialworkflow-docs"
           f"&begin_date={begin}&end_date={end}&datum={datum}&station={station}"
           f"&time_zone=gmt&units=metric&format=json")
    with urllib.request.urlopen(url, timeout=120) as r:
        raw = json.loads(r.read())
    df = pd.DataFrame(raw["data"])
    df["t"] = pd.to_datetime(df["t"], utc=True)
    df["v"] = pd.to_numeric(df["v"], errors="coerce")
    return df.dropna(subset=["v"]).set_index("t")

wl = water_levels("8443970", "20260101", "20260131")
daily = wl["v"].resample("1D")
print(f"{len(wl):,} six-minute observations")
print(f"above MLLW: min {wl.v.min():.2f} m, max {wl.v.max():.2f} m, "
      f"monthly range {wl.v.max() - wl.v.min():.2f} m")
print(f"mean daily high {daily.max().mean():.2f} m, mean daily low {daily.min().mean():.2f} m")
print(f"mean daily range {(daily.max() - daily.min()).mean():.2f} m, "
      f"spring/neap spread {(daily.max()-daily.min()).max() - (daily.max()-daily.min()).min():.2f} m")
7,440 six-minute observations
above MLLW: min -0.38 m, max 3.80 m, monthly range 4.18 m
mean daily high 3.24 m, mean daily low 0.04 m
mean daily range 3.19 m, spring/neap spread 1.82 m
The observed mean daily range of 3.19 m matches the published 3.131 m to within the month-to-month variation, which is the check worth doing before trusting either.
Example 3 — convert a tidal surface into the datum your DTM uses
def to_geodetic(value_m, station_datums, from_datum, to_datum="NAVD88"):
    """Convert a height between datums published for the same station."""
    v = station_datums["values"]
    return value_m + v[from_datum] - v[to_datum]

# MHHW expressed in NAVD88, which is what a LiDAR DTM is usually in
mhhw_navd88 = to_geodetic(0.0, d, "MHHW", "NAVD88")
print(f"MHHW is {mhhw_navd88:+.3f} m NAVD88")
MHHW is +1.453 m NAVD88
This is the conversion that lets a tidal shoreline be cut from a terrain model: threshold the DTM at +1.453 m rather than at 0.
Explanation
Why tidal datums are statistical, not physical
There is no surface in the sea at "mean high water" — it is the average of the observed high waters over a 19-year epoch, chosen because 18.6 years is the period of the lunar nodal cycle. That means the datum is only as good as the record, it is local to the gauge, and it drifts as sea level changes.
Why MSL and MTL differ
Mean sea level is the average of all observations; mean tide level is the midpoint of mean high water and mean low water. In a symmetric tide they coincide. Where the tide is asymmetric — a fast flood and a slow ebb, or strong shallow-water harmonics — they do not, and at Boston they differ by 0.036 m.
Why the shoreline moves so far horizontally
Horizontal displacement is the vertical range divided by the slope. A 3.1 m range on a beach sloping at 1% moves the waterline 310 m; on a 45° cliff it moves it 3.1 m. That is why tidal flats and estuaries are where datum choice dominates every area calculation, and cliffs are where it does not matter.
Why chart datum is not mean sea level
A chart exists so a mariner does not run aground. Charted depths are therefore referenced to a low-water surface — LAT in most of the world, MLLW in the US — so that the actual depth is almost always greater than charted. Using charted depths as if they were relative to mean sea level understates the water column by roughly half the tidal range.
Edge cases or notes
- The epoch is not the present. Published datums lag current sea level where it is rising.
- Datums are per station. Do not interpolate them across a complex coast.
- The NOAA datums API defaults to feet. Read the
unitsfield back. - LAT and MLLW are different. They can differ by tens of centimetres.
- Meteorological surge is not in a tidal datum. Storm levels exceed MHHW routinely.
- Some places are effectively non-tidal. In the Baltic and the Mediterranean, wind dominates.
- River gauges use other datums entirely. Do not mix them with coastal ones.
- Record the datum in the metadata. A shoreline without one cannot be compared.
Internal links
- Bathymetry explained: depths, datums and grids — the sign and datum questions offshore
- How to fetch and align tide gauge data in Python — working with the observations
- Tide times are off by hours after a join — the time half of the problem
- The coastline paradox explained for GIS work — the other reason a coastline length is not a number
- How to extract a coastline from a raster in Python — drawing the line at a chosen datum
- Vertical datums explained — the geodetic side
- How to map coastal inundation from a DEM in Python — where the conversion is needed
- How to measure shoreline change between two dates — why both vintages need the same datum
FAQ
What is a tidal datum?
A statistical surface derived from tide gauge observations over a 19-year epoch — mean high water, mean sea level, mean lower low water and so on. It is local to the station.
Which datum is "the coastline"?
Whichever the producer chose. Topographic maps often use a high-water datum, nautical charts a low-water one, and flood models a geodetic datum.
How far apart are the high-water and low-water shorelines?
The vertical range divided by the slope. A 3.1 m range on a 1% beach is 310 m; on a cliff it is 3.1 m.
How do I convert a tidal datum to a national vertical datum?
Through the published offsets for the same station. At Boston, MHHW is 4.205 m and NAVD88 is 2.752 m above station datum, so MHHW is 1.453 m NAVD88.
Why does my datum value look ten times too big?
The NOAA metadata API returns feet unless you ask for metric. MHHW at Boston is 13.800 ft or 4.205 m.
Can I use one station's datums along the whole coast?
No. Tidal range varies rapidly along a coast, and a conversion published for one gauge does not apply at the next.