
An inundation map floods inland areas that cannot flood
Problem statement
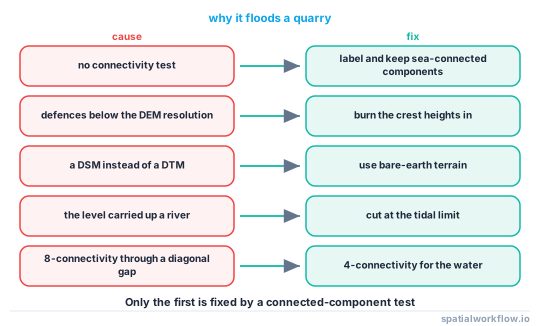
The sea-level map shows water in a quarry twenty kilometres inland, in a drained polder behind a dike, and in every road cutting and gravel pit in the county. All of them are below the level. None of them can flood from the sea.
The cause is that a threshold has no concept of connectivity: dem <= level is true for every cell below the level regardless of whether water can reach it. On a coarse test over the Netherlands, thresholding at 0 m marked 19,067 cells as flooded, of which 497 cells in 79 separate pockets had no path to the sea.
A related and less fixable problem sits behind it: even the connected cells include everything behind a defence the terrain model does not resolve.
Quick answer
Label the below-threshold mask and keep only the components connected to the sea:
import numpy as np
from scipy import ndimage

below = (dem <= level).filled(False)
labels, n = ndimage.label(below)                      # 4-connectivity by default

edge = set(labels[0, :]) | set(labels[-1, :]) | set(labels[:, 0]) | set(labels[:, -1])
edge.discard(0)
connected = np.isin(labels, list(edge))

print(f"bathtub {below.sum():,}, connected {connected.sum():,}, "
      f"isolated {below.sum() - connected.sum():,} in {n - len(edge):,} pockets")
bathtub 19,067, connected 18,570, isolated 497 in 79 pockets
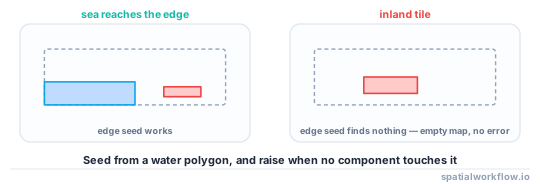
Seeding from the array edge assumes the sea reaches it. Where it does not — an inland tile, a study area cut short of the coast — seed from a polygon of known open water instead, or every component is isolated and the map is empty.
Step-by-step solution
1. Confirm it is a connectivity problem
Label the mask and look at where the isolated components are. Quarries, pits, polders and cuttings with no path to the sea are the signature. If the flooded area is a continuous sheet reaching inland along a valley, the problem is something else.
2. Apply the connected-component filter
One ndimage.label call and a set of seed labels. It is the cheapest correction in coastal mapping and it should be in every pipeline.
3. Seed from the sea, not from the array edge
The edge shortcut works only when the sea touches the raster boundary. A polygon of open water — a coastline layer, an ocean mask, a manually drawn seed — is correct everywhere.
4. Use 4-connectivity for the water
Under 8-connectivity, water passes diagonally between cells that touch only at a corner, so a one-cell barrier with a diagonal step in it does not hold. Water does not flow through a corner.
5. Burn in the defences
This is the part a connectivity test cannot fix. A dike or seawall two to three metres wide is under-represented in a DEM produced at one to two metres with smoothing, so the terrain shows a gap where a wall stands. Rasterise the defence lines at their crest height, buffered by at least one cell, and take the maximum with the DEM.
6. Check the tidal limit up rivers
The sea reaches inland along estuaries, and a threshold carries it all the way to the head of the catchment. Cut the water surface at the tidal limit, or use a sloping water surface rather than a flat one.
7. Report the isolated pockets separately
They are genuinely below the level. They may flood from rainfall or groundwater, and dropping them without saying so hides a real result.
Code examples
Example 1 — a connectivity filter with a proper seed
import numpy as np, rasterio, geopandas as gpd
from rasterio.features import rasterize
from scipy import ndimage

def connected_inundation(dem, transform, shape, level, sea=None, connectivity=4):
    below = np.asarray(dem <= level)
    structure = None if connectivity == 4 else np.ones((3, 3), dtype=int)
    labels, n = ndimage.label(below, structure=structure)

    if sea is not None:
        seed_mask = rasterize([sea], out_shape=shape, transform=transform,
                              fill=0, default_value=1, dtype="uint8").astype(bool)
        seeds = set(np.unique(labels[seed_mask & below]))
    else:
        seeds = (set(labels[0, :]) | set(labels[-1, :])
                 | set(labels[:, 0]) | set(labels[:, -1]))
    seeds.discard(0)

    if not seeds:
        raise ValueError("no flooded component touches the sea — check the seed")

    connected = np.isin(labels, list(seeds))
    return connected, {
        "components": int(n), "seeded_components": len(seeds),
        "bathtub_cells": int(below.sum()), "connected_cells": int(connected.sum()),
        "isolated_cells": int(below.sum() - connected.sum()),
        "isolated_pockets": int(n - len(seeds)),
    }
Raising when no component touches the seed is the important line: an empty map is a failure that otherwise looks like "nothing floods".
Example 2 — how much connectivity matters at different levels
import numpy as np
from scipy import ndimage

for level in (0, 1, 2, 5):
    below = dem <= level
    labels, n = ndimage.label(below)
    edge = (set(labels[0, :]) | set(labels[-1, :])
            | set(labels[:, 0]) | set(labels[:, -1]))
    edge.discard(0)
    connected = np.isin(labels, list(edge))
    print(f"level {level:>2} m: bathtub {below.sum():6,} ({below.mean():5.1%}), "
          f"connected {connected.sum():6,} ({connected.mean():5.1%}), "
          f"isolated {below.sum()-connected.sum():5,} in {n-len(edge):,} pockets")
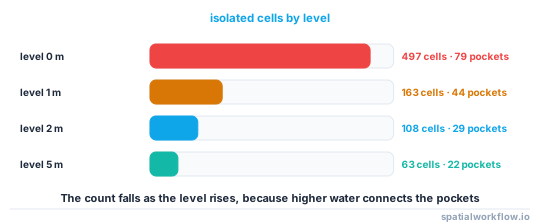
level 0 m: bathtub 19,067 (41.7%), connected 18,570 (40.6%), isolated 497 in 79 pockets
level 1 m: bathtub 21,678 (47.4%), connected 21,515 (47.0%), isolated 163 in 44 pockets
level 2 m: bathtub 23,196 (50.7%), connected 23,088 (50.5%), isolated 108 in 29 pockets
level 5 m: bathtub 25,310 (55.3%), connected 25,247 (55.2%), isolated 63 in 22 pockets
The isolated count falls as the level rises, because higher water connects pockets to each other and to the sea. The grid here is one arc-minute — about 1.85 km — which is far too coarse for a real inundation study; it shows the mechanism, not the answer.
Example 3 — burn in the defences and see what changes
import numpy as np, geopandas as gpd
from rasterio.features import rasterize

def burn_defences(dem, transform, shape, defences, crest_col="crest_m", buffer_cells=1):
    cell = abs(transform.a)
    burn = rasterize(
        ((g.buffer(buffer_cells * cell), h)
         for g, h in zip(defences.geometry, defences[crest_col])),
        out_shape=shape, transform=transform, fill=np.nan, dtype="float32")
    return np.fmax(np.asarray(dem), burn)

before, _ = connected_inundation(dem, transform, dem.shape, level, sea=sea_poly)
after, _ = connected_inundation(
    burn_defences(dem, transform, dem.shape, defences), transform, dem.shape,
    level, sea=sea_poly)

print(f"flooded cells before defences {before.sum():,}, after {after.sum():,} "
      f"({after.sum()/before.sum()-1:+.1%})")
On a defended coast the difference is large, and it is the single biggest correction available after connectivity.
Explanation
Why a threshold has no memory of the sea
dem <= level is evaluated per cell with no reference to any other cell. Every quarry, pit, polder and cutting below the level satisfies it. Connectivity is the missing constraint, and expressing it as a connected-component label is both the standard solution and a single function call.
Why the seed choice is the part that goes wrong
Seeding from the array edge is convenient and wrong for any tile the sea does not reach — an inland study area, a clipped extract, a tile in the middle of a coastline mosaic. The symptom is an empty map, which is easy to misread as "nothing floods at this level". Seeding from an explicit water polygon makes the assumption visible.
Why 4-connectivity is the conservative choice
With 8-connectivity, two cells that share only a corner are connected, so water passes through a diagonal gap in a one-cell wall. Physically it does not. The standard asymmetry in flood modelling is 4-connectivity for the water and 8-connectivity for the barriers, so a diagonal step in a dike still holds.
Why defences are the harder half
A connectivity test uses only the DEM, and the DEM does not contain the wall. Adding the defences needs a separate layer with crest heights, which many places do not publish, and even with it a still-water map cannot represent overtopping, breaching or drainage. That is the honest limit: a connected fill answers "what is below the level and reachable from the sea", not "what floods".
Edge cases or notes
- Culverts and sluices connect where the terrain does not. Burn them as low cells.
- Nodata acts as a barrier. Mask it, or the flood stops at the tile edge.
- A DSM floods around buildings. Use a DTM.
- The tidal limit up a river is not the same as the level everywhere.
- Isolated pockets may still flood from rainfall or groundwater.
- A diagonal gap in a dike holds under 4-connectivity and not under 8.
- Report the level, the datum and the method with the extent.
- Present a band, not a line. DEM error is a large fraction of a half-metre scenario.
Internal links
- How to map coastal inundation from a DEM in Python — the full workflow
- Sea level rise data explained — assembling the level
- Tidal datums explained: which shoreline is the shoreline — the datum the level is in
- How to fill sinks and compute flow direction in Python — depressions from the hydrological side
- Height above nearest drainage explained — a better proxy for fluvial flooding
- How to extract a coastline from a raster in Python — the same connectivity rule
- How to rasterize a vector layer in Python — burning in defences
- Digital elevation models explained — DTM versus DSM
FAQ
Why does my sea-level map flood a quarry inland?
Because a threshold has no connectivity. Label the below-threshold mask and keep only components that reach the sea.
How do I seed the connectivity test?
From a polygon of known open water. Seeding from the array edge works only if the sea touches the raster boundary.
Why is my connected map empty?
Because no below-threshold component touched the seed — usually an inland tile with an edge-based seed. Raise rather than returning an empty map.
Should I use 4- or 8-connectivity?
Four for the water. Under 8-connectivity, water passes diagonally through a one-cell gap in a wall.
Why does water still appear behind the sea wall?
Because the wall is narrower than a DEM cell and was smoothed away. Rasterise the defences at their crest height, buffered by at least one cell.
What about the isolated pockets?
Report them. They are genuinely below the level and may flood from rainfall or groundwater, just not from the sea.