
How to Chart Disaster Declarations Over Time by Incident Type
On this page
Problem statement
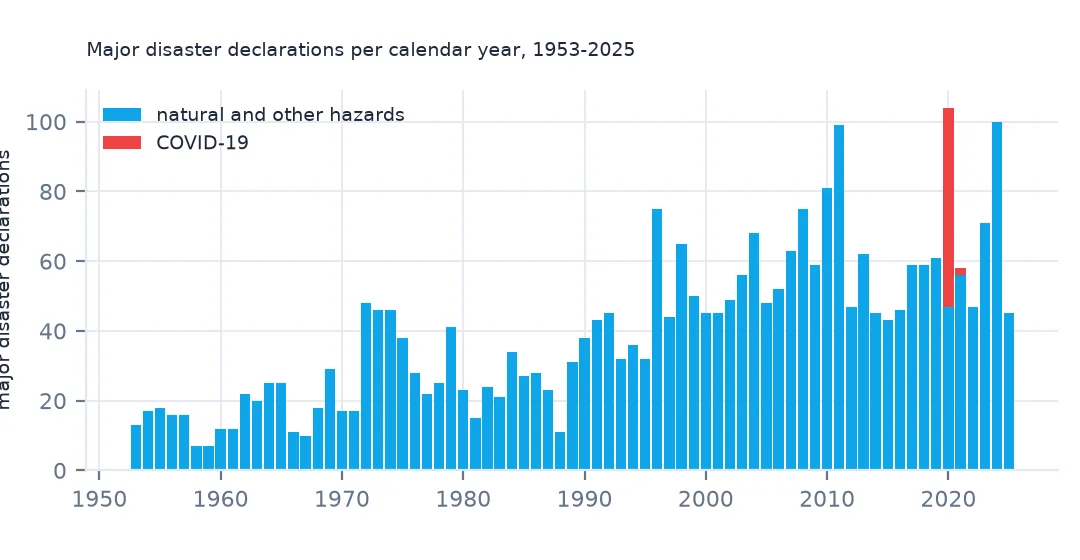
Are there more federal disasters than there used to be? The number of major disaster declarations per year has risen fivefold since the 1950s, and charts of it are often read as a direct measure of worsening hazards. But declarations are administrative decisions, the rules for them changed, and a single pandemic produced more declarations in 2020 than any natural event. This page charts major disaster declarations by year and incident type from OpenFEMA, shows the fiscal-year trap, and separates the change in how many counties each declaration covers from the change in how many declarations there are.
Quick answer
Deduplicate to one row per disasterNumber, keep declarationType == "DR", take the calendar year from declarationDate, and group by year and a grouped incident type. Show COVID-19 (Biological) separately, and read the trend alongside the policy changes that drive it.
decl = dds.drop_duplicates("disasterNumber").copy()
decl["year"] = decl.declarationDate.dt.year
dr = decl[(decl.declarationType == "DR") & decl.year.between(1953, 2025)]
per_year = dr.groupby("year").size()
print("major disaster declarations per year, by decade (mean):", per_year.groupby(per_year.index // 10 * 10).mean().round(1).to_dict())
major disaster declarations per year, by decade (mean): {1950: 13.4, 1960: 18.4, 1970: 32.8, 1980: 23.7, 1990: 46.0, 2000: 56.0, 2010: 60.2, 2020: 70.8}
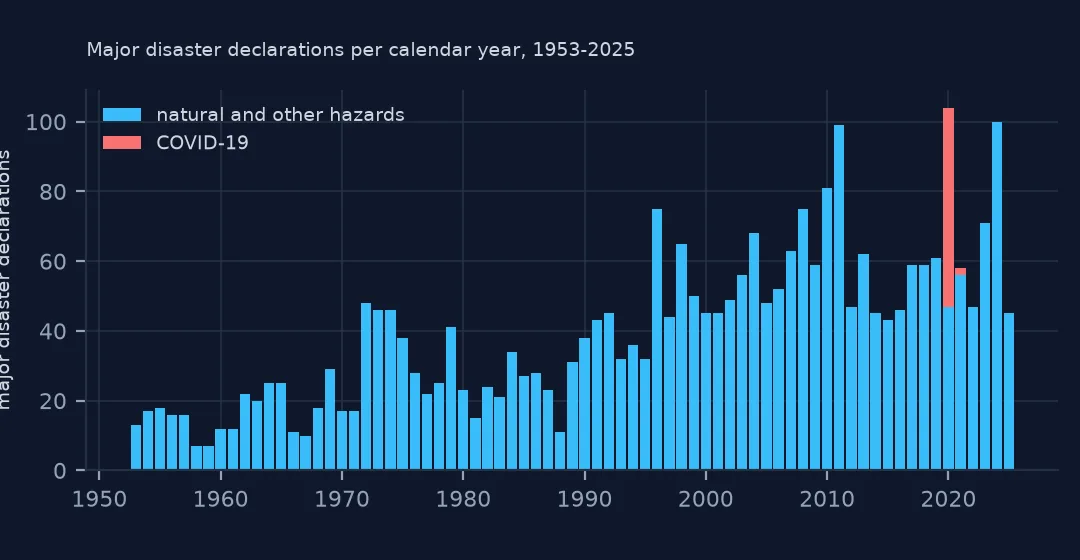
Major disaster declarations averaged 13.4 a year in the 1950s, 32.8 in the 1970s, 46.0 in the 1990s and 70.8 in the 2020s so far.
Years, incident types and designated areas
1. Calendar year, not fiscal year
fy = dr.groupby("fyDeclared").size()
print("2024 and 2025 by calendar year:", per_year.loc[2024:2025].to_dict(), "by fiscal year:", fy.loc[2024:2025].to_dict())
2024 and 2025 by calendar year: {2024: 100, 2025: 45} by fiscal year: {2024: 88, 2025: 61}
Calendar year 2024 had 100 major disasters and 2025 had 45. By fiscal year the same declarations give 88 and 61, because declarations made in October to December 2024 count in fiscal 2025. Neither is wrong, but mixing them, or comparing with a series that uses the other, moves dozens of declarations between years.
2. Group the incident types
grp = {"Severe Storm": "storms", "Tornado": "storms", "Severe Ice Storm": "winter", "Snowstorm": "winter", "Winter Storm": "winter",
       "Freezing": "winter", "Hurricane": "tropical", "Tropical Storm": "tropical", "Typhoon": "tropical", "Coastal Storm": "tropical",
       "Flood": "flood", "Fire": "fire", "Biological": "biological"}
dr = dr.assign(group=dr.incidentType.map(grp).fillna("other"))
tab = dr.groupby([dr.year // 10 * 10, "group"]).size().unstack(fill_value=0)
print(tab.loc[1960:].to_string())
group biological fire flood other storms tropical winter
year
1960 0 3 115 16 25 23 2
1970 0 3 231 9 59 14 12
1980 0 8 131 7 51 33 7
1990 0 9 116 14 209 73 39
2000 0 15 23 10 410 66 36
2010 0 18 134 15 314 78 43
2020 59 22 78 14 164 59 29
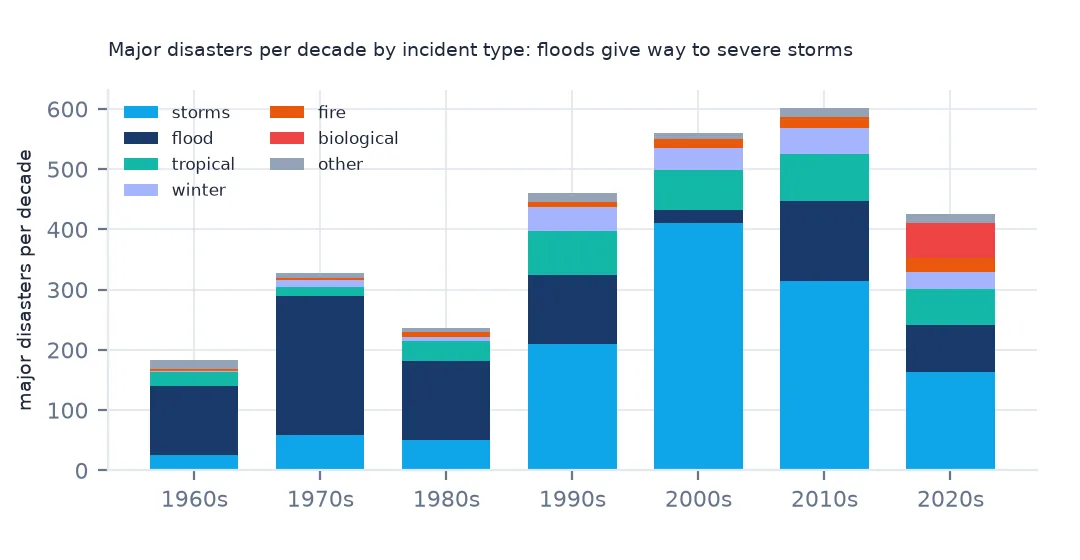
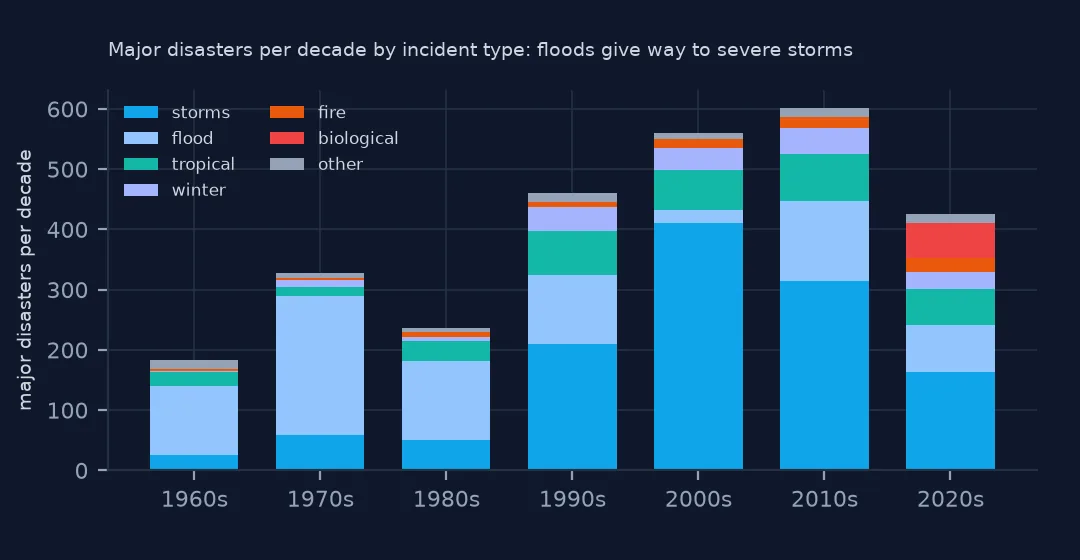
The mix of incidents has shifted. Floods were the leading declared type in the 1960s to 1980s (231 in the 1970s), then severe storms took over: 410 in the 2000s against 23 floods. That is partly reclassification: since the 1990s FEMA has usually recorded combined storm-and-flood events as severe storms, with flooding listed among the designated incident types. Treat storms and floods as one family when comparing decades. The 2020s add 59 biological (COVID-19) major disasters.
3. Counties per declaration
area = dds[dds.declarationType == "DR"].drop_duplicates(["disasterNumber", "fipsStateCode", "fipsCountyCode"]).groupby("disasterNumber").size()
dr = dr.assign(areas=dr.disasterNumber.map(area))
print("median designated areas per major disaster, by decade:", dr.groupby(dr.year // 10 * 10).areas.median().to_dict())
median designated areas per major disaster, by decade: {1950: 1.0, 1960: 1.0, 1970: 7.0, 1980: 5.0, 1990: 10.0, 2000: 11.0, 2010: 9.0, 2020: 9.0}
Declarations also got wider. The median major disaster designated a single area in the 1950s and 1960s, 7 in the 1970s and 9–11 since the 1990s. More declarations, each covering more counties, multiply into many more county designations. A county map of declaration counts is therefore much more sensitive to this change than a national count of declarations.
Seasons and record years
The data used on this page
FEMA's Disaster Declarations Summaries from OpenFEMA, saved on this site on 15 October 2026.
from pathlib import Path

import geopandas as gpd
import numpy as np
import pandas as pd
import requests

Path("data").mkdir(exist_ok=True)
# OpenFEMA, queried on 15 October 2026 and saved on this site because both datasets are revised continually:
# DisasterDeclarationsSummaries v2 (every declaration since 1953, one row per designated area) and NfipClaims v3
# (flood insurance claims with a loss in 2017 or later, 29 fields). The queries are in data/README.txt; the live API is
# https://www.fema.gov/api/open/v2/DisasterDeclarationsSummaries and https://www.fema.gov/api/open/v3/NfipClaims
FILES = ["fema-disaster-declarations-2026-10-15.zip", "nfip-claims-2017-2026-2026-10-15.zip"]
for name in FILES:
    if not Path(f"data/{name}").exists():
        Path(f"data/{name}").write_bytes(requests.get(f"https://data.spatialworkflow.io/{name}", timeout=600).content)
dds = pd.read_csv("data/fema-disaster-declarations-2026-10-15.zip", dtype={"fipsStateCode": str, "fipsCountyCode": str, "placeCode": str},
                  parse_dates=["declarationDate", "incidentBeginDate", "incidentEndDate"])
print(f"OpenFEMA: {len(dds):,} declaration rows for {dds.disasterNumber.nunique():,} declarations, "
      f"{dds.declarationDate.min():%Y}-{dds.declarationDate.max():%Y}")
OpenFEMA: 70,567 declaration rows for 5,281 declarations, 1953-2026
Example 1: seasons of declaration
inc = dr.assign(month=dr.incidentBeginDate.dt.month)
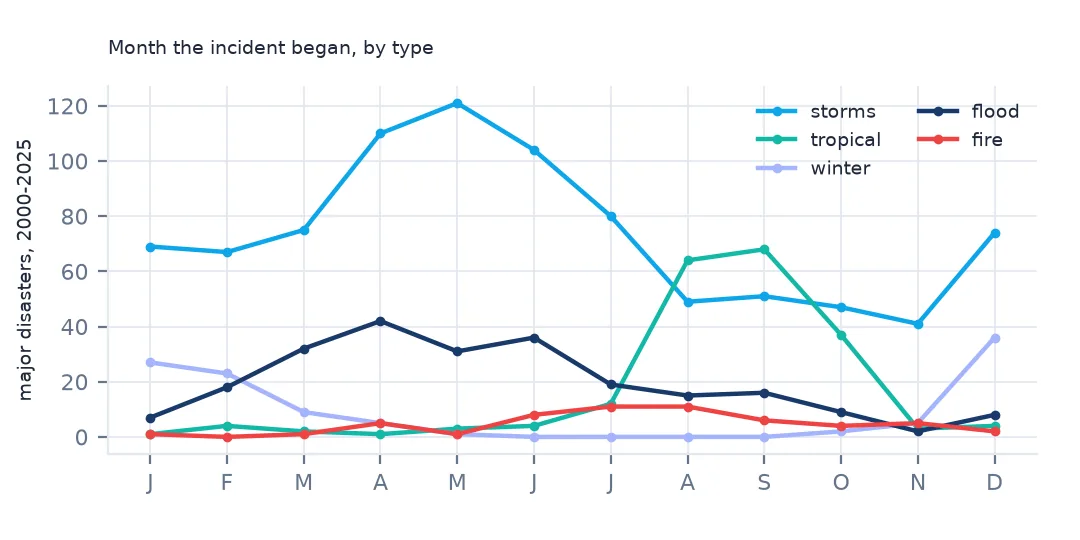
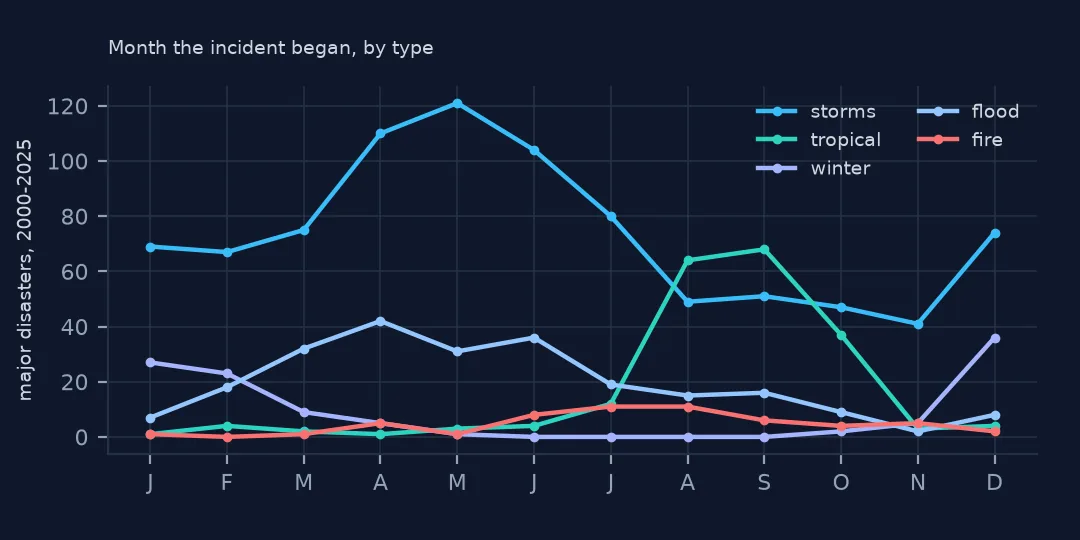
print(inc[inc.year >= 2000].pivot_table(index="month", columns="group", values="disasterNumber", aggfunc="count", fill_value=0)[["storms", "tropical", "winter", "flood", "fire"]].to_string())
group storms tropical winter flood fire
month
1 69 1 27 7 1
2 67 4 23 18 0
3 75 2 9 32 1
4 110 1 5 42 5
5 121 3 1 31 1
6 104 4 0 36 8
7 80 12 0 19 11
8 49 64 0 15 11
9 51 68 0 16 6
10 47 37 2 9 4
11 41 3 5 2 5
12 74 4 36 8 2
Since 2000, declared severe storms begin most often in April and May (110 and 121), tropical events in August and September, and winter events in December and January. Floods peak in spring with snowmelt and rain. The calendar of declarations follows the calendar of hazards, with a lag of a few weeks for the declaration itself.
Example 2: years with the most
print(per_year.sort_values(ascending=False).head(6).to_dict())
print(f"2020 without COVID-19: {(dr[(dr.year == 2020)].incidentType != 'Biological').sum()}")
{2020: 104, 2024: 100, 2011: 99, 2010: 81, 2008: 75, 1996: 75}
2020 without COVID-19: 47
2020 had the most major disasters (104), but only 47 of them were not COVID-19. 2024 had 100, the highest for natural hazards alone, ahead of 2011 (99) and 2010 (81).
Why the count rose
Several things raised the count besides hazards. The Stafford Act of 1988 broadened what qualified. FEMA judges requests against a per-capita damage indicator, a dollar amount of public damage per resident that a state must exceed. It was set in 1986 and not adjusted for inflation until 1999, so for more than a decade the same real damage qualified more and more easily. Exposure grew too, with more people and property in floodplains and on coasts. Political and administrative practice also plays a part: studies find more declarations in presidential election years and in swing states.
Climate change may well be part of the trend, especially in heavy-rain floods and fire. But the declaration count cannot isolate it. For hazard trends, use physical records (Storm Events, streamflow, fire perimeters) and use declarations to study federal response.
Charting choices
- One row per
disasterNumber. Counting rows makes 2020 look like an order of magnitude more disasters. - Calendar or fiscal year, and say which.
- Exclude emergencies and fire management unless the question is about them; their rules and history differ.
- The current year is incomplete. Late-year storms are declared weeks later, so the latest year is always low.
Internal links
- FEMA disaster declarations explained — what DR, EM and FM mean
- How to map FEMA disaster declarations — the same data by county
- Disaster counts too high — rows against declarations
FAQ
How many major disaster declarations are there per year?
In the 2020s an average of 70.8 a year, against 13.4 in the 1950s, from OpenFEMA's declarations by calendar year.
Which year had the most FEMA disaster declarations?
2020, with 104 major disasters, most of them COVID-19. Without COVID-19, 2024 had the most, 100.