
How Many Flood Insurance Claims Come from Outside the Flood Zone?
On this page
Problem statement
FEMA's flood maps draw a Special Flood Hazard Area, the zone with at least a 1% chance of flooding each year, and the mortgage rules, building codes and public debate all revolve around that line. A common claim is that a quarter or more of flood insurance claims come from outside it. The NFIP claims file can test that, since each claim records the flood zone used to rate the policy and the zone the building is in today. This page measures the share of claims and payments by zone since 2017, by hurricane and by state, and shows why the answer depends so much on the year.
Quick answer
Classify ratedFloodZone by its first letter: A and V are inside the Special Flood Hazard Area; X, B and C are outside; D is undetermined. Then compute the share of claims and of payments in each class, overall and by floodEvent.
def zone_class(z):
    z = z.fillna("").str.upper()
    return np.select([z.str.startswith("V"), z.str.startswith("A"), z.str.match(r"^(X|B|C)")], ["V (coastal high hazard)", "A (special flood hazard)", "X, B or C (outside)"], "D or unknown")


nfip["zone"] = zone_class(nfip.ratedFloodZone)
nfip["paid"] = nfip.netBuildingPaymentAmount.fillna(0) + nfip.netContentsPaymentAmount.fillna(0)
t = nfip.groupby("zone").agg(claims=("id", "size"), paid=("paid", "sum"))
print((t / t.sum()).round(3).to_string())
claims paid
zone
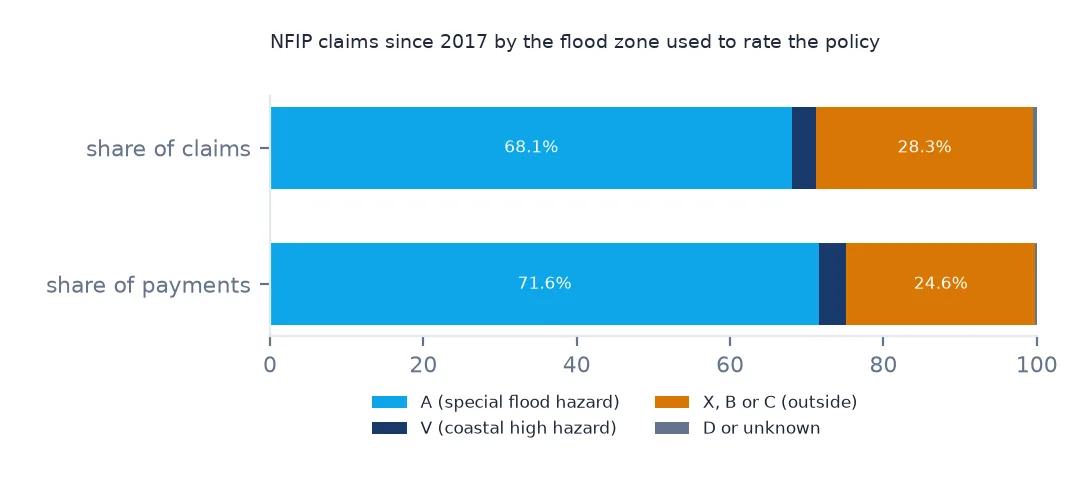
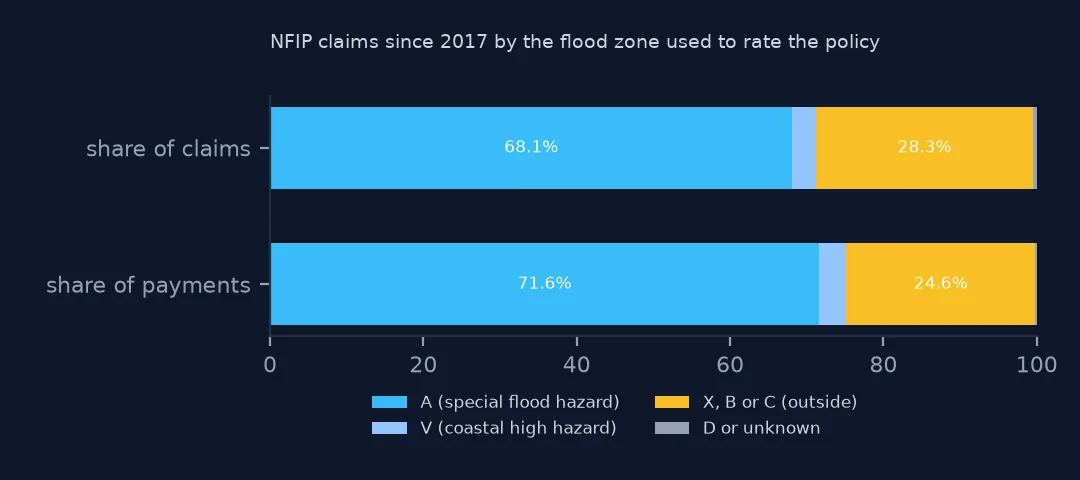
A (special flood hazard) 0.681 0.716
D or unknown 0.005 0.002
V (coastal high hazard) 0.031 0.035
X, B or C (outside) 0.283 0.246
Since 2017, 28.3% of claims and 24.6% of payments came from buildings rated outside the hazard area (X, B or C). Most came from A zones (68.1% of claims), and coastal V zones made 3.1%. About a quarter of insured flood losses happen where the official map shows moderate or minimal risk.
Rated zones, current zones, events and states
1. Rated zone and current zone
nfip["zone_now"] = zone_class(nfip.floodZoneCurrent)
print(f"current zone known: {nfip.floodZoneCurrent.notna().mean():.1%}")
print(pd.crosstab(nfip.zone, nfip.zone_now, normalize="index").round(3).to_string())
current zone known: 87.7%
zone_now A (special flood hazard) D or unknown V (coastal high hazard) X, B or C (outside)
zone
A (special flood hazard) 0.831 0.143 0.015 0.011
D or unknown 0.017 0.978 0.002 0.003
V (coastal high hazard) 0.106 0.160 0.727 0.007
X, B or C (outside) 0.071 0.058 0.003 0.868
The current zone is known for 87.7% of claims, and maps change. 7.1% of claims rated in X are in an A zone on today's map, and 10.6% of V-zone claims have moved to A. Use the rated zone to ask how the policy was priced, and the current zone to ask what today's map says about the same places.
2. By event
ev = nfip[nfip.floodEvent.isin(["Hurricane Harvey", "Hurricane Ian", "Hurricane Helene", "Hurricane Ida", "Hurricane Milton", "Hurricane Irma"])]
print(pd.crosstab(ev.floodEvent, ev.zone, normalize="index").round(3)[["A (special flood hazard)", "V (coastal high hazard)", "X, B or C (outside)"]].to_string())
zone A (special flood hazard) V (coastal high hazard) X, B or C (outside)
floodEvent
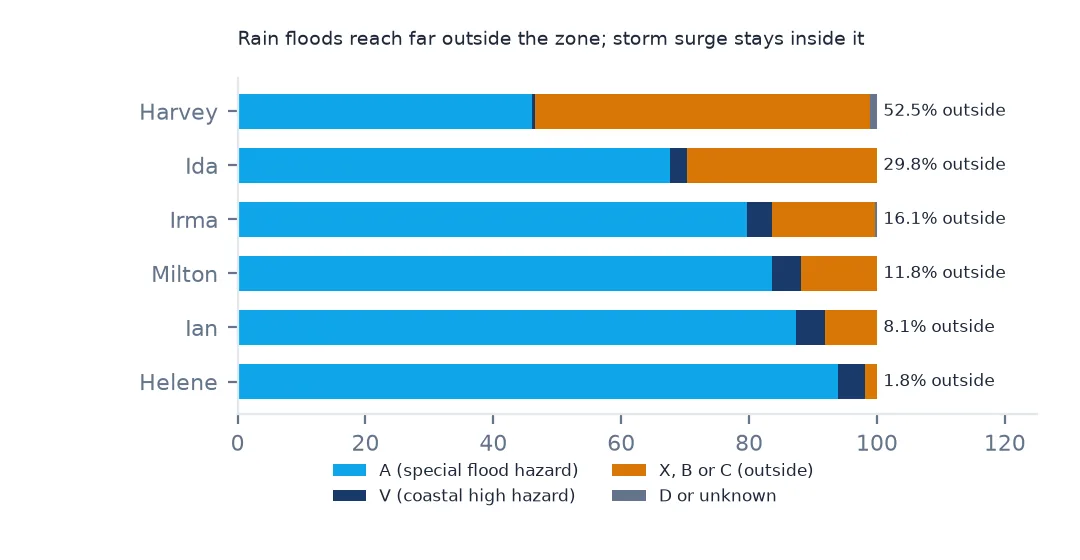
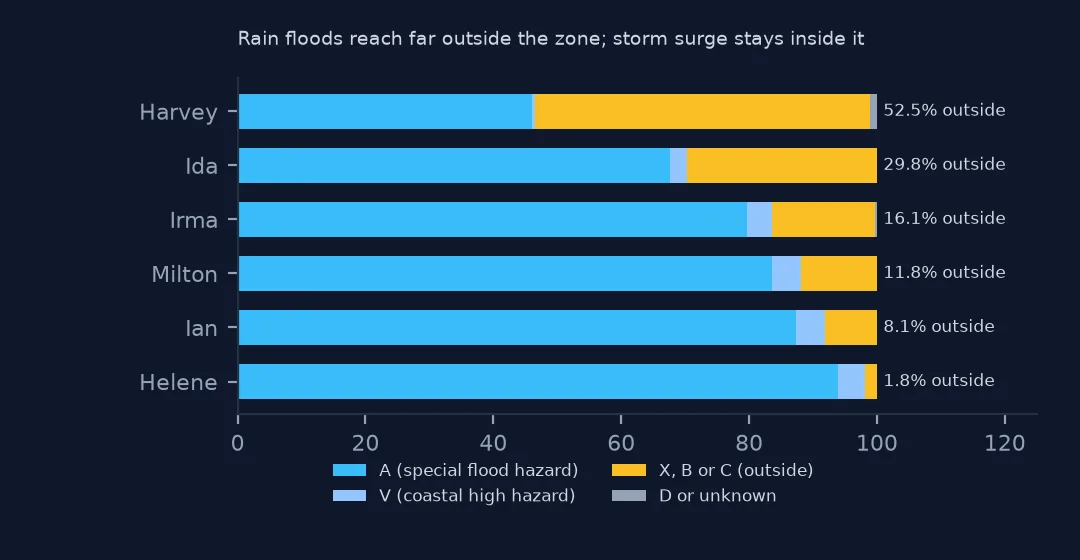
Hurricane Harvey 0.460 0.005 0.525
Hurricane Helene 0.939 0.043 0.018
Hurricane Ian 0.874 0.045 0.081
Hurricane Ida 0.676 0.027 0.298
Hurricane Irma 0.796 0.040 0.161
Hurricane Milton 0.836 0.046 0.118
The share outside the zone depends on the kind of flood. More than half of Harvey's claims (52.5%) came from X zones: extreme rain flooded Houston neighbourhoods far from any mapped floodplain. Ida (29.8%) behaves similarly. Storm-surge hurricanes are the opposite: only 1.8% of Helene's claims and 8.1% of Ian's came from outside the zone, because surge stays within the coastal zones the maps are built around.
3. By state
s = nfip.groupby("state").agg(claims=("id", "size"), outside=("zone", lambda z: (z == "X, B or C (outside)").mean()))
print(s[s.claims >= 2000].sort_values("outside", ascending=False).round(3).head(8).to_string())
claims outside
state
TX 124721 0.551
VA 3123 0.459
MD 2720 0.439
NY 11946 0.387
WI 2097 0.362
LA 36136 0.361
CA 7096 0.347
OH 2933 0.339
Among states with at least 2,000 claims, Texas has the highest share outside the zone (55.1%), followed by Virginia, Maryland and New York, where heavy rain and urban drainage cause much of the flooding. Rain-driven flooding fills streets and basements regardless of the map. The map's line is drawn for rivers and the coast.
Size of claims and year-to-year swings
The data used on this page
FEMA's NFIP Redacted Claims (version 3) from OpenFEMA, every claim with a loss in 2017 or later, saved on this site on 15 October 2026.
from pathlib import Path

import geopandas as gpd
import numpy as np
import pandas as pd
import requests

Path("data").mkdir(exist_ok=True)
# OpenFEMA, queried on 15 October 2026 and saved on this site because both datasets are revised continually:
# DisasterDeclarationsSummaries v2 (every declaration since 1953, one row per designated area) and NfipClaims v3
# (flood insurance claims with a loss in 2017 or later, 29 fields). The queries are in data/README.txt; the live API is
# https://www.fema.gov/api/open/v2/DisasterDeclarationsSummaries and https://www.fema.gov/api/open/v3/NfipClaims
FILES = ["fema-disaster-declarations-2026-10-15.zip", "nfip-claims-2017-2026-2026-10-15.zip"]
for name in FILES:
    if not Path(f"data/{name}").exists():
        Path(f"data/{name}").write_bytes(requests.get(f"https://data.spatialworkflow.io/{name}", timeout=600).content)
dds = pd.read_csv("data/fema-disaster-declarations-2026-10-15.zip", dtype={"fipsStateCode": str, "fipsCountyCode": str, "placeCode": str},
                  parse_dates=["declarationDate", "incidentBeginDate", "incidentEndDate"])
nfip = pd.read_csv("data/nfip-claims-2017-2026-2026-10-15.zip", low_memory=False, dtype={"countyCode": str, "reportedZipCode": str},
                   parse_dates=["dateOfLoss"])
print(f"OpenFEMA: {len(dds):,} declaration rows for {dds.disasterNumber.nunique():,} declarations, "
      f"{dds.declarationDate.min():%Y}-{dds.declarationDate.max():%Y}")
OpenFEMA: 70,567 declaration rows for 5,281 declarations, 1953-2026
Example 1: are outside-zone claims smaller?
print(nfip.groupby("zone").paid.median().round(0).to_dict())
print(nfip.groupby("zone").waterDepth.median().to_dict())
{'A (special flood hazard)': 23933.0, 'D or unknown': 33300.0, 'V (coastal high hazard)': 10192.0, 'X, B or C (outside)': 16860.0}
{'A (special flood hazard)': 1.0, 'D or unknown': 1.0, 'V (coastal high hazard)': 1.0, 'X, B or C (outside)': 1.0}
Outside-zone claims are smaller (median $16,860 against $23,933 in A zones), but not small. The recorded water depth has a median of 1 in every class, which looks implausibly shallow for inches. The NFIP fix page shows why.
Example 2: preferred-risk and newer maps
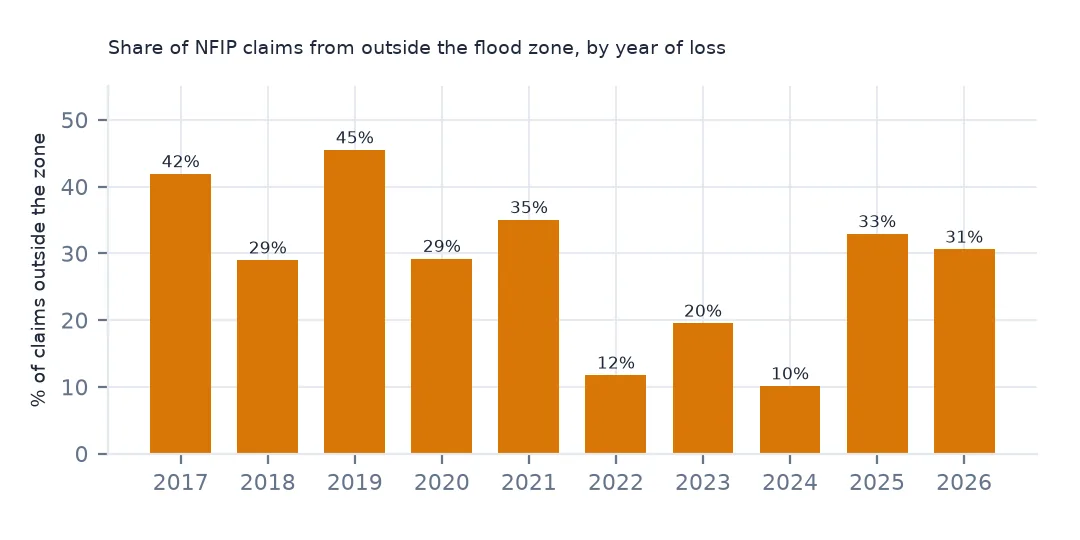
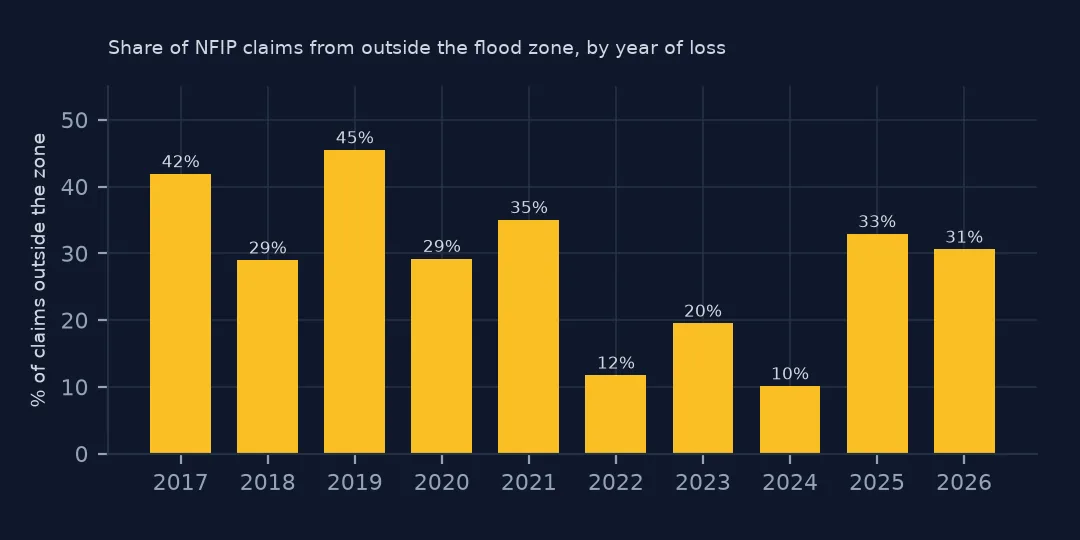
print("outside-zone share of claims by year of loss:", nfip.groupby("yearOfLoss").zone.apply(lambda z: (z == "X, B or C (outside)").mean()).round(3).to_dict())outside-zone share of claims by year of loss: {2017: 0.419, 2018: 0.29, 2019: 0.455, 2020: 0.292, 2021: 0.35, 2022: 0.117, 2023: 0.195, 2024: 0.101, 2025: 0.329, 2026: 0.306}
By year, the outside-zone share ranges from 10.1% (2024) to 45.5% (2019). Years dominated by surge, such as 2022 (Ian) and 2024 (Helene and Milton), have low shares, and rain years such as 2017 (Harvey) and 2019 have high ones. A single headline share hides that: quote it with its period and say which floods were in it.
Why the map misses a quarter of claims
Flood Insurance Rate Maps model the 1%-annual-chance flood from rivers and the coast, with engineering studies of each stream. They do not model flooding from rainfall overwhelming streets and drains (pluvial flooding), small streams that were never studied, or floods larger than the 1% event. Many maps are also old and do not reflect new development or recent rainfall. Outside the zone, risk is lower per building, but there are far more buildings, so many claims still come from there.
Insurance take-up runs the other way: it is mandatory with a federally backed mortgage inside the zone and optional outside, so the share of losses outside the zone is higher than the share of claims suggests.
Zone codes
- B and C are the pre-1986 names for what is now shaded and unshaded X; group them together.
- A99, AR and AH/AO are all inside the hazard area; the first letter is enough.
- D means undetermined risk and is rare (0.5% of claims).
- Zones are per policy, so a building insured twice (building and condo association) can appear in two claims.
Internal links
- How to analyse NFIP flood insurance claims — the claims file
- Flood insurance payouts explained — what a claim pays
- How to map a hurricane's flood insurance claims — where the claims were
FAQ
What share of flood insurance claims are outside the flood zone?
From 2017 to 2026, 28.3% of NFIP claims and 24.6% of payments came from buildings rated in zones X, B or C, outside the Special Flood Hazard Area. The share ranges from 10.1% to 45.5% by year.
Why did so many Hurricane Harvey claims come from outside the flood zone?
Harvey's flooding was mostly from extreme rainfall, which the flood maps do not model; 52.5% of its claims were in X zones.