
How to Map a Hurricane's Flood Insurance Claims: Harvey, Ian and Helene
On this page
Problem statement
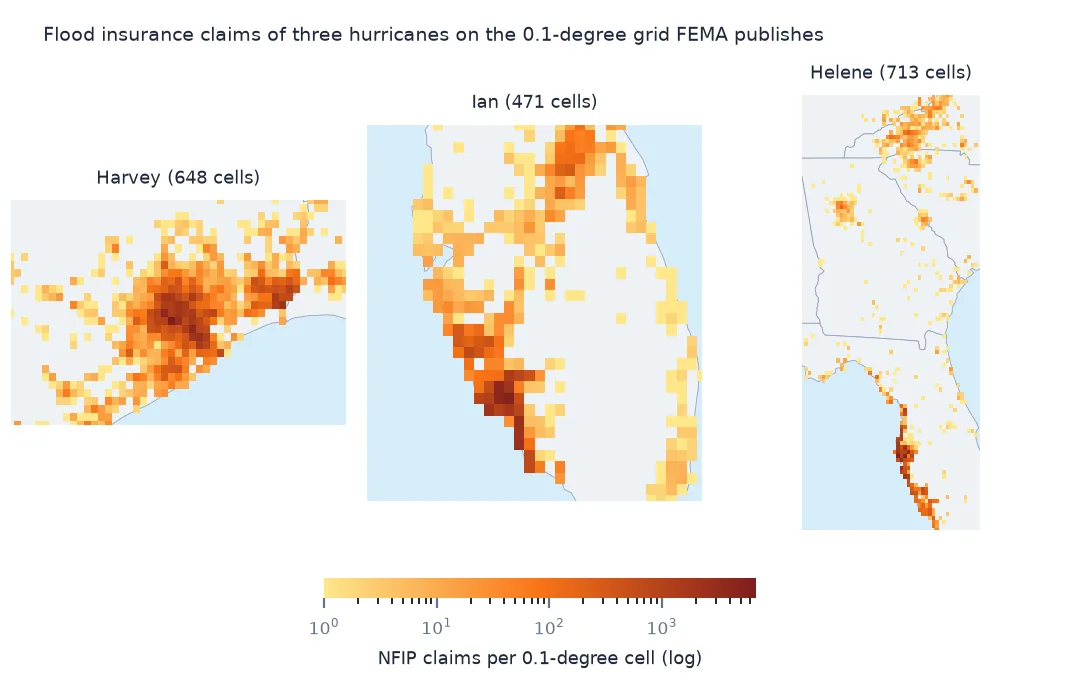
Where did a hurricane's floodwater reach insured homes? NFIP claims answer that for every storm since 1978, but FEMA rounds each claim's position to one decimal place of latitude and longitude to protect privacy. Plotted as points, Harvey's 92,398 claims collapse onto a few hundred spots, with thousands of claims stacked on each. This page maps the claims of three of the costliest storms, Harvey (2017), Ian (2022) and Helene (2024), as 0.1-degree cells and by county, and compares how far inland each one's insured flooding reached.
Quick answer
Group a storm's claims by (latitude, longitude), the rounded positions, and draw each group as a 0.1° square centred on the point, coloured by claim count or payment. For county totals, group by countyCode instead of placing points in polygons, since rounding can push a position across a county line.
storms = ["Hurricane Harvey", "Hurricane Ian", "Hurricane Helene"]
nfip["paid"] = nfip.netBuildingPaymentAmount.fillna(0) + nfip.netContentsPaymentAmount.fillna(0)
s = nfip[nfip.floodEvent.isin(storms)]
cells = s.groupby(["floodEvent", "latitude", "longitude"]).agg(claims=("id", "size"), paid=("paid", "sum")).reset_index()
print(cells.groupby("floodEvent").agg(cells=("claims", "size"), claims=("claims", "sum"), busiest=("claims", "max")).to_string())
cells claims busiest
floodEvent
Hurricane Harvey 648 92396 6852
Hurricane Helene 713 57419 5463
Hurricane Ian 471 48810 5371
Harvey's 92,396 claims with a position fall in just 648 cells, Ian's in 471 and Helene's in 713. The busiest single cell holds 6,852 Harvey claims. Points would hide that concentration entirely, since each dot would carry anything from one claim to several thousand.
Cells and counties
1. Positions are rounded to a tenth of a degree
print(f"distinct positions among {len(s):,} claims: {s.groupby(['latitude', 'longitude']).ngroups:,}")
print(f"a 0.1-degree cell at 30N is about {0.1 * 111.2:.1f} km north-south by {0.1 * 111.2 * np.cos(np.radians(30)):.1f} km east-west")
distinct positions among 199,312 claims: 1,668
a 0.1-degree cell at 30N is about 11.1 km north-south by 9.6 km east-west
The three storms' 199,312 claims share only 1,668 distinct positions. At 30°N a 0.1° cell is about 11.1 km north–south by 9.6 km east–west, about the size of a small town. That is the finest resolution the public file allows.
2. Draw cells, not points
from shapely.geometry import box

g = gpd.GeoDataFrame(cells, crs=4326, geometry=[box(x - 0.05, y - 0.05, x + 0.05, y + 0.05) for x, y in zip(cells.longitude, cells.latitude)])
top = g.sort_values("claims", ascending=False).groupby("floodEvent").head(1)
print(top[["floodEvent", "latitude", "longitude", "claims", "paid"]].assign(paid=lambda d: (d.paid / 1e6).round(1)).to_string(index=False))
floodEvent latitude longitude claims paid
Hurricane Harvey 29.7 -95.5 6852 848.2
Hurricane Helene 27.8 -82.8 5463 851.1
Hurricane Ian 26.5 -81.9 5371 568.0
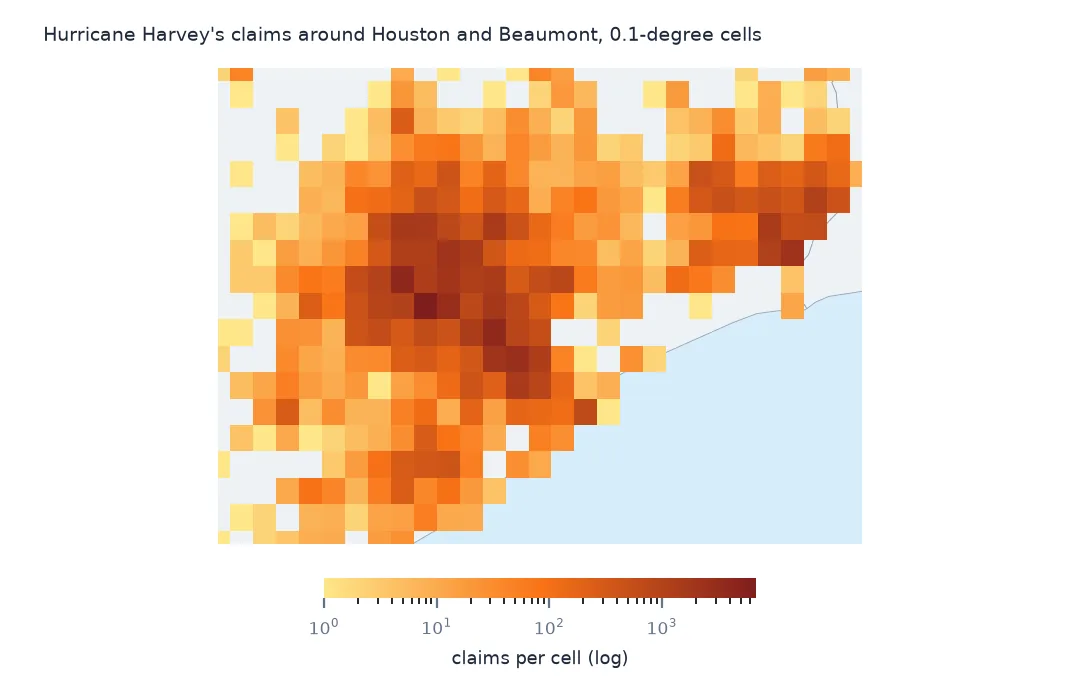
Each storm's busiest cell is in its worst-hit metro: west Houston for Harvey (6,852 claims, $848.2 million), Pinellas County on Tampa Bay for Helene (5,463 claims, $851.1 million) and Fort Myers for Ian (5,371 claims). Colour cells by claims to show how widespread the flooding was, and by payment to show where the damage was costliest.
3. Aggregate to counties with the county field
cty = s.assign(GEOID=s.countyCode.str.zfill(5)).groupby(["floodEvent", "GEOID"]).agg(claims=("id", "size"), paid=("paid", "sum")).reset_index()
cty = cty.merge(counties[["GEOID", "NAMELSAD", "STUSPS"]], on="GEOID", how="left")
print(cty.sort_values("claims", ascending=False).groupby("floodEvent").head(2)[["floodEvent", "NAMELSAD", "STUSPS", "claims"]].to_string(index=False))
floodEvent NAMELSAD STUSPS claims
Hurricane Harvey Harris County TX 48992
Hurricane Ian Lee County FL 28621
Hurricane Helene Pinellas County FL 23452
Hurricane Harvey Galveston County TX 8712
Hurricane Ian Collier County FL 7813
Hurricane Helene Hillsborough County FL 7418
By county, Harris County had 48,992 Harvey claims, Lee County 28,621 for Ian and Pinellas County 23,452 for Helene. The county field is what FEMA recommends for aggregation, because a rounded point can fall in the next county or even the sea.
Inland reach and claim size
The data used on this page
FEMA's NFIP Redacted Claims (version 3) from OpenFEMA, every claim with a loss in 2017 or later, saved on this site on 15 October 2026; Census Bureau 2023 county boundaries.
from pathlib import Path

import geopandas as gpd
import numpy as np
import pandas as pd
import requests

Path("data").mkdir(exist_ok=True)
# OpenFEMA, queried on 15 October 2026 and saved on this site because both datasets are revised continually:
# DisasterDeclarationsSummaries v2 (every declaration since 1953, one row per designated area) and NfipClaims v3
# (flood insurance claims with a loss in 2017 or later, 29 fields). The queries are in data/README.txt; the live API is
# https://www.fema.gov/api/open/v2/DisasterDeclarationsSummaries and https://www.fema.gov/api/open/v3/NfipClaims
FILES = ["fema-disaster-declarations-2026-10-15.zip", "nfip-claims-2017-2026-2026-10-15.zip"]
for name in FILES:
    if not Path(f"data/{name}").exists():
        Path(f"data/{name}").write_bytes(requests.get(f"https://data.spatialworkflow.io/{name}", timeout=600).content)
dds = pd.read_csv("data/fema-disaster-declarations-2026-10-15.zip", dtype={"fipsStateCode": str, "fipsCountyCode": str, "placeCode": str},
                  parse_dates=["declarationDate", "incidentBeginDate", "incidentEndDate"])
nfip = pd.read_csv("data/nfip-claims-2017-2026-2026-10-15.zip", low_memory=False, dtype={"countyCode": str, "reportedZipCode": str},
                   parse_dates=["dateOfLoss"])
for name in ["cb_2023_us_county_20m.zip", "cb_2023_us_state_20m.zip"]:
    if not Path(f"data/{name}").exists():
        Path(f"data/{name}").write_bytes(requests.get(f"https://www2.census.gov/geo/tiger/GENZ2023/shp/{name}", timeout=300).content)
counties = gpd.read_file("data/cb_2023_us_county_20m.zip").to_crs(5070)
states = gpd.read_file("data/cb_2023_us_state_20m.zip").to_crs(5070)
print(f"OpenFEMA: {len(dds):,} declaration rows for {dds.disasterNumber.nunique():,} declarations, "
      f"{dds.declarationDate.min():%Y}-{dds.declarationDate.max():%Y}")
OpenFEMA: 70,567 declaration rows for 5,281 declarations, 1953-2026
Example 1: how far inland
for name in storms:
    e = s[s.floodEvent == name]
    print(f"{name}: {len(e):,} claims; top states {e.state.value_counts().head(3).to_dict()}; north of 35N {(e.latitude > 35).mean():.1%}")
Hurricane Harvey: 92,398 claims; top states {'TX': 91872, 'LA': 526}; north of 35N 0.0%
Hurricane Ian: 48,824 claims; top states {'FL': 47556, 'SC': 1073, 'NC': 171}; north of 35N 0.1%
Hurricane Helene: 58,090 claims; top states {'FL': 54676, 'NC': 2028, 'GA': 670}; north of 35N 4.1%
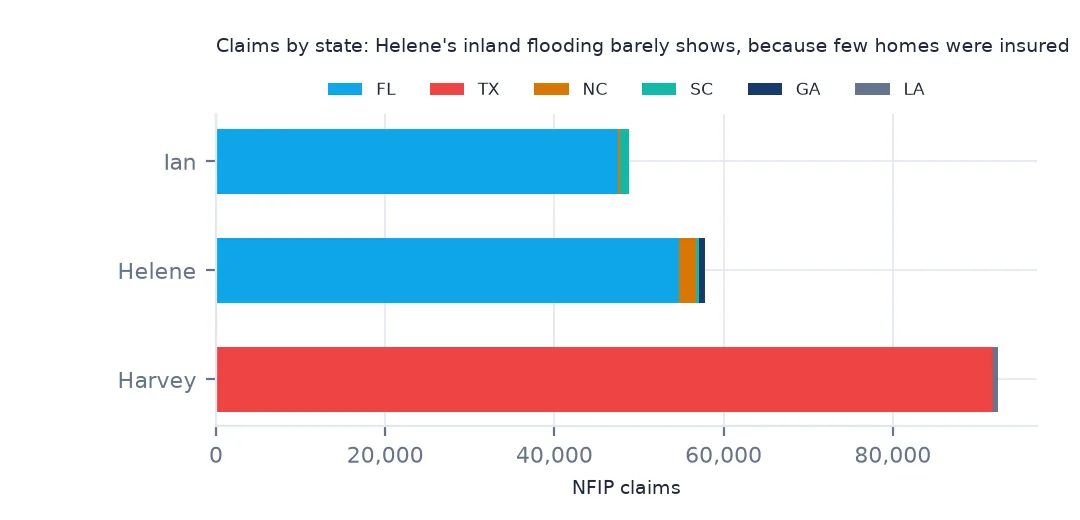
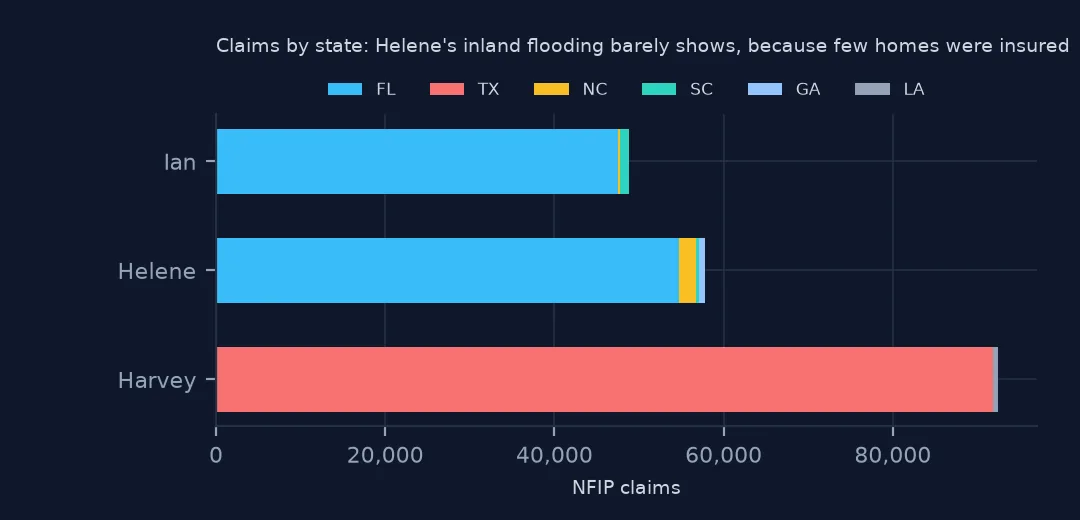
Harvey's insured flooding stayed in Texas (91,872 claims), Ian's in Florida (47,556). Helene's claims are 54,676 in Florida, 2,028 in North Carolina and 670 in Georgia, with 4.1% north of 35°N in the Appalachians. Those inland claims are few because few homes there were insured, not because the flooding was minor.
Example 2: payment per claim by event
print(s.groupby("floodEvent").paid.agg(["size", "median", "mean"]).round(0).to_string()) size median mean
floodEvent
Hurricane Harvey 92398 67713.0 97745.0
Hurricane Helene 58090 87251.0 116347.0
Hurricane Ian 48824 39187.0 100465.0
Helene's claims were the most expensive per claim (median $87,251), as surge gutted Gulf coast homes, while Ian's median was $39,187 but its mean $100,465, pulled up by many total losses around Fort Myers. Harvey's median was $67,713. Medians and means tell different stories, so map both.
Why FEMA rounds the positions
NFIP claims are personal financial records. FEMA publishes them under the Privacy Act's constraints by removing names and addresses and generalising location: latitude and longitude rounded to one decimal place, and a census tract and ZIP code kept for aggregation. Rounding to 0.1° means a position can be up to about 5–6 km from the building, so the file supports regional maps and county statistics but not street-level analysis.
For a finer picture, FEMA's own damage assessments and the storm-surge and inundation models of the National Hurricane Center and USGS are the sources. Claims show where insured damage was paid.
Mapping notes
- Use a log colour scale. Cell counts run from one to several thousand.
- Never use a dot map of the rounded positions; it hides the stacking and looks precise.
- A few claims lack a position. Count them with the county field even if they are not on the map.
- Event names are text. Check spellings (
Hurricane Ian,Tropical Storm Imelda) and that no event is split across two names.
Internal links
- How to analyse NFIP flood insurance claims — the claims file
- How many flood claims come from outside the flood zone? — the same storms by zone
- How to map a hurricane season's tracks — the storms themselves
FAQ
Why do NFIP claim points stack on top of each other?
FEMA rounds each claim's latitude and longitude to one decimal place for privacy, so all claims within a 0.1° cell share one position. Harvey's claims fall in 648 cells.
How many flood insurance claims did Hurricane Helene cause?
58,090 in the NFIP file, 54,676 of them in Florida and 2,028 in North Carolina.