
Flood Insurance Payouts Explained: Damage, Coverage and What the NFIP Pays
On this page
Problem statement
A flood insurance claim has three different money figures: the damage the adjuster assessed, the coverage the policy carried, and what the NFIP actually paid. Treating any one as "the cost of the flood" gives a different answer, and a quarter of claims pay nothing at all. This page explains how the three relate, using the NFIP's claims since 2017: how often payment matches damage, how often damage exceeds the coverage cap, why claims close without payment, and how contents and compliance payments fit in.
Quick answer
Payment is the assessed damage, minus the deductible, capped at the coverage (at most $250,000 for a home's building, and a lower limit for its contents), and net of any recoveries. Use buildingDamageAmount for damage, totalBuildingInsuranceCoverage for the cap and netBuildingPaymentAmount for money paid. Claims closed without payment carry a reason code.
b = nfip[nfip.buildingDamageAmount > 0].copy()
b["share"] = b.netBuildingPaymentAmount / b.buildingDamageAmount
print(f"claims with building damage: {len(b):,}; payment as share of damage: median {b.share.median():.2f}; "
      f"paid at least 90%: {(b.share >= 0.9).mean():.1%}; paid nothing: {(b.netBuildingPaymentAmount <= 0).mean():.1%}")
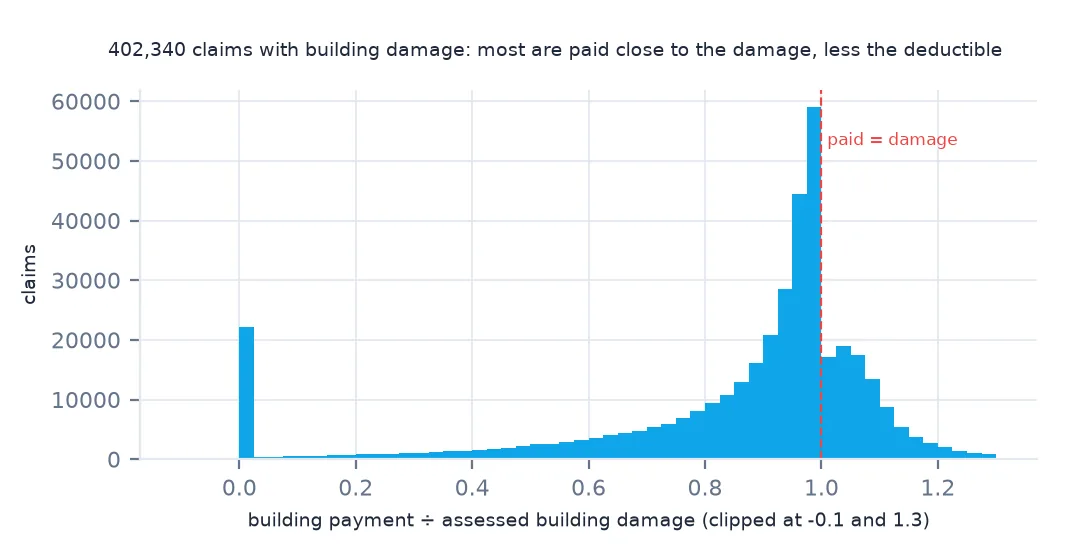
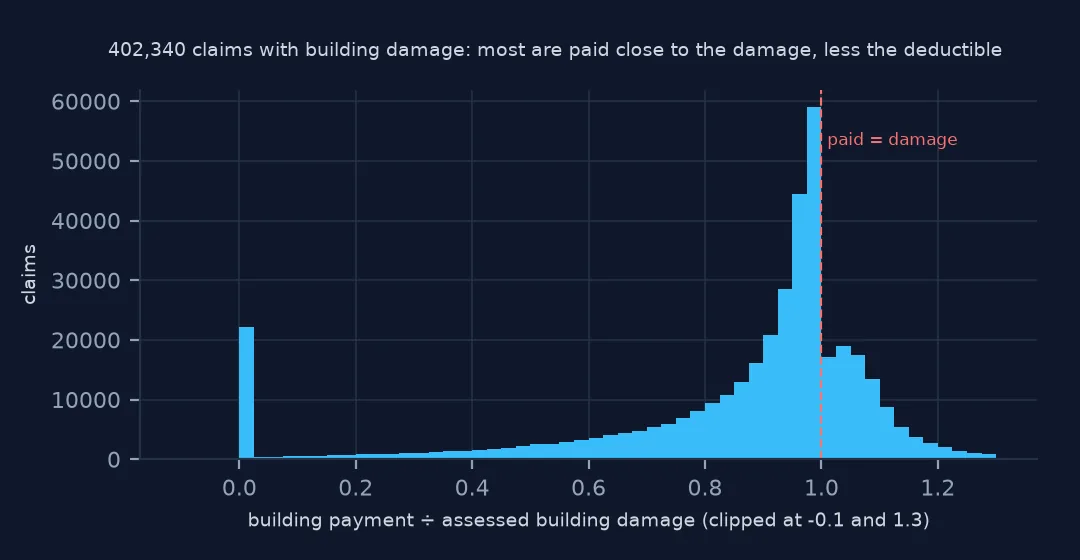
claims with building damage: 402,340; payment as share of damage: median 0.95; paid at least 90%: 63.8%; paid nothing: 5.5%
Among 402,340 claims with building damage, the median payment is 95% of the assessed damage, and 63.8% of claims were paid at least 90%. The gap is mostly the deductible. 5.5% of claims with damage were paid nothing.
Coverage, unpaid claims and the extras
1. Damage, coverage and the cap
cov = nfip.totalBuildingInsuranceCoverage
print(f"building coverage: median ${cov.median():,.0f}; at the $250,000 residential cap: {(cov == 250_000).mean():.1%}")
over = b[b.buildingDamageAmount > b.totalBuildingInsuranceCoverage]
print(f"claims where damage exceeded coverage: {len(over):,} ({len(over) / len(b):.1%}); uncovered damage ${(over.buildingDamageAmount - over.totalBuildingInsuranceCoverage).sum() / 1e9:.2f} billion")
building coverage: median $250,000; at the $250,000 residential cap: 50.1%
claims where damage exceeded coverage: 23,712 (5.9%); uncovered damage $1.04 billion
Half the claimed policies (50.1%) carried building coverage at the residential cap of $250,000, which is also the median. 23,712 claims (5.9%) had damage above their coverage. Their uncovered damage adds up to $1.04 billion, money the owners had to find elsewhere.
2. Claims closed without payment
reason = {1: "below deductible", 6: "not actual flood", 20: "no demonstrable damage", 97: "other", 98: "error, delete claim", 99: "erroneous assignment", 8: "failure to pursue claim", 16: "wind damage, not flood"}
unpaid = nfip[nfip.netBuildingPaymentAmount.fillna(0) <= 0]
print(f"building claims with no payment: {len(unpaid):,} ({len(unpaid) / len(nfip):.1%})")
print(unpaid.nonPaymentReasonBuilding.map(reason).value_counts().head(7).to_dict())
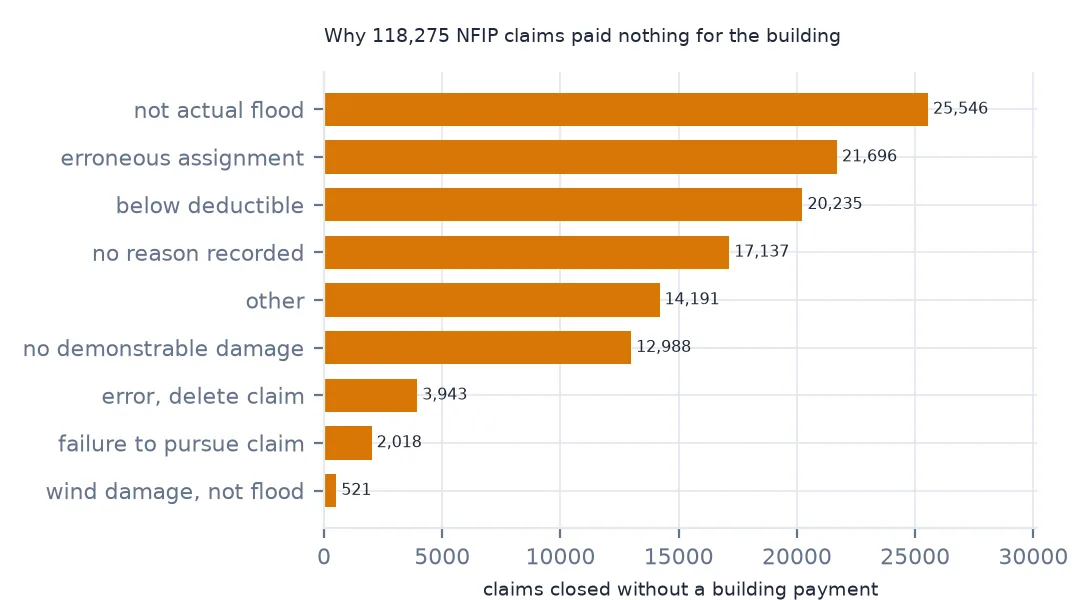
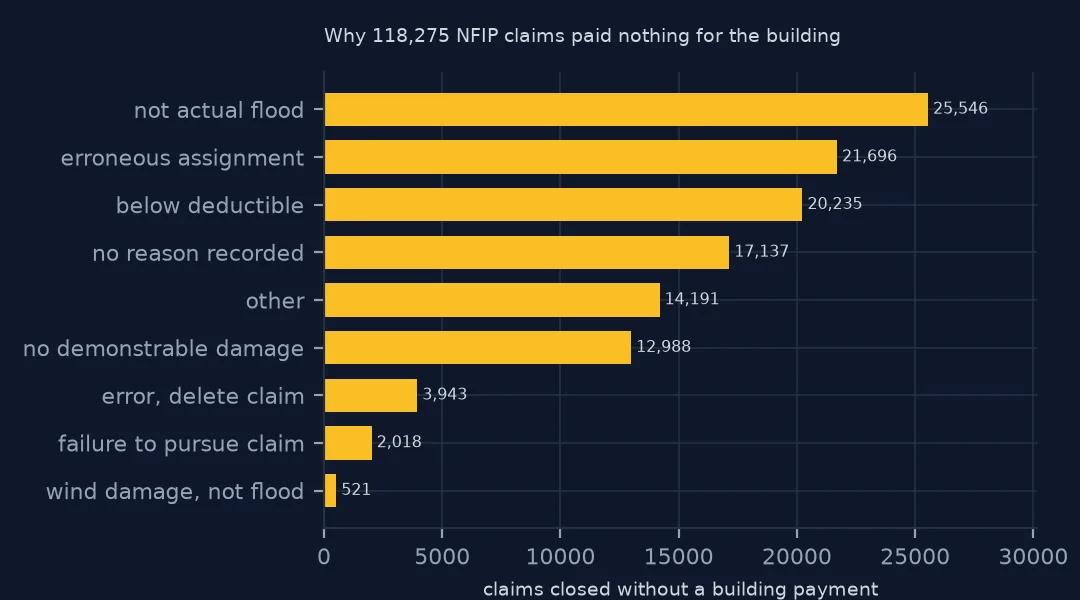
building claims with no payment: 118,275 (23.3%)
{'not actual flood': 25546, 'erroneous assignment': 21696, 'below deductible': 20235, 'other': 14191, 'no demonstrable damage': 12988, 'error, delete claim': 3943, 'failure to pursue claim': 2018}
118,275 claims (23.3%) closed with no building payment. The commonest reasons are that the damage was not from a flood as the policy defines it (25,546, often wind or seepage), erroneous assignment (21,696), damage below the deductible (20,235) and no demonstrable damage (12,988). An unpaid claim usually means the event did not meet the policy's definition of flood, not that nothing happened.
3. Contents and compliance
print(f"claims with a contents payment: {(nfip.netContentsPaymentAmount > 0).mean():.1%}; "
      f"contents share of all payments {nfip.netContentsPaymentAmount.sum() / (nfip.netBuildingPaymentAmount.sum() + nfip.netContentsPaymentAmount.sum()):.1%}")
print(f"Increased Cost of Compliance payments: {(nfip.netIccPaymentAmount > 0).sum():,} claims, ${nfip.netIccPaymentAmount.clip(lower=0).sum() / 1e6:,.0f} million")
claims with a contents payment: 36.0%; contents share of all payments 15.8%
Increased Cost of Compliance payments: 2,996 claims, $73 million
Only 36.0% of claims had a contents payment, and contents make up 15.8% of all payments. Contents coverage is a separate, optional purchase, and many policyholders, including most with mortgage-required policies, never buy it. Increased Cost of Compliance, which pays to elevate or demolish a substantially damaged building, was paid on 2,996 claims, $73 million in all.
Substantial damage and primary homes
The data used on this page
FEMA's NFIP Redacted Claims (version 3) from OpenFEMA, every claim with a loss in 2017 or later, saved on this site on 15 October 2026.
from pathlib import Path

import geopandas as gpd
import numpy as np
import pandas as pd
import requests

Path("data").mkdir(exist_ok=True)
# OpenFEMA, queried on 15 October 2026 and saved on this site because both datasets are revised continually:
# DisasterDeclarationsSummaries v2 (every declaration since 1953, one row per designated area) and NfipClaims v3
# (flood insurance claims with a loss in 2017 or later, 29 fields). The queries are in data/README.txt; the live API is
# https://www.fema.gov/api/open/v2/DisasterDeclarationsSummaries and https://www.fema.gov/api/open/v3/NfipClaims
FILES = ["fema-disaster-declarations-2026-10-15.zip", "nfip-claims-2017-2026-2026-10-15.zip"]
for name in FILES:
    if not Path(f"data/{name}").exists():
        Path(f"data/{name}").write_bytes(requests.get(f"https://data.spatialworkflow.io/{name}", timeout=600).content)
dds = pd.read_csv("data/fema-disaster-declarations-2026-10-15.zip", dtype={"fipsStateCode": str, "fipsCountyCode": str, "placeCode": str},
                  parse_dates=["declarationDate", "incidentBeginDate", "incidentEndDate"])
nfip = pd.read_csv("data/nfip-claims-2017-2026-2026-10-15.zip", low_memory=False, dtype={"countyCode": str, "reportedZipCode": str},
                   parse_dates=["dateOfLoss"])
print(f"OpenFEMA: {len(dds):,} declaration rows for {dds.disasterNumber.nunique():,} declarations, "
      f"{dds.declarationDate.min():%Y}-{dds.declarationDate.max():%Y}")
OpenFEMA: 70,567 declaration rows for 5,281 declarations, 1953-2026
Example 1: damage against the home's value
v = b[b.buildingPropertyValue > 0]
r = v.buildingDamageAmount / v.buildingPropertyValue
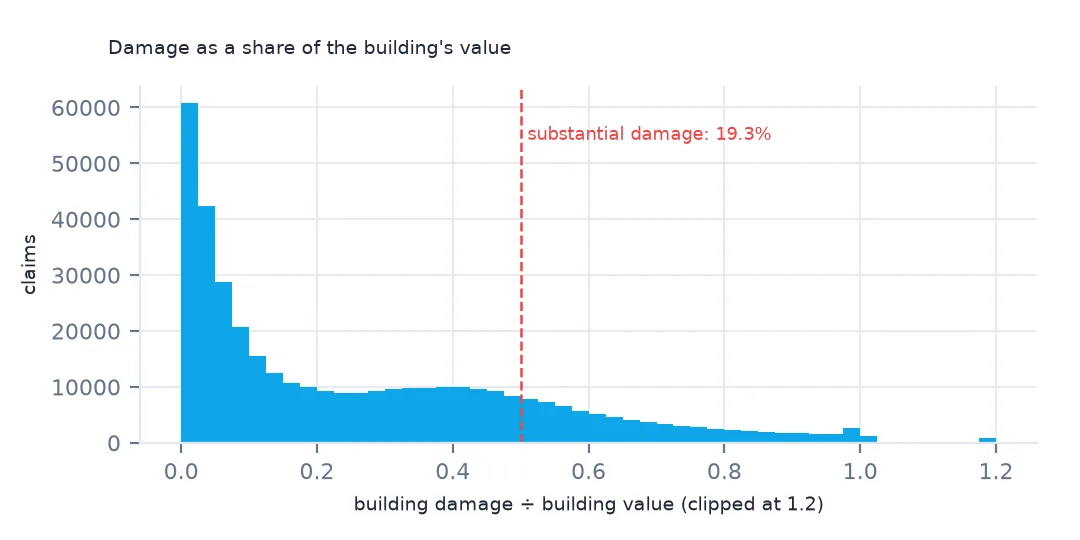
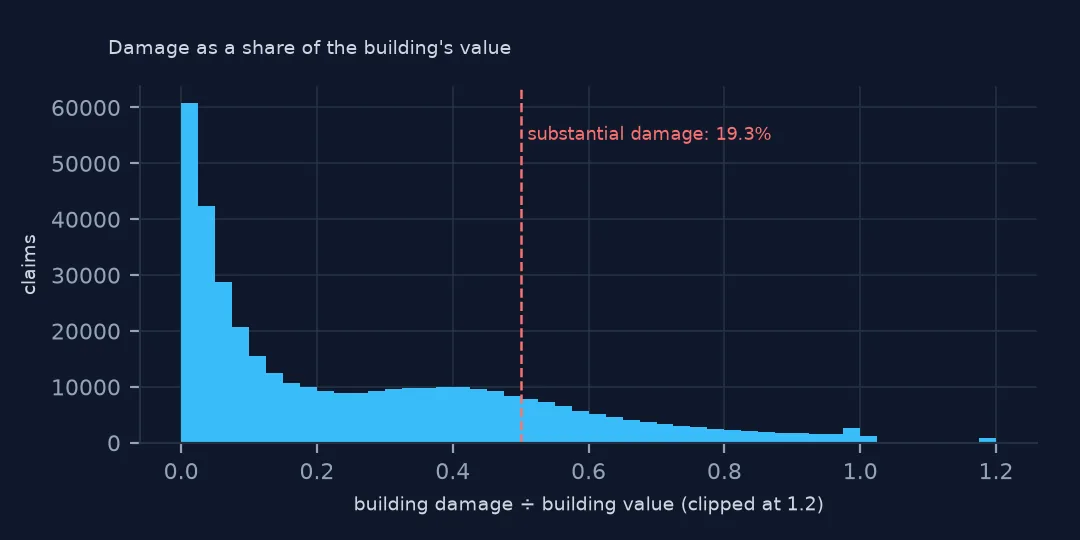
print(f"damage at 50% or more of the building's value (substantial damage): {(r >= 0.5).mean():.1%} of {len(v):,} claims")
print("by event:", v.assign(sub=r >= 0.5).groupby("floodEvent").sub.mean().reindex(["Hurricane Harvey", "Hurricane Ian", "Hurricane Helene", "Hurricane Ida"]).round(3).to_dict())
damage at 50% or more of the building's value (substantial damage): 19.3% of 389,568 claims
by event: {'Hurricane Harvey': 0.31, 'Hurricane Ian': 0.268, 'Hurricane Helene': 0.331, 'Hurricane Ida': 0.119}
19.3% of claims had damage of at least half the building's value, the threshold at which local rules usually require a rebuilt home to meet current flood standards. The share was 33.1% for Helene and 31.0% for Harvey, against 11.9% for Ida. Those claims are the ones that change a town: elevations, buyouts and demolitions.
Example 2: primary homes and second homes
print(nfip.groupby("primaryResidenceIndicator").agg(claims=("id", "size"), median_paid=("netBuildingPaymentAmount", "median")).round(0).to_string()) claims median_paid
primaryResidenceIndicator
0 160082 15222.0
1 346726 19350.0
Primary residences make up 346,726 of the claims, with a median payment of $19,350, against $15,222 for second homes and rentals.
How a claim is settled
After a flood, an adjuster inspects the building (or, increasingly, assesses it remotely) and records the damage at actual cash value or replacement cost, depending on the policy. The NFIP pays that amount minus the deductible, up to the coverage limit, separately for building and contents. A building claim can be closed without payment for reasons the policy spells out: the water was not a "general condition of flooding" covering two or more acres or properties, the damage was from wind, seepage or drain backup, or it fell below the deductible.
So buildingDamageAmount is the closest field to the physical loss on insured buildings, and netBuildingPaymentAmount is what the program spent. Neither is the total cost of a flood, which includes uninsured buildings, infrastructure and lost income.
Before comparing figures
- Damage is blank on many claims, mostly unpaid ones; filter to damage > 0 before ratios.
- Coverage caps are higher for non-residential buildings, so split by occupancy before using the $250,000 line.
- Payments are nominal dollars. Inflate before comparing 2017 with 2024.
- Net payments can be negative after recoveries; clip them when summing what was paid.
Internal links
- How to analyse NFIP flood insurance claims — the claims file
- NFIP claim totals look wrong — negative payments and depths
- FEMA disaster declarations explained — the disaster aid that is not insurance
FAQ
How much of the damage does flood insurance pay?
For NFIP claims since 2017 with building damage, the median payment is 95% of the assessed damage; the difference is mostly the deductible. 5.9% of claims had damage above their coverage.
Why are NFIP claims closed without payment?
Most often because the damage was not a flood as the policy defines it, the claim was assigned in error, or the damage was below the deductible. 23.3% of claims since 2017 had no building payment.