
How to Map FEMA Disaster Declarations by County in Python
On this page
Problem statement
Which US counties have been declared federal disaster areas most often? FEMA publishes every declaration since 1953 through OpenFEMA, and the file looks ready to map: it has a state FIPS code, a county FIPS code and a declaration number on every row. But a row is one designated area of one declaration, not a disaster. There are 70,567 rows for 5,281 declarations, some rows sit below or above the county, and the federal fiscal year starts in October. This page builds a county map of major disaster declarations since 2000 and shows where each of those choices changes the counts.
Quick answer
Drop rows with county code 000, build the GEOID from fipsStateCode + fipsCountyCode, keep declarationType == "DR" for major disasters, and count distinct disasterNumber per GEOID. Then merge onto Census county boundaries.
cty = dds[dds.fipsCountyCode != "000"].assign(GEOID=lambda d: d.fipsStateCode + d.fipsCountyCode)
dr = cty[(cty.declarationType == "DR") & (cty.declarationDate.dt.year >= 2000)].drop_duplicates(["disasterNumber", "GEOID"])
per = dr.groupby("GEOID").disasterNumber.nunique().rename("major_disasters")
m = counties.merge(per, on="GEOID", how="left").fillna({"major_disasters": 0})
print(f"major disaster declarations since 2000: {dr.disasterNumber.nunique():,}, covering {len(per):,} counties; "
      f"median county {m.major_disasters.median():.0f}, most {m.major_disasters.max():.0f}")
major disaster declarations since 2000: 1,572, covering 3,241 counties; median county 9, most 29
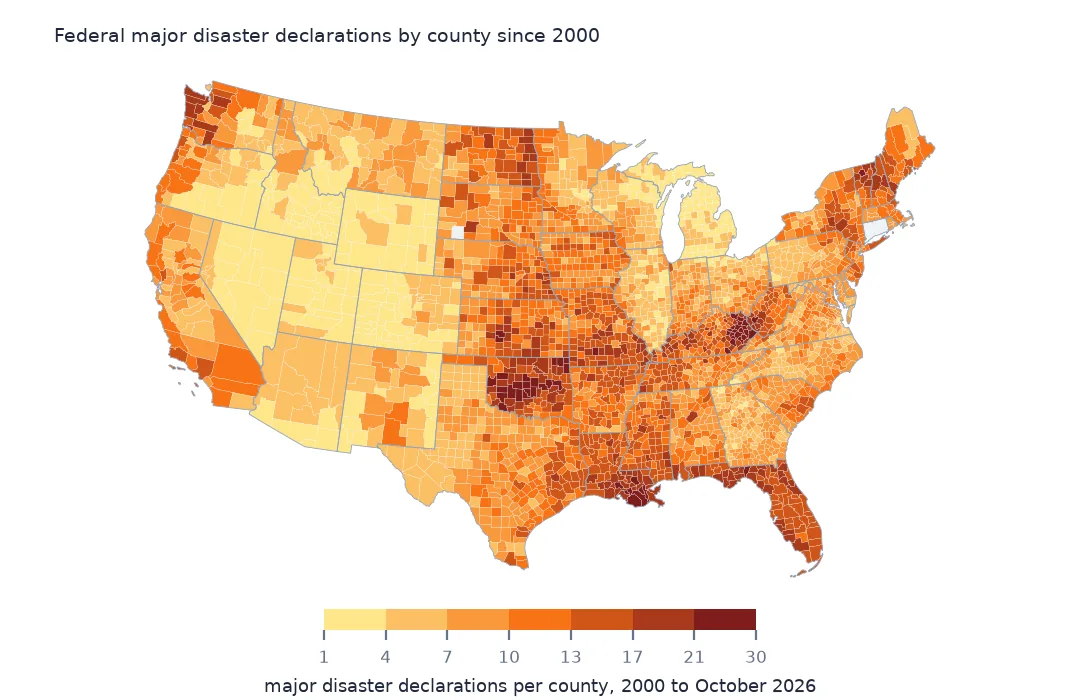
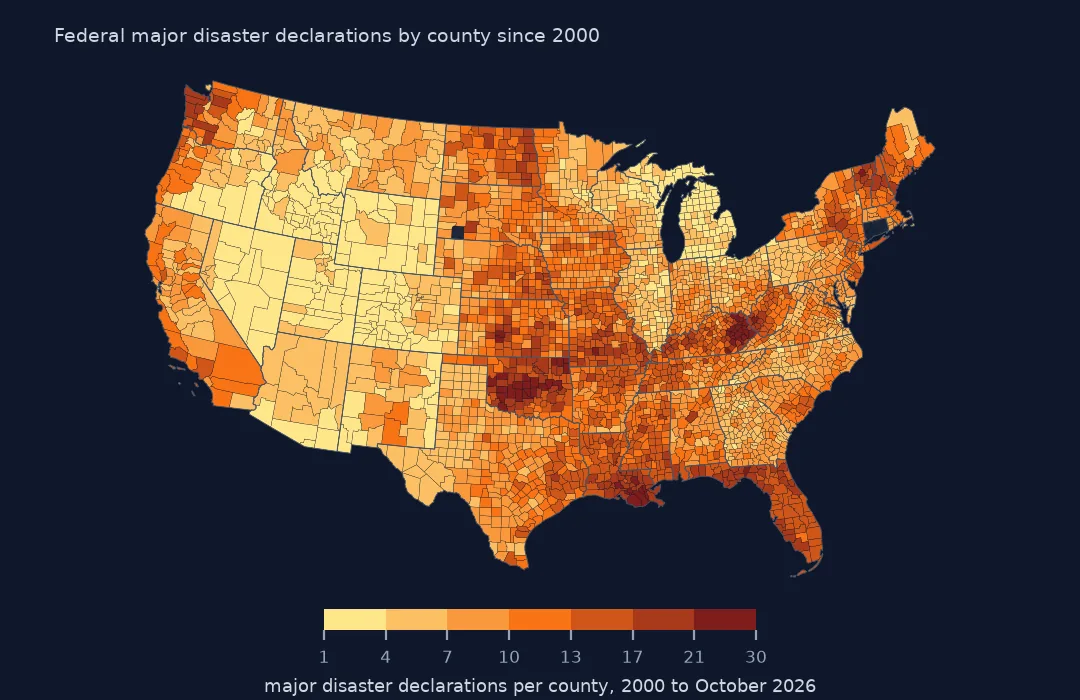
Since 2000 there have been 1,572 major disaster declarations, covering 3,241 counties, nearly every county in the country. The median county was declared 9 times, and the most-declared 29 times.
From declaration rows to a county count
1. One row per designated area
print(dds[["femaDeclarationString", "state", "declarationType", "incidentType", "declarationTitle", "designatedArea"]].head(4).to_string(index=False))
rows = dds.groupby("disasterNumber").size()
print(f"rows per declaration: median {rows.median():.0f}, most {rows.max():,} ({dds.loc[dds.disasterNumber == rows.idxmax(), 'declarationTitle'].iloc[0]})")
femaDeclarationString state declarationType incidentType declarationTitle designatedArea
FM-5676-AR AR FM Fire BUNKER FIRE Ouachita (County)
FM-5676-AR AR FM Fire BUNKER FIRE Calhoun (County)
FM-5675-TX TX FM Fire ROSS FIRE Palo Pinto (County)
FM-5675-TX TX FM Fire ROSS FIRE Jack (County)
rows per declaration: median 3, most 443 (COVID-19 PANDEMIC)
Each row names one designated area: Ouachita and Calhoun counties are two rows of one Arkansas fire management declaration, FM-5676-AR. The median declaration has 3 rows. COVID-19 declarations have the most, up to 443 rows for one pandemic declaration, because every county in a large state was designated.
2. Build the county key
print(f"rows with a county code: {(dds.fipsCountyCode != '000').mean():.1%}; county keys matching Census 2023 counties: "
      f"{cty.GEOID.isin(counties.GEOID).mean():.1%}")
print("unmatched by state:", cty[~cty.GEOID.isin(counties.GEOID)].state.value_counts().head(5).to_dict())
rows with a county code: 97.7%; county keys matching Census 2023 counties: 99.0%
unmatched by state: {'CT': 244, 'MP': 94, 'VI': 84, 'AS': 75, 'MH': 50}
97.7% of rows carry a county code, and 99.0% of those match a 2023 Census county. The misses are Connecticut, whose counties were replaced by planning regions in the 2023 boundaries, and island territories (the Northern Marianas, US Virgin Islands, American Samoa and the Marshall Islands) that the 20m county file leaves out.
3. Count declarations, not rows
rows_per_county = cty[(cty.declarationType == "DR") & (cty.declarationDate.dt.year >= 2000)].groupby("GEOID").size()
print(f"counting rows instead: most {rows_per_county.max()} against {per.max()} declarations; "
      f"counties whose count changes: {(rows_per_county.reindex(per.index) != per).sum()}")
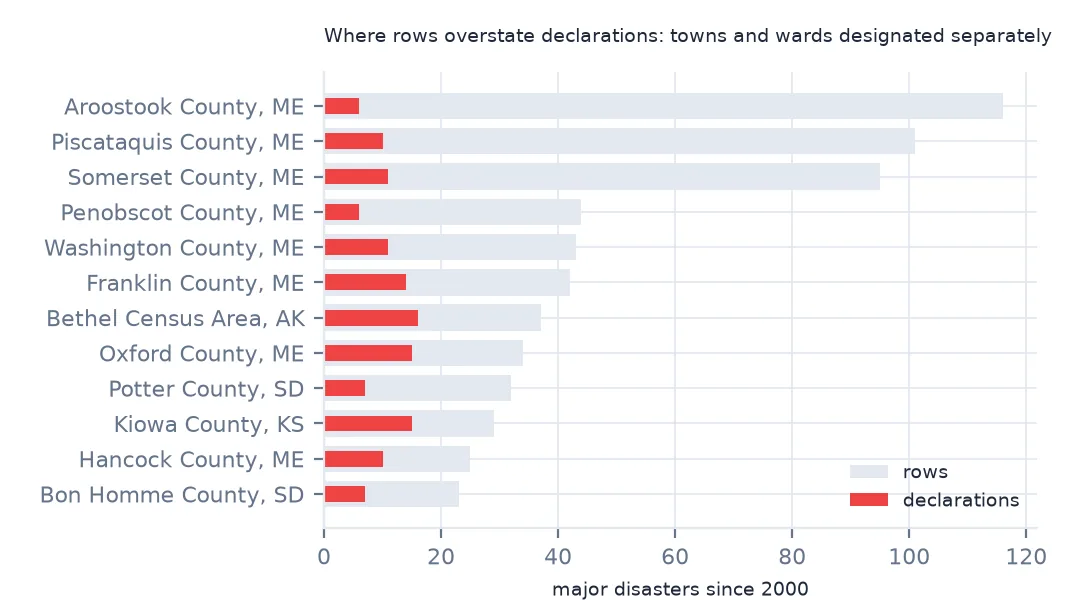
counting rows instead: most 116 against 29 declarations; counties whose count changes: 53
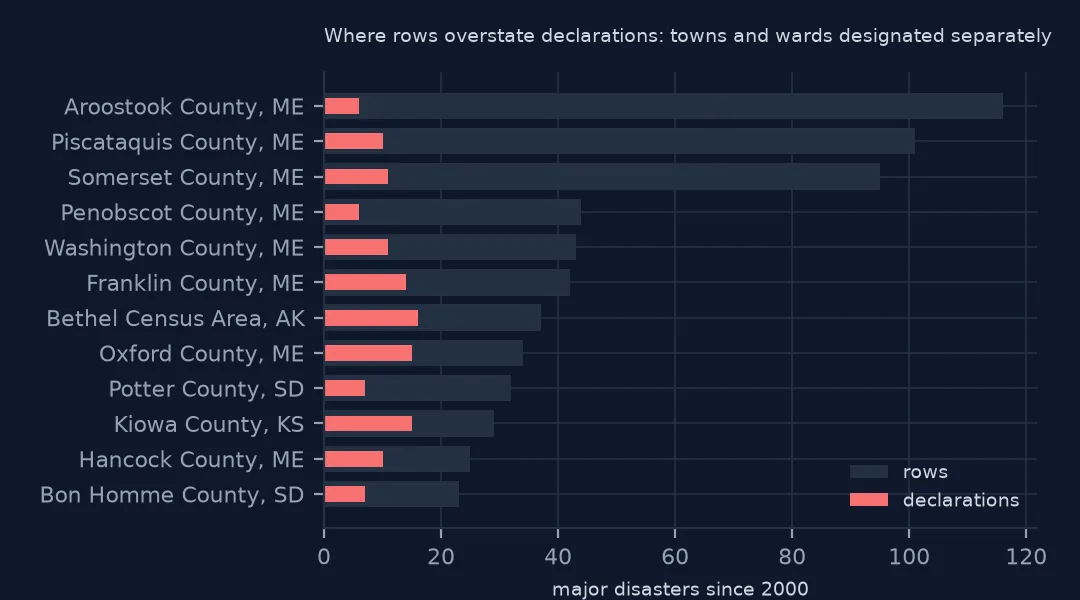
Counting rows instead of declarations inflates the top of the map: the highest county count becomes 116 rows instead of 29 declarations, and 53 counties change. These are counties with many towns, wards or reservations designated separately within one declaration.
4. Dates and the federal fiscal year
print(f"declarations dated October-December filed under the next fiscal year: "
      f"{(dds.drop_duplicates('disasterNumber').pipe(lambda d: d.fyDeclared != d.declarationDate.dt.year)).mean():.1%}")
print("latest declaration:", dds.sort_values("declarationDate").iloc[-1][["femaDeclarationString", "declarationDate", "incidentType", "declarationTitle"]].to_dict())
declarations dated October-December filed under the next fiscal year: 14.3%
latest declaration: {'femaDeclarationString': 'EM-3657-GA', 'declarationDate': Timestamp('2026-10-09 00:00:00+0000', tz='UTC'), 'incidentType': 'Tropical Storm', 'declarationTitle': 'HURRICANE ISAIAS'}
fyDeclared is the federal fiscal year, which starts on 1 October. 14.3% of declarations fall in October to December and carry the next year's number. Use declarationDate.dt.year for calendar years. The latest declaration in this copy is EM-3657-GA of 9 October 2026, an emergency declared for Hurricane Isaias.
The most-declared counties
The data used on this page
FEMA's Disaster Declarations Summaries from OpenFEMA (saved on this site on 15 October 2026), and Census Bureau 2023 county boundaries.
from pathlib import Path

import geopandas as gpd
import numpy as np
import pandas as pd
import requests

Path("data").mkdir(exist_ok=True)
# OpenFEMA, queried on 15 October 2026 and saved on this site because both datasets are revised continually:
# DisasterDeclarationsSummaries v2 (every declaration since 1953, one row per designated area) and NfipClaims v3
# (flood insurance claims with a loss in 2017 or later, 29 fields). The queries are in data/README.txt; the live API is
# https://www.fema.gov/api/open/v2/DisasterDeclarationsSummaries and https://www.fema.gov/api/open/v3/NfipClaims
FILES = ["fema-disaster-declarations-2026-10-15.zip", "nfip-claims-2017-2026-2026-10-15.zip"]
for name in FILES:
    if not Path(f"data/{name}").exists():
        Path(f"data/{name}").write_bytes(requests.get(f"https://data.spatialworkflow.io/{name}", timeout=600).content)
dds = pd.read_csv("data/fema-disaster-declarations-2026-10-15.zip", dtype={"fipsStateCode": str, "fipsCountyCode": str, "placeCode": str},
                  parse_dates=["declarationDate", "incidentBeginDate", "incidentEndDate"])
for name in ["cb_2023_us_county_20m.zip", "cb_2023_us_state_20m.zip"]:
    if not Path(f"data/{name}").exists():
        Path(f"data/{name}").write_bytes(requests.get(f"https://www2.census.gov/geo/tiger/GENZ2023/shp/{name}", timeout=300).content)
counties = gpd.read_file("data/cb_2023_us_county_20m.zip").to_crs(5070)
states = gpd.read_file("data/cb_2023_us_state_20m.zip").to_crs(5070)
print(f"OpenFEMA: {len(dds):,} declaration rows for {dds.disasterNumber.nunique():,} declarations, "
      f"{dds.declarationDate.min():%Y}-{dds.declarationDate.max():%Y}")
OpenFEMA: 70,567 declaration rows for 5,281 declarations, 1953-2026
Example 1: the most-declared counties
top = m.sort_values("major_disasters", ascending=False).head(8)[["NAMELSAD", "STUSPS", "major_disasters"]]
print(top.to_string(index=False))
NAMELSAD STUSPS major_disasters
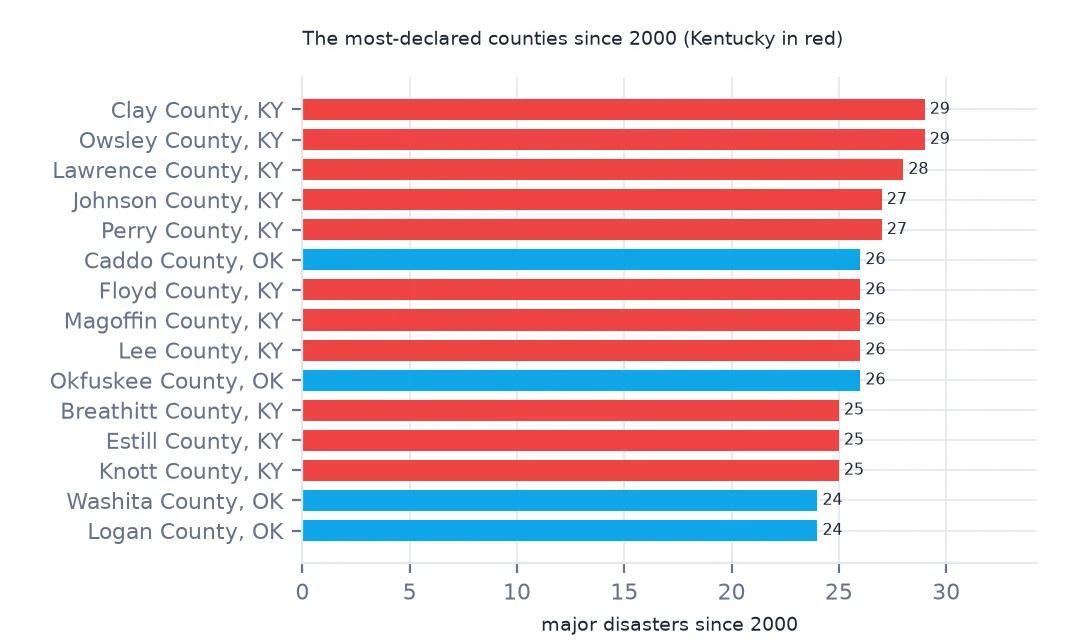
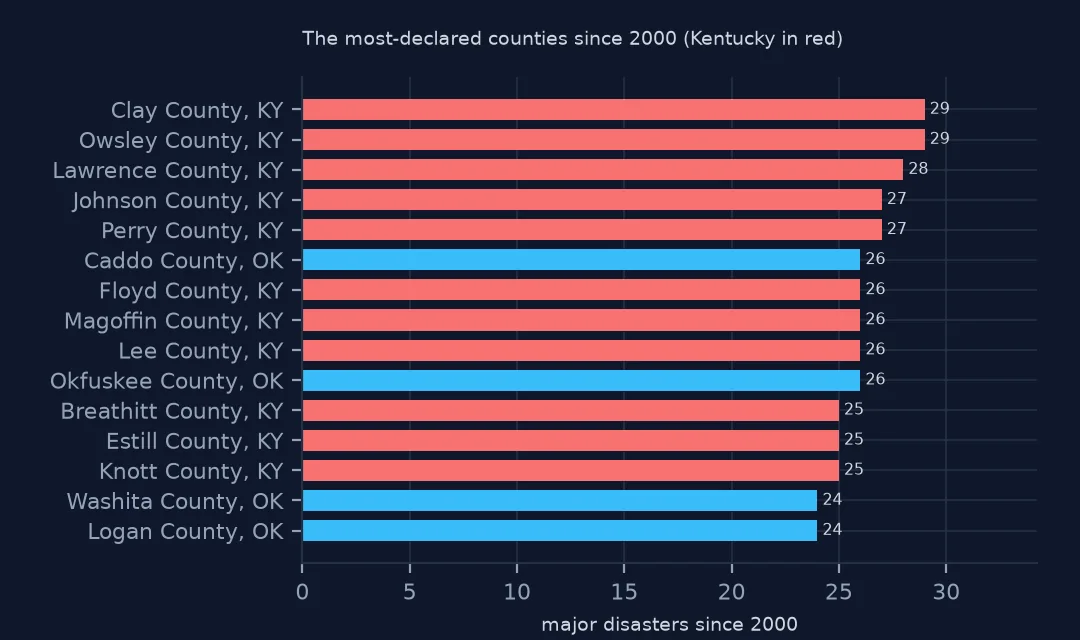
Clay County KY 29.0
Owsley County KY 29.0
Lawrence County KY 28.0
Johnson County KY 27.0
Perry County KY 27.0
Caddo County OK 26.0
Floyd County KY 26.0
Magoffin County KY 26.0
Seven of the eight most-declared counties are in eastern Kentucky: Clay and Owsley at 29, Lawrence at 28, Johnson and Perry at 27. Floods in steep Appalachian valleys, winter storms and severe storms keep these counties in declaration after declaration. Caddo County, Oklahoma (26) is the exception.
Example 2: what drives the count
k = dr.merge(m[["GEOID", "STUSPS"]], on="GEOID")
print("incident types behind county declarations since 2000:", dr.drop_duplicates(["disasterNumber", "GEOID"]).incidentType.value_counts().head(6).to_dict())
print("states with the most major disasters since 2000:", dr.groupby("state").disasterNumber.nunique().sort_values(ascending=False).head(6).to_dict())
incident types behind county declarations since 2000: {'Severe Storm': 13597, 'Hurricane': 4495, 'Flood': 3482, 'Biological': 3238, 'Severe Ice Storm': 1594, 'Fire': 915}
states with the most major disasters since 2000: {'OK': 58, 'KS': 51, 'KY': 50, 'MO': 49, 'TN': 49, 'MS': 47}
Severe storms account for the most county designations since 2000 (13,597), well ahead of hurricanes (4,495) and floods (3,482). Oklahoma has had the most major disasters of any state, 58, then Kansas, Kentucky, Missouri and Tennessee, all states of tornadoes, floods and ice storms rather than hurricanes.
What a declaration designates
A presidential major disaster declaration is made for a state, at the governor's request, after a joint damage assessment shows the event is beyond state and local capacity. The declaration then designates the areas, usually counties, where each assistance program applies. Areas are often added by amendment as damage assessments come in. Each designated area becomes a row, so the file records where federal help was authorised, not where the hazard struck.
A county map of declarations therefore mixes hazard with local capacity and politics: a poor county with little tax base reaches the threshold for federal aid sooner than a wealthy one with the same damage.
Before mapping
- COVID-19 designated almost every county in 2020. Exclude
incidentType == "Biological"when the map is about natural hazards. - Statewide and tribal rows have county code
000and need their own handling. - Connecticut needs a pre-2023 county boundary file or a crosswalk to planning regions.
- The file is revised continually. Record when you downloaded it; this page uses a copy saved on 15 October 2026.
Internal links
- FEMA disaster declarations explained — DR, EM and FM
- Disaster counts too high — rows are not declarations
- FEMA declarations that will not join to counties — statewide and tribal rows
- How to chart disaster declarations over time — the same data by year
FAQ
Which US county has the most federal disaster declarations?
Since 2000, Clay County and Owsley County in Kentucky, with 29 major disaster declarations each in OpenFEMA's data.
How do I count FEMA disaster declarations per county?
Count distinct disasterNumber per county GEOID (fipsStateCode + fipsCountyCode), not rows, and exclude county code 000.