
Disaster Counts Too High: FEMA Declaration Rows Are One per County
On this page
Problem statement
Count the rows in FEMA's Disaster Declarations Summaries for Texas major disasters and you get 3,087. The real number of declarations is 108. The table repeats each declaration once for every county, tribal area or town it designated, and len(df) or value_counts() on it counts designations, not disasters. The same mistake makes 2020 look like it had 9,712 disasters and ranks severe storms above fires. This page shows the repetition, the extra rows below the county, and how to count at the level you mean.
Quick answer
Count disasterNumber.nunique() (or deduplicate on it) for declarations. Count distinct (disasterNumber, fipsStateCode, fipsCountyCode) for county designations, after dropping county code 000. Never count raw rows unless you mean designated areas.
tx = dds[(dds.state == "TX") & (dds.declarationType == "DR")]
print(f"Texas major disasters: {len(tx):,} rows, {tx.disasterNumber.nunique()} declarations")
print(f"whole file: {len(dds):,} rows, {dds.disasterNumber.nunique():,} declarations")
Texas major disasters: 3,087 rows, 108 declarations
whole file: 70,567 rows, 5,281 declarations
Texas has 3,087 rows for 108 major disasters. Across the whole file there are 70,567 rows for 5,281 declarations, so a row count overstates declarations more than thirteenfold.
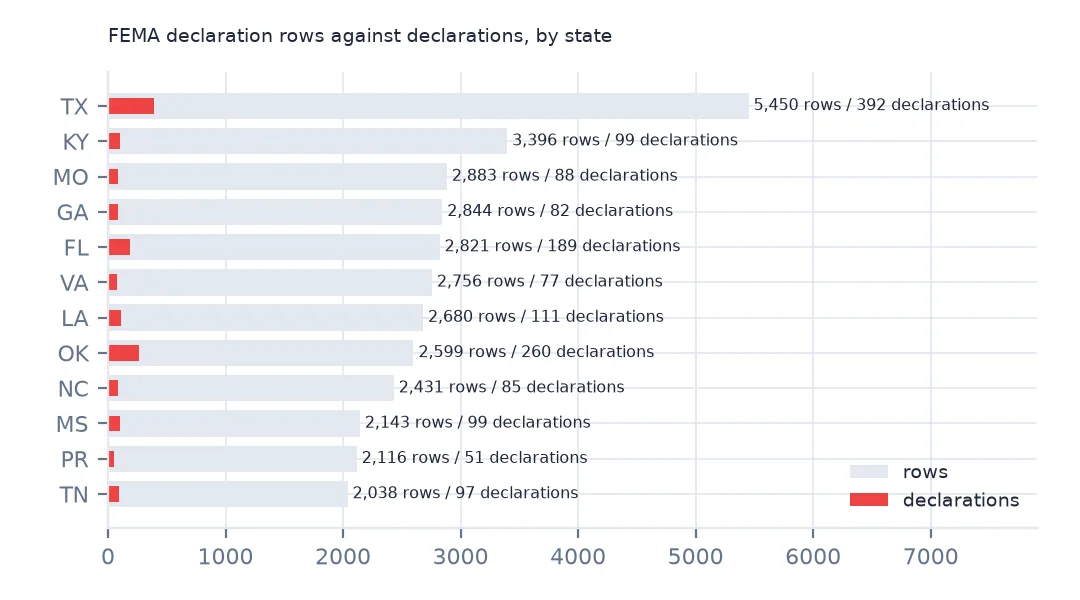
Rows, designations and declarations
1. See the repetition
h = dds[dds.femaDeclarationString == "DR-4332-TX"]
print(f"DR-4332-TX ({h.declarationTitle.iloc[0]}): {len(h)} rows, one per designated area, e.g. {h.designatedArea.head(4).tolist()}")
DR-4332-TX (HURRICANE HARVEY): 53 rows, one per designated area, e.g. ['Nueces (County)', 'Bexar (County)', 'Brazoria (County)', 'Jefferson (County)']
Hurricane Harvey's major disaster declaration, DR-4332-TX, is 53 rows: Nueces, Bexar, Brazoria, Jefferson and every other county designated. The declaration-level fields (title, dates, incident type) repeat on each row. Only the area and its program flags change.
2. Rows below the county
k = ["disasterNumber", "fipsStateCode", "fipsCountyCode"]
dup = dds[dds.duplicated(k, keep=False) & (dds.fipsCountyCode != "000")]
print(f"rows sharing a declaration and county code with another row: {len(dup):,}; states: {dup.state.value_counts().head(5).to_dict()}")
print(dup[dup.state == "ME"][["disasterNumber", "designatedArea", "placeCode"]].head(4).to_string(index=False))
rows sharing a declaration and county code with another row: 936; states: {'ME': 596, 'SD': 156, 'AK': 89, 'VA': 18, 'MN': 16}
disasterNumber designatedArea placeCode
4522 T13 R05 WELS 90518
4522 T32 MD 90650
4522 T36 MD BPP 90656
4522 T04 R09 NWP 90268
Some rows sit below the county: 936 share both declaration and county code with another row. Most are in Maine (596), where unorganised townships are designated individually (T13 R05 WELS, T32 MD), South Dakota and Alaska, where reservations and villages share a county code, and Virginia's independent cities. placeCode tells them apart, but for a county map they collapse into one designation.
3. Count at the level you mean
by_state = pd.DataFrame({"rows": dds.groupby("state").size(), "declarations": dds.groupby("state").disasterNumber.nunique(),
                         "county_declarations": dds[dds.fipsCountyCode != "000"].drop_duplicates(k).groupby("state").size()})
print(by_state.sort_values("rows", ascending=False).head(8).to_string())
rows declarations county_declarations
state
TX 5450 392 5338.0
KY 3396 99 3392.0
MO 2883 88 2876.0
GA 2844 82 2836.0
FL 2821 189 2732.0
VA 2756 77 2734.0
LA 2680 111 2650.0
OK 2599 260 2488.0
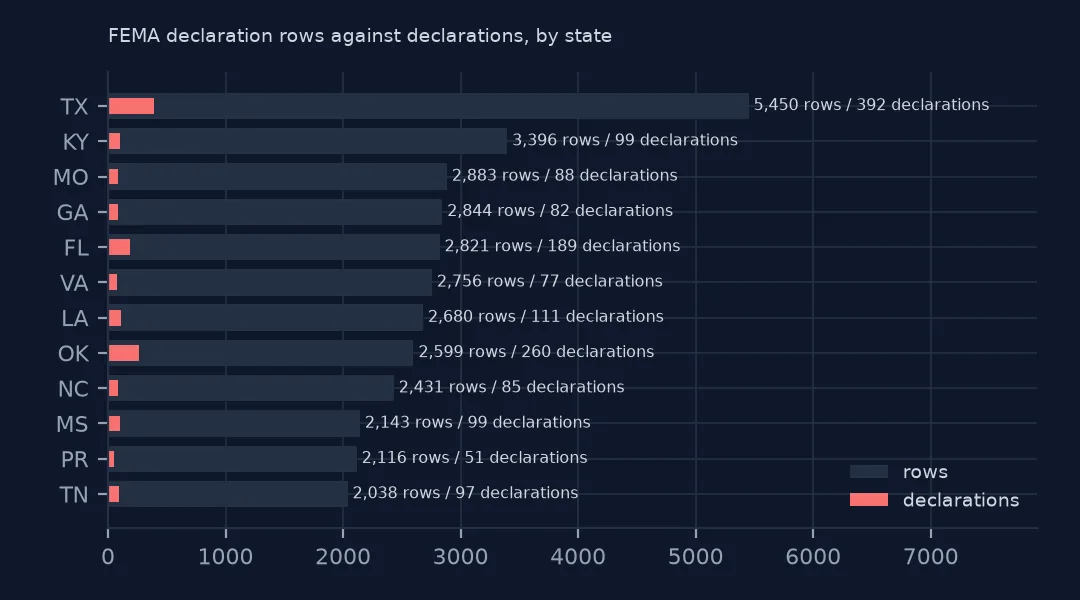
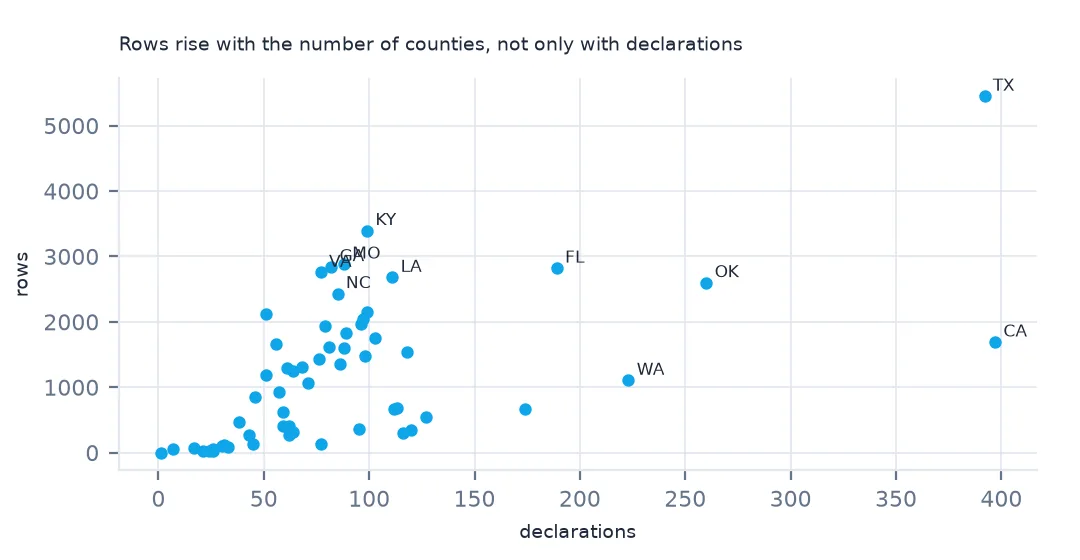
Per state, the three counts diverge. Texas has 5,450 rows across all declaration types, 5,338 county designations and 392 declarations; Oklahoma has 260 declarations but 2,599 rows. Kentucky's rows (3,396) suggest it is second in the country, but it has 99 declarations, fewer than Florida (189) or Oklahoma. Rankings by rows mostly reflect how many counties a state has.
Rankings and years that change
The data used on this page
FEMA's Disaster Declarations Summaries from OpenFEMA, saved on this site on 15 October 2026.
from pathlib import Path

import geopandas as gpd
import numpy as np
import pandas as pd
import requests

Path("data").mkdir(exist_ok=True)
# OpenFEMA, queried on 15 October 2026 and saved on this site because both datasets are revised continually:
# DisasterDeclarationsSummaries v2 (every declaration since 1953, one row per designated area) and NfipClaims v3
# (flood insurance claims with a loss in 2017 or later, 29 fields). The queries are in data/README.txt; the live API is
# https://www.fema.gov/api/open/v2/DisasterDeclarationsSummaries and https://www.fema.gov/api/open/v3/NfipClaims
FILES = ["fema-disaster-declarations-2026-10-15.zip", "nfip-claims-2017-2026-2026-10-15.zip"]
for name in FILES:
    if not Path(f"data/{name}").exists():
        Path(f"data/{name}").write_bytes(requests.get(f"https://data.spatialworkflow.io/{name}", timeout=600).content)
dds = pd.read_csv("data/fema-disaster-declarations-2026-10-15.zip", dtype={"fipsStateCode": str, "fipsCountyCode": str, "placeCode": str},
                  parse_dates=["declarationDate", "incidentBeginDate", "incidentEndDate"])
print(f"OpenFEMA: {len(dds):,} declaration rows for {dds.disasterNumber.nunique():,} declarations, "
      f"{dds.declarationDate.min():%Y}-{dds.declarationDate.max():%Y}")
OpenFEMA: 70,567 declaration rows for 5,281 declarations, 1953-2026
Example 1: incident type rankings change
t = pd.DataFrame({"rows": dds.incidentType.value_counts(), "declarations": dds.drop_duplicates("disasterNumber").incidentType.value_counts()})
t["rank_rows"], t["rank_declarations"] = t.rows.rank(ascending=False).astype(int), t.declarations.rank(ascending=False, method="min").astype(int)
print(t.sort_values("rows", ascending=False).head(8).to_string())
rows declarations rank_rows rank_declarations
incidentType
Severe Storm 19493 1147 1 2
Hurricane 13735 457 2 4
Flood 11507 929 3 3
Biological 7857 167 4 7
Fire 3956 1786 5 1
Snowstorm 3707 171 6 6
Severe Ice Storm 2956 75 7 8
Tornado 1627 183 8 5
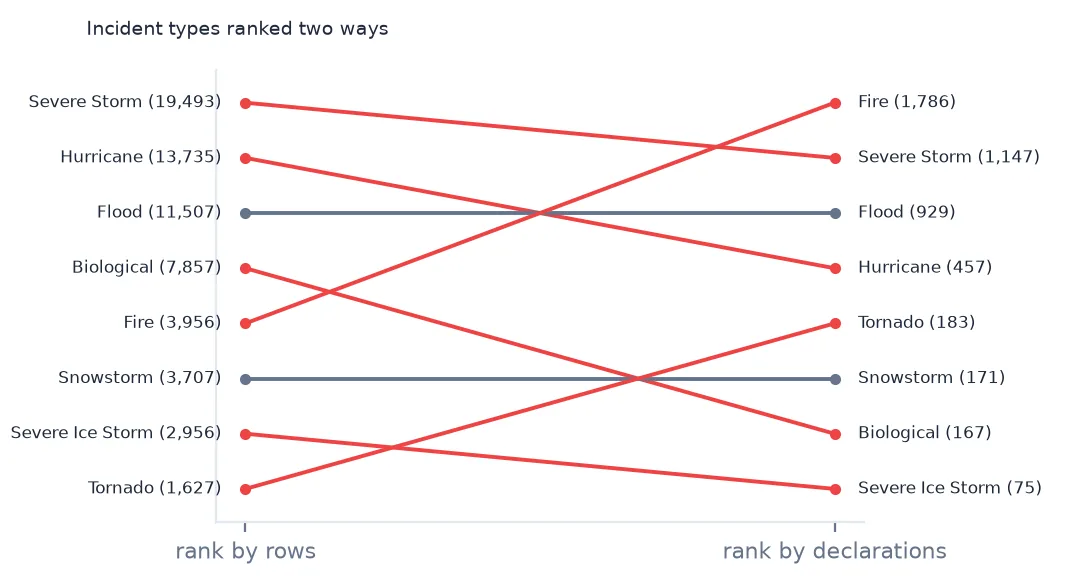
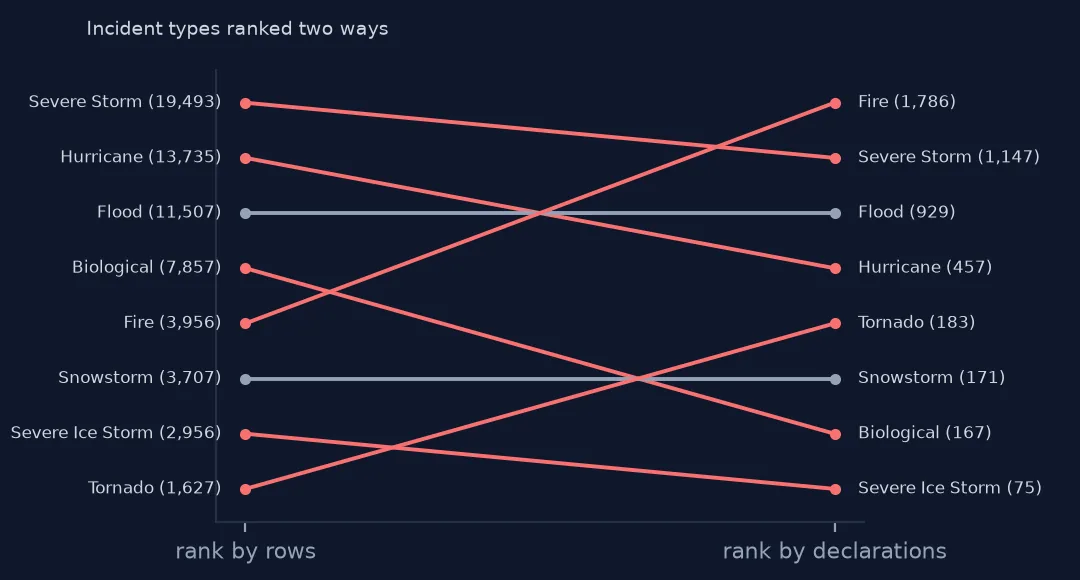
Counting rows ranks severe storms first and fires fifth. Counting declarations puts fires first (1,786, almost all single-county fire management grants) and moves COVID-19 from fourth to seventh. Hurricanes fall from second to fourth, because each designates many counties.
Example 2: the year COVID-19 was declared
y = dds.assign(year=dds.declarationDate.dt.year)
print(pd.DataFrame({"rows": y.groupby("year").size(), "declarations": y.groupby("year").disasterNumber.nunique()}).loc[2017:2025].T.to_string())
year 2017 2018 2019 2020 2021 2022 2023 2024 2025
rows 1668 1184 1666 9712 1962 1141 1119 2364 1203
declarations 137 124 101 315 120 90 114 182 119
2020 has 9,712 rows but 315 declarations. The pandemic designated nearly every county, so any per-year chart of rows shows a spike roughly six times the other years, where the declaration count is a little more than double a normal year.
Why the table is built this way
The Disaster Declarations Summaries table is a designated-areas table. FEMA's programs are authorised per area, and areas are added and changed after the declaration by amendment, so the natural record is one row per declaration per area, with the declaration's attributes copied onto each. That is ideal for questions such as "which counties could get household aid after Harvey" and wrong for "how many disasters did Texas have" unless you deduplicate first.
OpenFEMA also publishes a FEMA Web Disaster Declarations table with one row per declaration. When the question is about declarations, it avoids the issue entirely.
Counting checks
femaDeclarationStringanddisasterNumberare one-to-one; either works as the declaration key.- Deduplicate before joining to other tables, or each join multiplies the rows again.
- Statewide rows (county code
000) count once as a row but cover every county; expand them if you count designations. - Sum program flags per area, not per declaration, or one declaration is counted many times.
Internal links
- How to map FEMA disaster declarations — counting per county correctly
- FEMA declarations that will not join to counties — the rows with no county
- FEMA disaster declarations explained — what a declaration is
FAQ
Why does my count of FEMA disasters look far too high?
Because the declarations summary has one row per designated area. Texas has 3,087 major-disaster rows but 108 major disaster declarations. Count disasterNumber.nunique().
How many FEMA disaster declarations are there?
5,281 declarations (all types) from 1953 to 15 October 2026, in 70,567 rows.