
How to Analyse NFIP Flood Insurance Claims in Python
On this page
Problem statement
The National Flood Insurance Program insures about five million US properties, and FEMA publishes every claim it has paid or closed since 1978, redacted for privacy, through OpenFEMA. It is the best record of where floods actually damaged insured buildings and what they cost. The full table has more than two and a half million claims and more than 70 fields. This page reads the claims since 2017 (506,808 of them), totals the payments by year, event, state and county, and shows how much a handful of hurricanes dominate.
Quick answer
Query NfipClaims (version 3) from OpenFEMA with $select for the fields you need and $filter on yearOfLoss, paging with $top and $skip ordered by id. Add building, contents and Increased Cost of Compliance payments for the total paid, and group by floodEvent, state or countyCode.
nfip["paid"] = nfip.netBuildingPaymentAmount.fillna(0) + nfip.netContentsPaymentAmount.fillna(0) + nfip.netIccPaymentAmount.fillna(0)
print(f"{len(nfip):,} claims with a loss in 2017-2026, paid ${nfip.paid.sum() / 1e9:.1f} billion; median claim ${nfip.paid.median():,.0f}")
print(nfip.groupby("yearOfLoss").agg(claims=("id", "size"), paid_busd=("paid", lambda s: round(s.sum() / 1e9, 2))).T.to_string())
506,808 claims with a loss in 2017-2026, paid $32.4 billion; median claim $21,164
yearOfLoss 2017 2018 2019 2020 2021 2022 2023 2024 2025 2026
claims 145681.00 42625.00 35312.00 33185.00 46699.00 60262.00 21690.00 102054.00 13143.00 6157.00
paid_busd 10.65 1.55 1.52 0.93 1.96 5.26 0.98 8.81 0.63 0.16
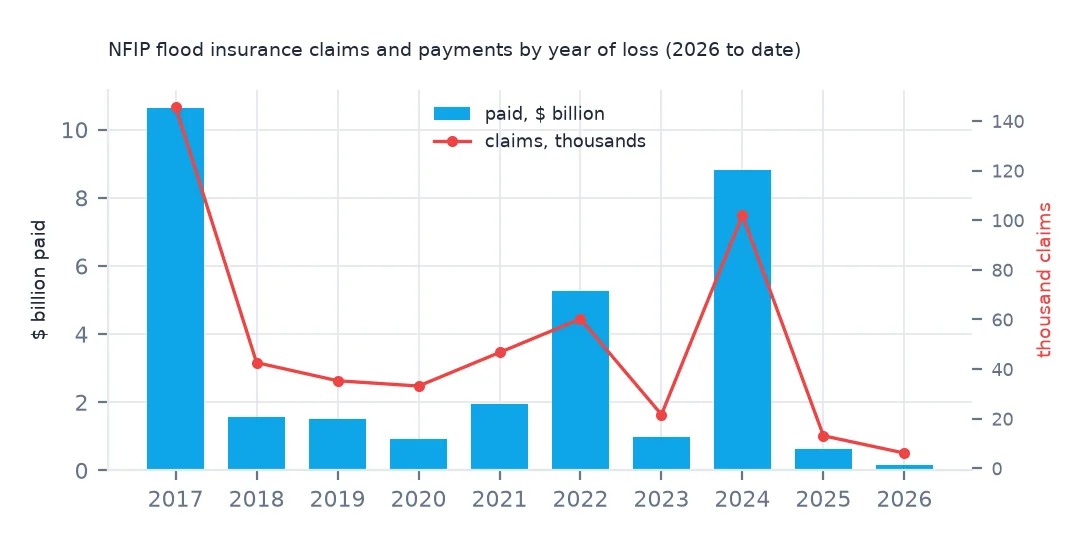
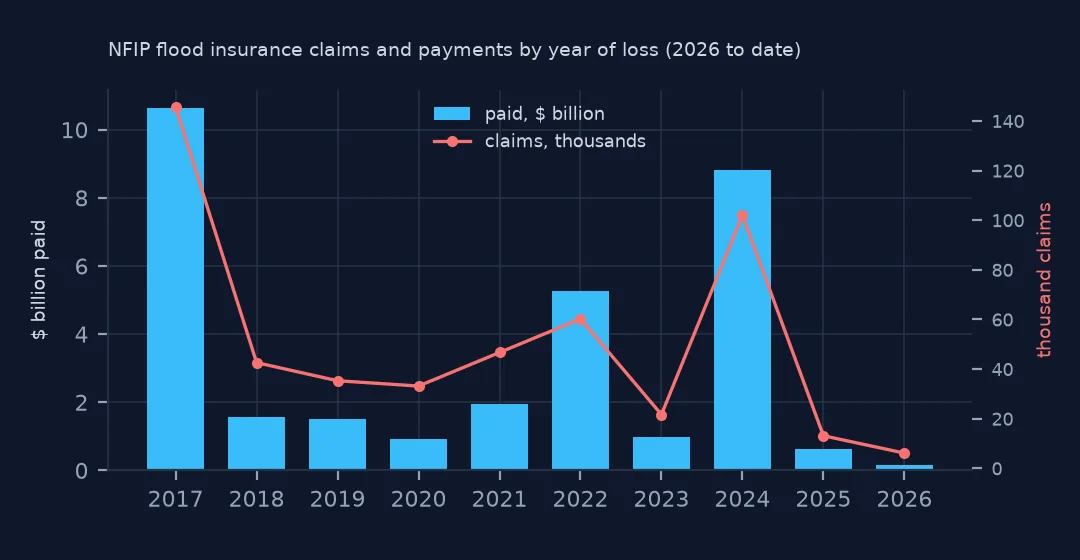
The 506,808 claims with a loss from 2017 to 2026 were paid $32.4 billion; the median claim was $21,164. Two years stand out: 2017 (145,681 claims and $10.65 billion: Harvey, Irma and Maria) and 2024 ($8.81 billion: Helene and Milton). 2026 is incomplete.
Claims, events, states and counties
1. What one row is
print(nfip[["dateOfLoss", "state", "countyCode", "floodEvent", "ratedFloodZone", "buildingDamageAmount", "netBuildingPaymentAmount"]].head(3).to_string(index=False))
print(f"claims with a named flood event: {nfip.floodEvent.notna().mean():.1%}; residential (occupancy 1-3, 11-15): "
      f"{nfip.occupancyType.isin([1, 2, 3, 11, 12, 13, 14, 15]).mean():.1%}")
dateOfLoss state countyCode floodEvent ratedFloodZone buildingDamageAmount netBuildingPaymentAmount
2017-08-27 00:00:00+00:00 TX 48201 Hurricane Harvey X 68000.0 22700.00
2017-08-27 00:00:00+00:00 TX 48167 Hurricane Harvey X 72122.0 78568.82
2019-11-01 00:00:00+00:00 VT 50015 NaN AE 69974.0 64974.37
claims with a named flood event: 76.9%; residential (occupancy 1-3, 11-15): 90.3%
A row is one claim on one policy: date of loss, place, flood zone, damage and payments. The first two rows are Harvey claims in Harris and Galveston counties, both in flood zone X, outside the mapped hazard area. 76.9% of claims carry a named flood event and 90.3% are on residential buildings.
2. Events dominate
ev = nfip.groupby("floodEvent").agg(claims=("id", "size"), paid_busd=("paid", lambda s: s.sum() / 1e9)).sort_values("paid_busd", ascending=False)
print(ev.head(8).round(2).to_string())
print(f"share of all payments in the top 5 events: {ev.paid_busd.head(5).sum() / (nfip.paid.sum() / 1e9):.1%}")
claims paid_busd
floodEvent
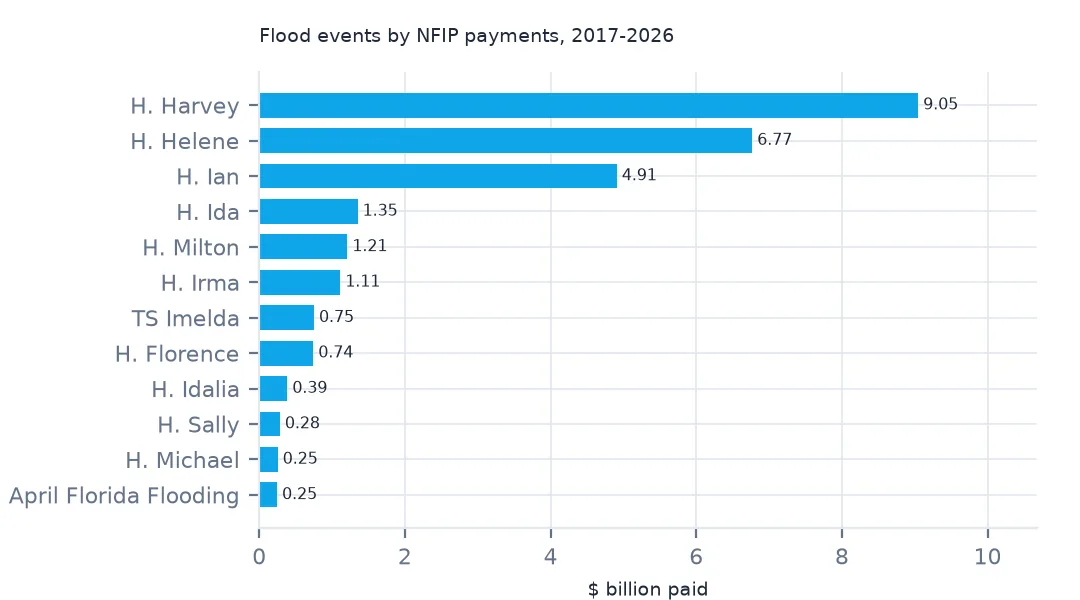
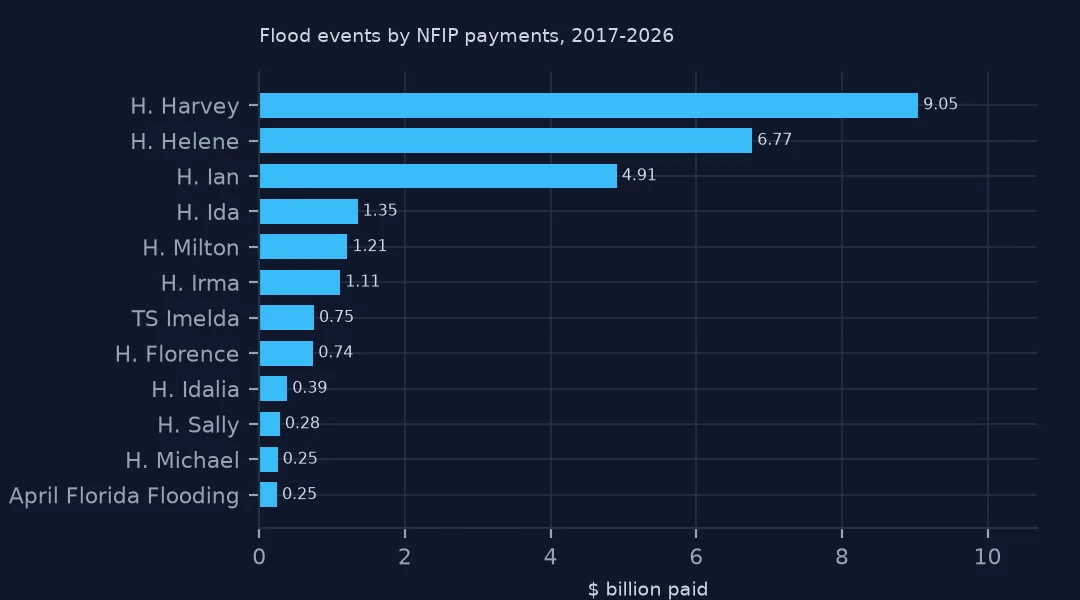
Hurricane Harvey 92398 9.05
Hurricane Helene 58090 6.77
Hurricane Ian 48824 4.91
Hurricane Ida 28318 1.35
Hurricane Milton 21675 1.21
Hurricane Irma 33340 1.11
Tropical Storm Imelda 10940 0.75
Hurricane Florence 16803 0.74
share of all payments in the top 5 events: 71.8%
Hurricane Harvey alone paid $9.05 billion on 92,398 claims, then Helene ($6.77 billion) and Ian ($4.91 billion). The five largest events account for 71.8% of all payments since 2017. Flood insurance losses are not a steady flow but a series of catastrophes, which is why the program borrows from the Treasury after big years.
3. By state and county
st = nfip.groupby("state").agg(claims=("id", "size"), paid_busd=("paid", lambda s: s.sum() / 1e9)).sort_values("paid_busd", ascending=False)
print(st.head(6).round(2).to_string())
nfip["GEOID"] = nfip.countyCode.str.zfill(5)
per = nfip.groupby("GEOID").agg(claims=("id", "size"), paid=("paid", "sum"))
print(f"counties with a claim: {len(per):,}; matching Census counties: {per.index.isin(counties.GEOID).mean():.1%}")
claims paid_busd
state
FL 190644 15.18
TX 124721 10.53
LA 36136 1.51
NC 25727 1.07
NJ 12846 0.48
NY 11946 0.33
counties with a claim: 2,563; matching Census counties: 99.5%
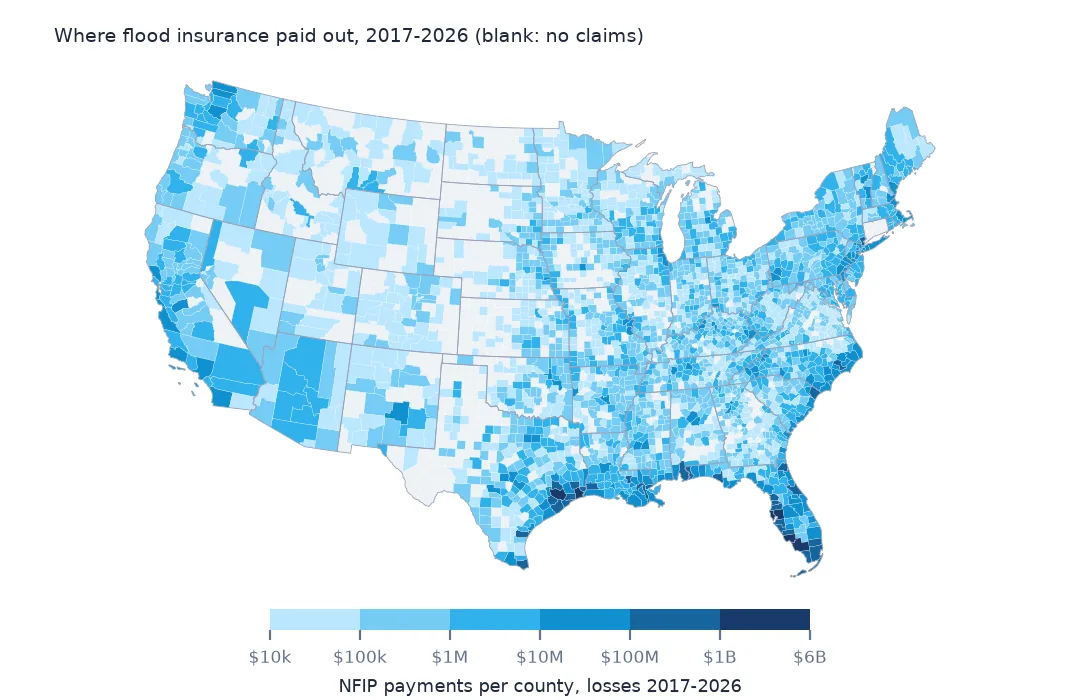
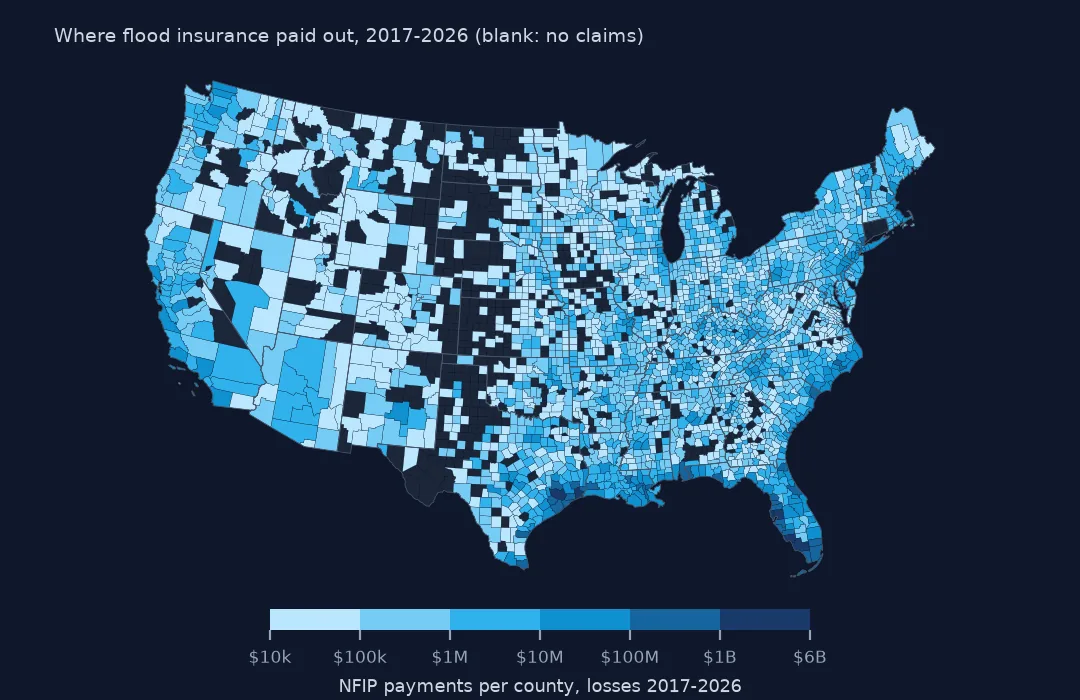
Florida ($15.18 billion) and Texas ($10.53 billion) received most of the money, far ahead of Louisiana, North Carolina and New Jersey. 2,563 counties had at least one claim, and 99.5% of their codes match Census counties.
4. Payments over time within an event
h = nfip[nfip.floodEvent == "Hurricane Helene"]
print(f"Helene: {len(h):,} claims, losses dated {h.dateOfLoss.min():%d %b} to {h.dateOfLoss.max():%d %b %Y}; "
      f"in North Carolina {(h.state == 'NC').sum():,}, Florida {(h.state == 'FL').sum():,}")
Helene: 58,090 claims, losses dated 24 Sep to 05 Oct 2024; in North Carolina 2,028, Florida 54,676
Helene's claims tell a story that its damage does not. Of 58,090 claims, 54,676 were in Florida, from the storm surge on the Gulf coast, and only 2,028 in North Carolina, where Helene's inland flooding killed the most people. Few homes in the mountains had flood insurance. NFIP claims map insured losses, and insurance take-up is far lower inland than on the coast.
Counties and unnamed floods
The data used on this page
FEMA's NFIP Redacted Claims (version 3) from OpenFEMA, every claim with a loss in 2017 or later, saved on this site on 15 October 2026; Census Bureau 2023 county boundaries.
from pathlib import Path

import geopandas as gpd
import numpy as np
import pandas as pd
import requests

Path("data").mkdir(exist_ok=True)
# OpenFEMA, queried on 15 October 2026 and saved on this site because both datasets are revised continually:
# DisasterDeclarationsSummaries v2 (every declaration since 1953, one row per designated area) and NfipClaims v3
# (flood insurance claims with a loss in 2017 or later, 29 fields). The queries are in data/README.txt; the live API is
# https://www.fema.gov/api/open/v2/DisasterDeclarationsSummaries and https://www.fema.gov/api/open/v3/NfipClaims
FILES = ["fema-disaster-declarations-2026-10-15.zip", "nfip-claims-2017-2026-2026-10-15.zip"]
for name in FILES:
    if not Path(f"data/{name}").exists():
        Path(f"data/{name}").write_bytes(requests.get(f"https://data.spatialworkflow.io/{name}", timeout=600).content)
dds = pd.read_csv("data/fema-disaster-declarations-2026-10-15.zip", dtype={"fipsStateCode": str, "fipsCountyCode": str, "placeCode": str},
                  parse_dates=["declarationDate", "incidentBeginDate", "incidentEndDate"])
nfip = pd.read_csv("data/nfip-claims-2017-2026-2026-10-15.zip", low_memory=False, dtype={"countyCode": str, "reportedZipCode": str},
                   parse_dates=["dateOfLoss"])
for name in ["cb_2023_us_county_20m.zip", "cb_2023_us_state_20m.zip"]:
    if not Path(f"data/{name}").exists():
        Path(f"data/{name}").write_bytes(requests.get(f"https://www2.census.gov/geo/tiger/GENZ2023/shp/{name}", timeout=300).content)
counties = gpd.read_file("data/cb_2023_us_county_20m.zip").to_crs(5070)
states = gpd.read_file("data/cb_2023_us_state_20m.zip").to_crs(5070)
print(f"OpenFEMA: {len(dds):,} declaration rows for {dds.disasterNumber.nunique():,} declarations, "
      f"{dds.declarationDate.min():%Y}-{dds.declarationDate.max():%Y}")
OpenFEMA: 70,567 declaration rows for 5,281 declarations, 1953-2026
Example 1: counties with the most paid
c = counties.merge(per.reset_index(), on="GEOID")
print(c.sort_values("paid", ascending=False).head(6).assign(paid_musd=lambda d: (d.paid / 1e6).round(1))[["NAMELSAD", "STUSPS", "claims", "paid_musd"]].to_string(index=False))
NAMELSAD STUSPS claims paid_musd
Harris County TX 58004 5675.4
Lee County FL 39215 3879.4
Pinellas County FL 30247 3576.9
Collier County FL 12694 1112.6
Hillsborough County FL 11462 1112.6
Jefferson County TX 10678 1012.1
Harris County, Texas (Houston) received $5,675.4 million on 58,004 claims, more than any state except Florida and Texas as a whole. The Florida Gulf coast counties of Lee, Pinellas, Collier and Hillsborough follow, and Jefferson County, Texas (Beaumont–Port Arthur) completes the six.
Example 2: claims without an event name
q = nfip[nfip.floodEvent.isna()]
print(f"unnamed claims: {len(q):,}, median paid ${q.paid.median():,.0f}, against ${nfip[nfip.floodEvent.notna()].paid.median():,.0f} for named events")
unnamed claims: 117,154, median paid $6,871, against $32,499 for named events
117,154 claims have no event name: the everyday floods from thunderstorms, snowmelt and nor'easters that never got a name. Their median payment is $6,871, against $32,499 for named events. They are a large share of claims and a small share of money.
What the claims do and do not cover
Only insured buildings appear. Flood insurance is required for buildings in mapped high-risk areas with a federally backed mortgage, and optional elsewhere, so take-up is high on developed coasts and low inland, in the Northeast and in older paid-off homes. A map of claims is a map of insured flood damage, shaped by who buys policies, and it understates damage most where insurance is rare. Helene's mountain flooding is the example here.
FEMA redacts the claims before publishing: no addresses, coordinates rounded to one decimal place, and some fields generalised. The county code is the reliable geography, and the rounded coordinates are for maps at a regional scale.
Reading the claims
- Version 3 replaced version 2 (
FimaNfipClaims) in October 2026, with renamed fields; old queries return nothing. - Payments are net of recoveries, and a few are negative.
waterDepthis meant to be inches but some depths were entered in feet.- Recent events keep changing as claims close. A saved copy is the only way to reproduce a total.
Internal links
- Flood insurance payouts explained — damage, coverage and payment
- How many flood claims come from outside the flood zone? — flood zones and claims
- NFIP claim totals look wrong — the values to clean first
- How to map a hurricane's flood insurance claims — Harvey, Ian and Helene
FAQ
How do I download NFIP flood insurance claims?
From OpenFEMA's NfipClaims v3 endpoint, filtered with $filter and paged with $top/$skip. Claims with a loss since 2017 are 506,808 rows.
Which flood cost the NFIP the most since 2017?
Hurricane Harvey in 2017: $9.05 billion on 92,398 claims, ahead of Helene and Ian.