
Storm Damage Estimates Explained: Why a Few Events Make Most of the Total
On this page
Problem statement
Add up the property damage in NOAA's Storm Events database for 2025 and you get $4.50 billion. That is a small fraction of what insurers and NOAA's own billion-dollar disaster list put on the year, whose Los Angeles fires alone cost tens of billions. The total is not wrong arithmetic. It is the sum of tens of thousands of local office estimates, most of them zero or blank, a handful of them enormous, and some of the costliest events never estimated at all. This page explains what a Storm Events damage figure is, why a few events make most of any total, and how to use the column without misleading anyone.
Quick answer
Treat DAMAGE_PROPERTY as a rough, local, often missing estimate. Report medians or counts of damaging events rather than sums. Show the largest events separately. Never fill blanks with zero. Do not compare the total with insured-loss or disaster-cost series.
p = ev.prop.dropna().sort_values(ascending=False)
print(f"property damage: ${p.sum() / 1e9:.2f} billion over {len(p):,} estimated events; "
      f"top 10 events {p.head(10).sum() / p.sum():.0%}, top 1% {p.head(len(p) // 100).sum() / p.sum():.0%}")
print(f"median estimate ${p.median():,.0f}; mean ${p.mean():,.0f}; zero: {(p == 0).mean():.0%}")
property damage: $4.50 billion over 55,961 estimated events; top 10 events 60%, top 1% 96%
median estimate $0; mean $80,430; zero: 74%
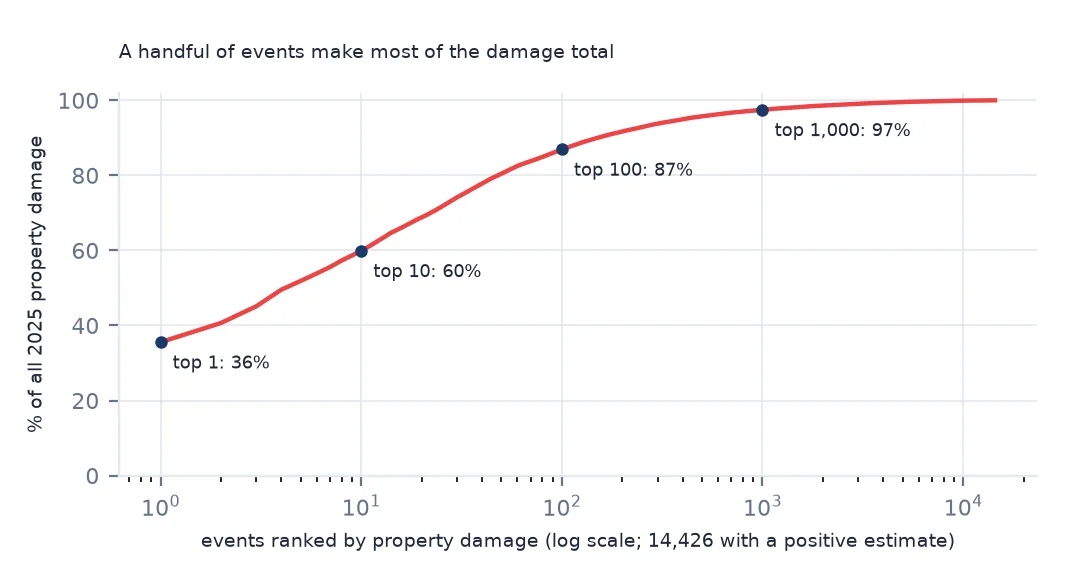
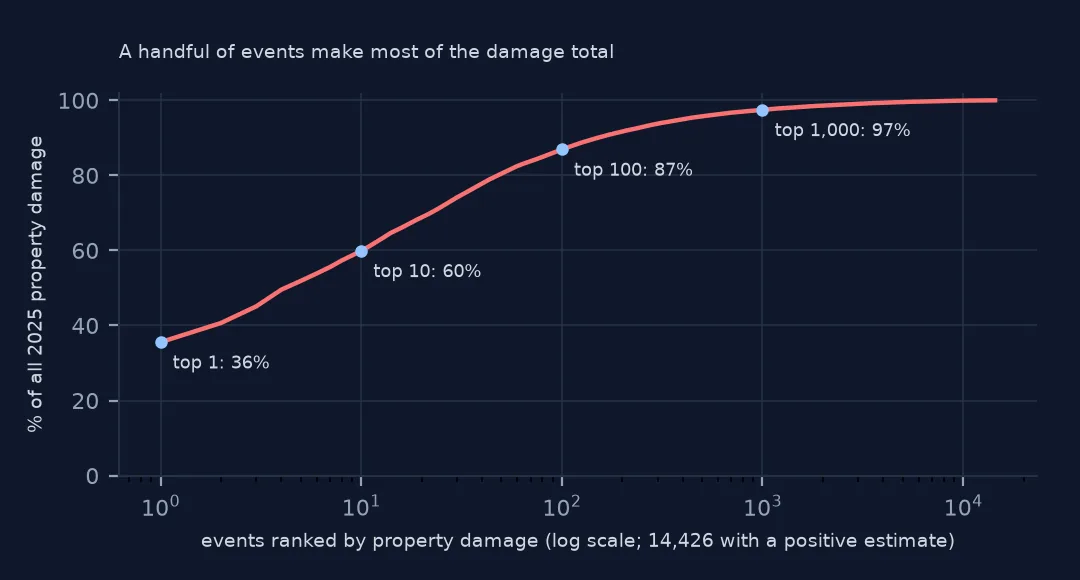
Across 55,961 events with an estimate, the ten largest make up 60% of 2025's property damage and the top 1% make up 96%. The median estimate is $0 and the mean $80,430. 74% of estimates are zero. A sum or mean of this column describes the few largest events, not storms in general.
Blanks, outliers and what is missing
1. Blank, zero and a number are three answers
print(f"blank: {ev.prop.isna().mean():.1%}; zero: {(ev.prop == 0).mean():.1%}; positive: {(ev.prop > 0).mean():.1%}")
print(ev.assign(state=np.select([ev.prop.isna(), ev.prop == 0], ["blank", "zero"], "positive"))
      .groupby("EVENT_TYPE").state.value_counts(normalize=True).unstack().loc[["Hail", "Tornado", "Heat", "Flash Flood"]].round(3).to_string())
blank: 22.7%; zero: 57.4%; positive: 19.9%
state blank positive zero
EVENT_TYPE
Hail 0.336 0.048 0.615
Tornado 0.185 0.425 0.390
Heat 0.298 NaN 0.702
Flash Flood NaN 0.277 0.723
Of all 2025 rows, 22.7% are blank, 57.4% zero and 19.9% positive. The mix depends on the event type: 61.5% of hail rows are zero and 33.6% blank, while 42.5% of tornado rows carry a positive figure. Heat rows are never positive, because offices do not estimate property damage from heat. A blank usually means nobody estimated it, and a zero means someone decided there was none.
2. The largest estimates
cols = ["EVENT_TYPE", "STATE", "CZ_NAME", "begin", "DAMAGE_PROPERTY", "DEATHS_DIRECT"]
print(ev.sort_values("prop", ascending=False)[cols].head(8).to_string(index=False))
EVENT_TYPE STATE CZ_NAME begin DAMAGE_PROPERTY DEATHS_DIRECT
Tornado MISSOURI ST. LOUIS (C) 2025-05-16 13:42:00 1.60B 4
Flash Flood ILLINOIS COOK 2025-08-17 01:30:00 230.00M 0
Flash Flood ILLINOIS COOK 2025-07-25 11:15:00 200.00M 0
Flash Flood TEXAS KERR 2025-07-04 03:00:00 200.00M 61
Flash Flood TEXAS CAMERON 2025-03-27 19:00:00 105.00M 0
Flash Flood WISCONSIN WAUKESHA 2025-08-09 22:00:00 89.00M 0
Wildfire WASHINGTON CENTRAL CHELAN COUNTY 2025-09-01 08:21:00 78.00M 0
Wildfire WASHINGTON CENTRAL CHELAN COUNTY 2025-10-01 00:00:00 78.00M 0
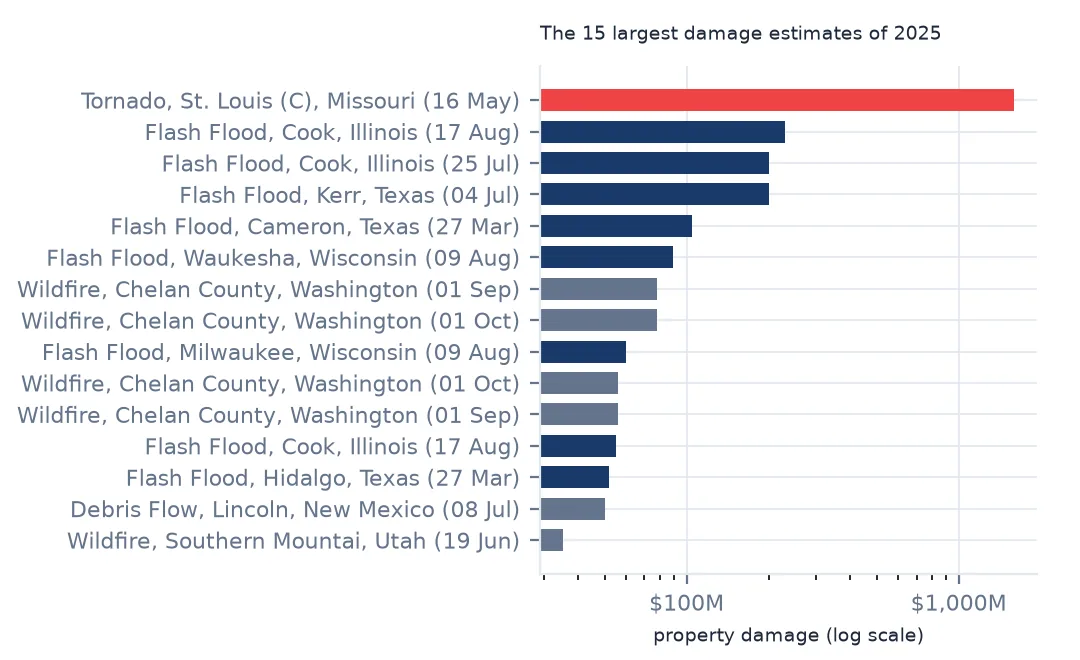
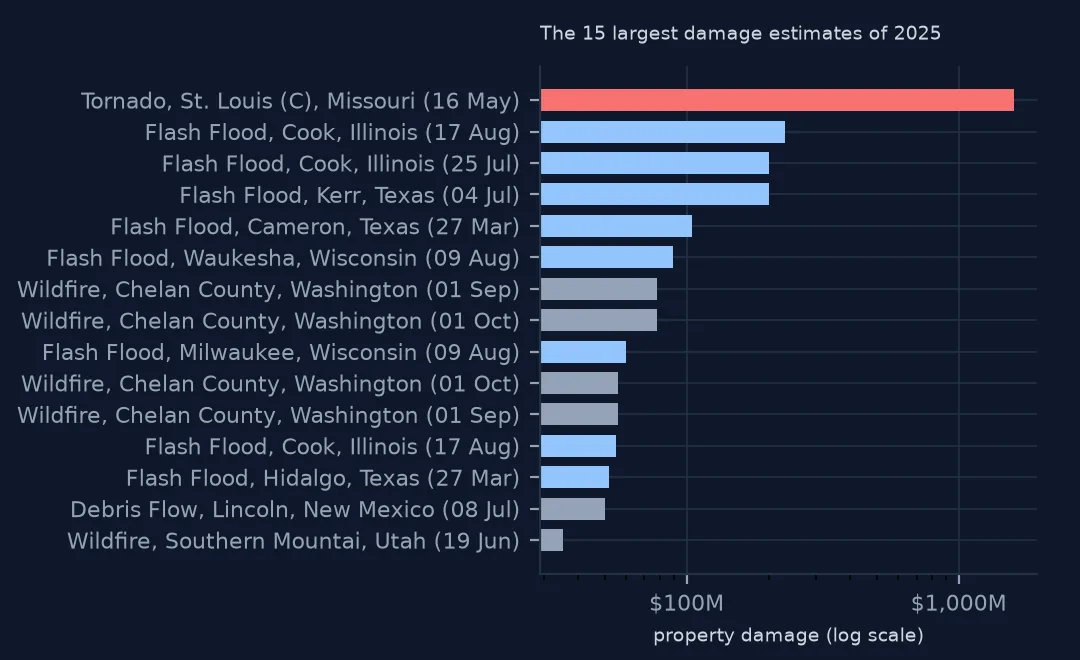
One row stands out. The St. Louis tornado of 16 May is entered at $1.60 billion in the city of St. Louis, more than the next seven events combined. Two Chicago-area flash floods (Cook County, July and August) and the Kerr County flood follow at $200–230 million each. Two Chelan County wildfire rows at $78 million each are a month apart, the same fire entered once per month.
3. What is missing
la = ev[(ev.STATE == "CALIFORNIA") & (ev.EVENT_TYPE == "Wildfire") & (ev.begin.dt.month == 1)]
print(f"California wildfire events in January 2025: {len(la)}, property damage recorded ${la.prop.sum() / 1e6:,.1f} million, "
      f"blank {la.prop.isna().sum()}, direct deaths {la.DEATHS_DIRECT.sum()}")
print(la.EVENT_NARRATIVE.str.extract(r"(The \w+ Fire burned [\d,]+ acres)")[0].dropna().head(3).tolist())
California wildfire events in January 2025: 13, property damage recorded $0.1 million, blank 0, direct deaths 58
['The Eaton Fire burned 14,021 acres', 'The Hurst Fire burned 799 acres', 'The Palisades Fire burned 23,707 acres']
The costliest disaster of 2025 is nearly absent. The 13 California wildfire events of January, including the Eaton Fire (14,021 acres) and the Palisades Fire (23,707 acres), record 58 direct deaths but only $0.1 million of property damage. Thousands of homes burned, but the offices entered no figure, and nothing in the file says the amount is missing. Any damage total from this file misses those losses.
4. Rounding
pos = ev.prop[ev.prop > 0]
lead = pos / 10 ** np.floor(np.log10(pos))
print(f"positive estimates that are 1, 2, 5 or 10 times a power of ten: {lead.round(6).isin([1, 2, 5]).mean():.0%}")
print(pos.value_counts().head(6).to_dict())
positive estimates that are 1, 2, 5 or 10 times a power of ten: 70%
{1000.0: 3328, 5000.0: 1648, 2000.0: 1618, 10000.0: 1175, 3000.0: 849, 500.0: 709}
Estimates are round numbers. 70% of positive estimates are 1, 2 or 5 times a power of ten, and the most common values are $1,000 (3,328 times), $5,000 and $2,000. An office looking at a few downed trees or a damaged roof writes down an order of magnitude, not an adjusted loss. Treat the values as categories (none, thousands, millions) rather than as measurements.
Comparing years and states
The data used on this page
The National Centers for Environmental Information's Storm Events Database details files for 2025 and 2024.
from pathlib import Path

import geopandas as gpd
import numpy as np
import pandas as pd
import requests

Path("data").mkdir(exist_ok=True)
# NOAA NCEI Storm Events Database: the 2025 details and fatalities files (revision c20260819) and the 2024 details file
# (revision c20260728), saved on this site on 15 October 2026 because NCEI replaces a year's files whenever it revises
# them and the old names disappear. Live: https://www.ncei.noaa.gov/pub/data/swdi/stormevents/csvfiles/
FILES = ["storm-events-details-2025-c20260819.csv.gz", "storm-events-fatalities-2025-c20260819.csv.gz",
         "storm-events-details-2024-c20260728.csv.gz"]
for name in FILES:
    if not Path(f"data/{name}").exists():
        Path(f"data/{name}").write_bytes(requests.get(f"https://data.spatialworkflow.io/{name}", timeout=600).content)
ev = pd.read_csv("data/storm-events-details-2025-c20260819.csv.gz", low_memory=False)


def dollars(s):
    """Damage is stored as text: '10.00K', '1.60B', '0' or blank. A blank means no estimate, not zero."""
    s = s.str.strip()
    return pd.to_numeric(s.str.rstrip("KMB"), errors="coerce") * s.str[-1].map({"K": 1e3, "M": 1e6, "B": 1e9}).fillna(1.0)


def times(df):
    """Event times are local to the county or zone ('CST-6'), with a two-digit year."""
    df["begin"] = pd.to_datetime(df.BEGIN_DATE_TIME, format="%d-%b-%y %H:%M:%S")
    df["end"] = pd.to_datetime(df.END_DATE_TIME, format="%d-%b-%y %H:%M:%S")
    df["utc_offset"] = df.CZ_TIMEZONE.str.extract(r"(-?\d+)$")[0].astype(int)
    df["begin_utc"] = df.begin - pd.to_timedelta(df.utc_offset, unit="h")
    df["prop"], df["crops"] = dollars(df.DAMAGE_PROPERTY), dollars(df.DAMAGE_CROPS)
    return df


ev = times(ev)
print(f"{len(ev):,} Storm Events records for 2025, {ev.EPISODE_ID.nunique():,} episodes, {ev.EVENT_TYPE.nunique()} event types")
72,360 Storm Events records for 2025, 9,846 episodes, 48 event types
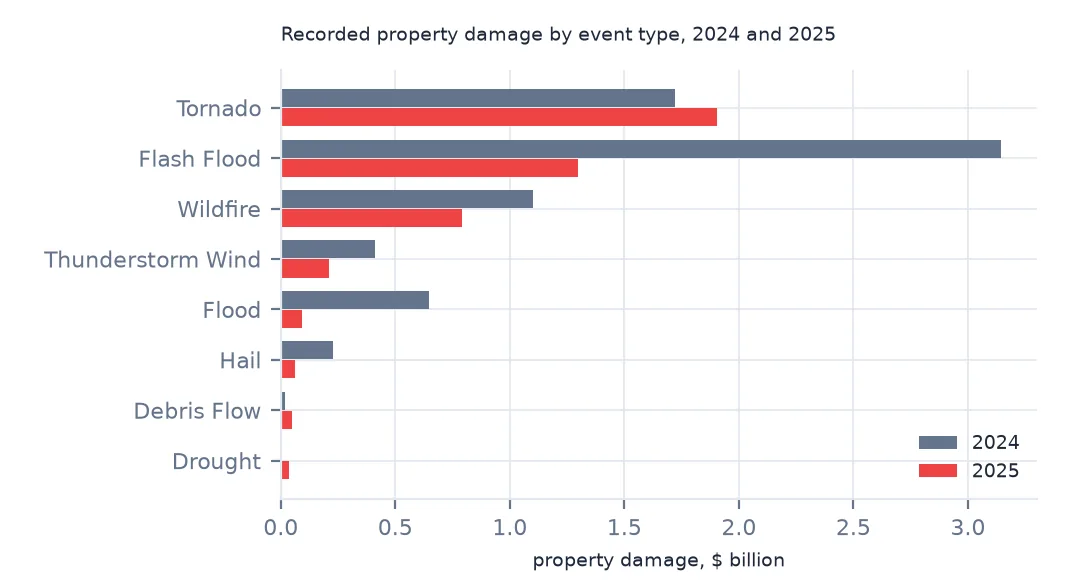
Example 1: damage by event type, two years
ev24 = times(pd.read_csv("data/storm-events-details-2024-c20260728.csv.gz", low_memory=False))
both = pd.DataFrame({"2024": ev24.groupby("EVENT_TYPE").prop.sum(), "2025": ev.groupby("EVENT_TYPE").prop.sum()}) / 1e9
print(both.sort_values("2025", ascending=False).head(8).round(3).to_string())
print(f"totals: 2024 ${ev24.prop.sum() / 1e9:.2f} billion, 2025 ${ev.prop.sum() / 1e9:.2f} billion")
2024 2025
EVENT_TYPE
Tornado 1.721 1.906
Flash Flood 3.143 1.297
Wildfire 1.103 0.789
Thunderstorm Wind 0.412 0.210
Flood 0.649 0.092
Hail 0.227 0.060
Debris Flow 0.016 0.051
Drought 0.000 0.037
totals: 2024 $15.74 billion, 2025 $4.50 billion
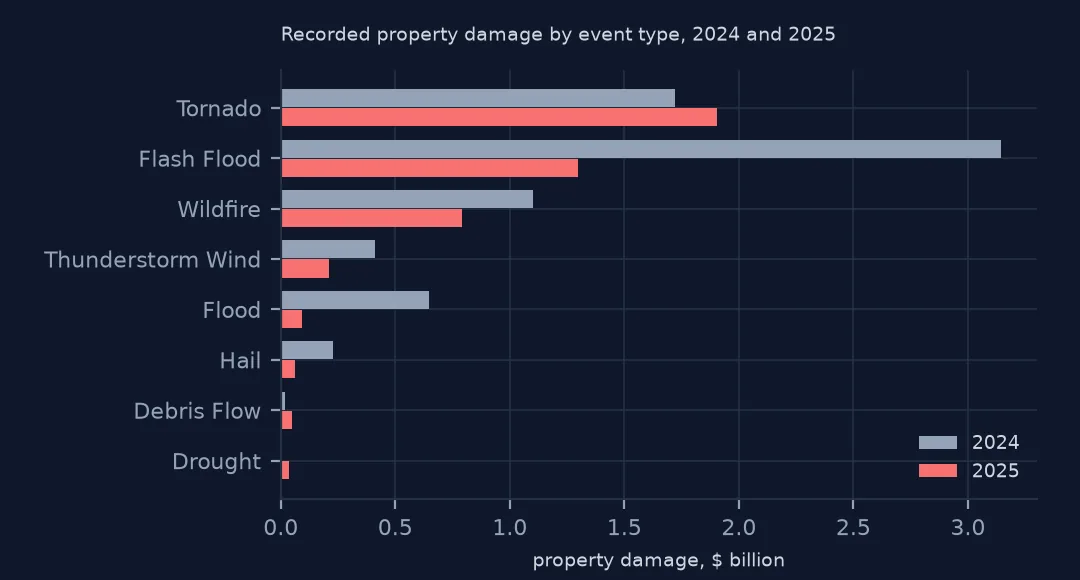
2024's file sums to $15.74 billion against 2025's $4.50 billion, a fall of more than two-thirds. That does not mean 2025 had milder weather. 2024's flash floods (Helene's inland flooding) were estimated at $3.143 billion, and many of its costliest events had figures entered. In 2025, the year's biggest disaster had none. Year-to-year changes in the sum mostly show which large events got an estimate.
Example 2: per state, with and without the largest event
st = ev.groupby("STATE").prop.agg(total="sum", largest="max")
st["share_largest"] = st.largest / st.total
print((st.sort_values("total", ascending=False).head(6).assign(total=lambda x: x.total / 1e6, largest=lambda x: x.largest / 1e6)).round(2).to_string())
total largest share_largest
STATE
MISSOURI 1765.24 1600.0 0.91
WASHINGTON 544.58 78.0 0.14
ILLINOIS 532.47 230.0 0.43
TEXAS 488.48 200.0 0.41
WISCONSIN 182.86 89.0 0.49
OKLAHOMA 87.61 23.0 0.26
By state, the largest single event is 91% of Missouri's total, 43% of Illinois's and 41% of Texas's. Washington's $544.58 million is spread more evenly (14% for its largest), because its wildfires were entered as many monthly zone rows. A state map of damage totals mostly shows where one big event happened.
Who estimates the damage, and how
Damage figures are entered by the forecast office that writes up the event, usually from what it can find within weeks: emergency managers' preliminary assessments, media reports, its own survey teams. Directive NWSI 10-1605 asks for a best estimate, rounded, and allows offices to leave it blank when no information exists. There is no adjustment for inflation and no reconciliation with insurance claims, and the estimate is seldom revised once entered.
That makes the column a different quantity from insured or economic loss. NOAA's billion-dollar disasters series is built from insurance and federal assistance data and attributes whole events, such as the Los Angeles fires, to the year. Storm Events records local, immediate, approximate figures per county or zone. Both are correct for what they measure.
Using the damage column honestly
- Show the outliers. Any chart of damage by type or state should name its largest event, or readers will think the bar is many storms.
- Prefer counts of damaging events (estimate > 0) to dollar sums for comparisons across places.
- Do not adjust and sum decades. Completeness changed over time: the 1980 file has no blanks at all, so a zero there can also mean no estimate. The raw column is not a consistent time series.
- Crops are separate (
DAMAGE_CROPS) and even sparser. Drought crop losses are mostly absent.
Internal links
- Storm Events damage columns will not sum — reading the strings
- How to count weather deaths — the other cost column
- How to read the Storm Events database — the files and fields
FAQ
Why is the Storm Events damage total so much lower than disaster cost estimates?
The column holds local office estimates. Many are blank or zero, and some catastrophes have no figure at all: the January 2025 Los Angeles fires are entered at $0.1 million. Insurance-based totals are a different measurement.
Is a blank damage value the same as zero?
No. A blank means no estimate was made. In 2025, 22.7% of rows are blank and 57.4% are an explicit zero.