
How to map floods from Sentinel-1 in Python
On this page
Problem statement
Floods come with cloud, which is why radar is the standard tool for mapping them: calm open water is the darkest surface in a Sentinel-1 image, and a pass a day or two after the event sees it through whatever weather is overhead. The simple version — threshold the post-event image — maps every lake, every river and every smooth dark surface as flood. A usable flood map needs a pre-event image to subtract what was already water, a threshold chosen from the data rather than copied, a filter against speckle, and an honest statement of what radar cannot see.
South of Valencia, after the flood of 29 October 2024, the Sentinel-1 pass of 1 November shows about 42 km² of new open water around the Albufera lagoon, against a pass on the same orbit twelve days earlier. How much of that is the flood and how much is the rice fields that are flooded every autumn is a question the radar alone cannot answer — and the towns where the flood did most damage barely register.
Quick answer
Compare a filtered post-event image with a filtered pre-event image from the same orbit, and call new water what is dark after and was not dark before:
import numpy as np
from skimage.filters import threshold_otsu
from sar_io import search, passes, grid, read_pass, to_db
from sar_filters import lee_filter                  # from the speckle-filtering guide

bbox = [-0.46, 39.25, -0.33, 39.45]
g = grid(bbox, "EPSG:25830")
P = passes(search(bbox, "2024-10-20/2024-11-01", orbit=110))
(pre_day, _), (post_day, _) = list(P)
pre = to_db(lee_filter(read_pass(P[(pre_day, 110)], "vv", g)))
post = to_db(lee_filter(read_pass(P[(post_day, 110)], "vv", g)))

thr = threshold_otsu(post[np.isfinite(post)])
new_water = (post < thr) & (pre >= thr) & (post - pre < -3)
print(f"{pre_day} -> {post_day}: threshold {thr:.1f} dB, new water {new_water.sum() * 100 / 1e6:.1f} km²")
2024-10-20 -> 2024-11-01: threshold -13.0 dB, new water 41.8 km²
The last condition — a drop of at least 3 dB — stops pixels that sat just above the threshold before and just below it after from being counted as flooding.
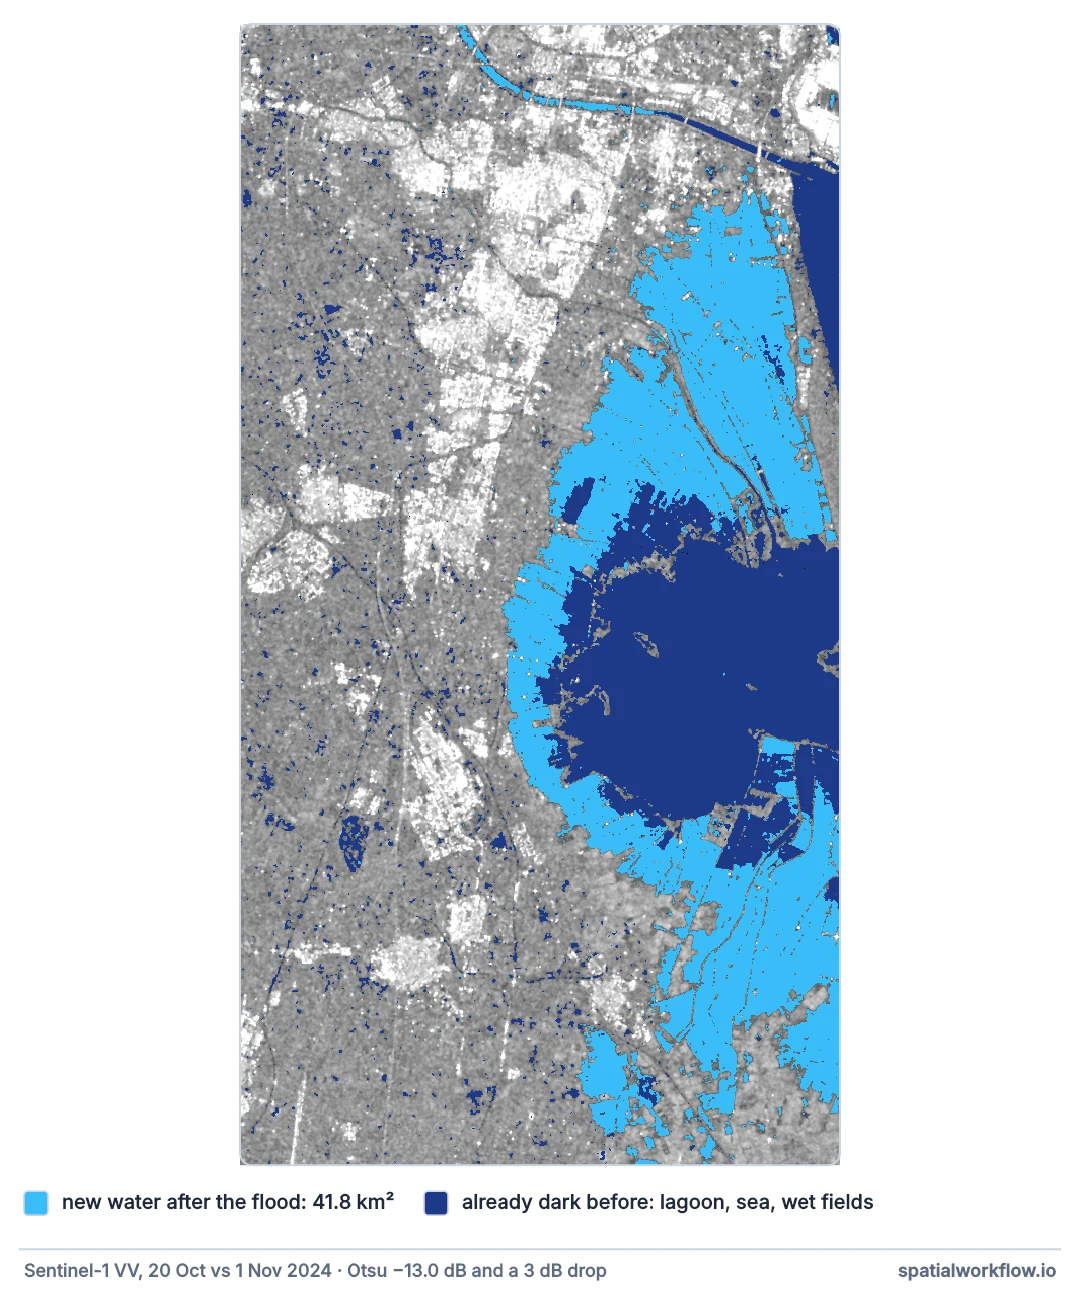
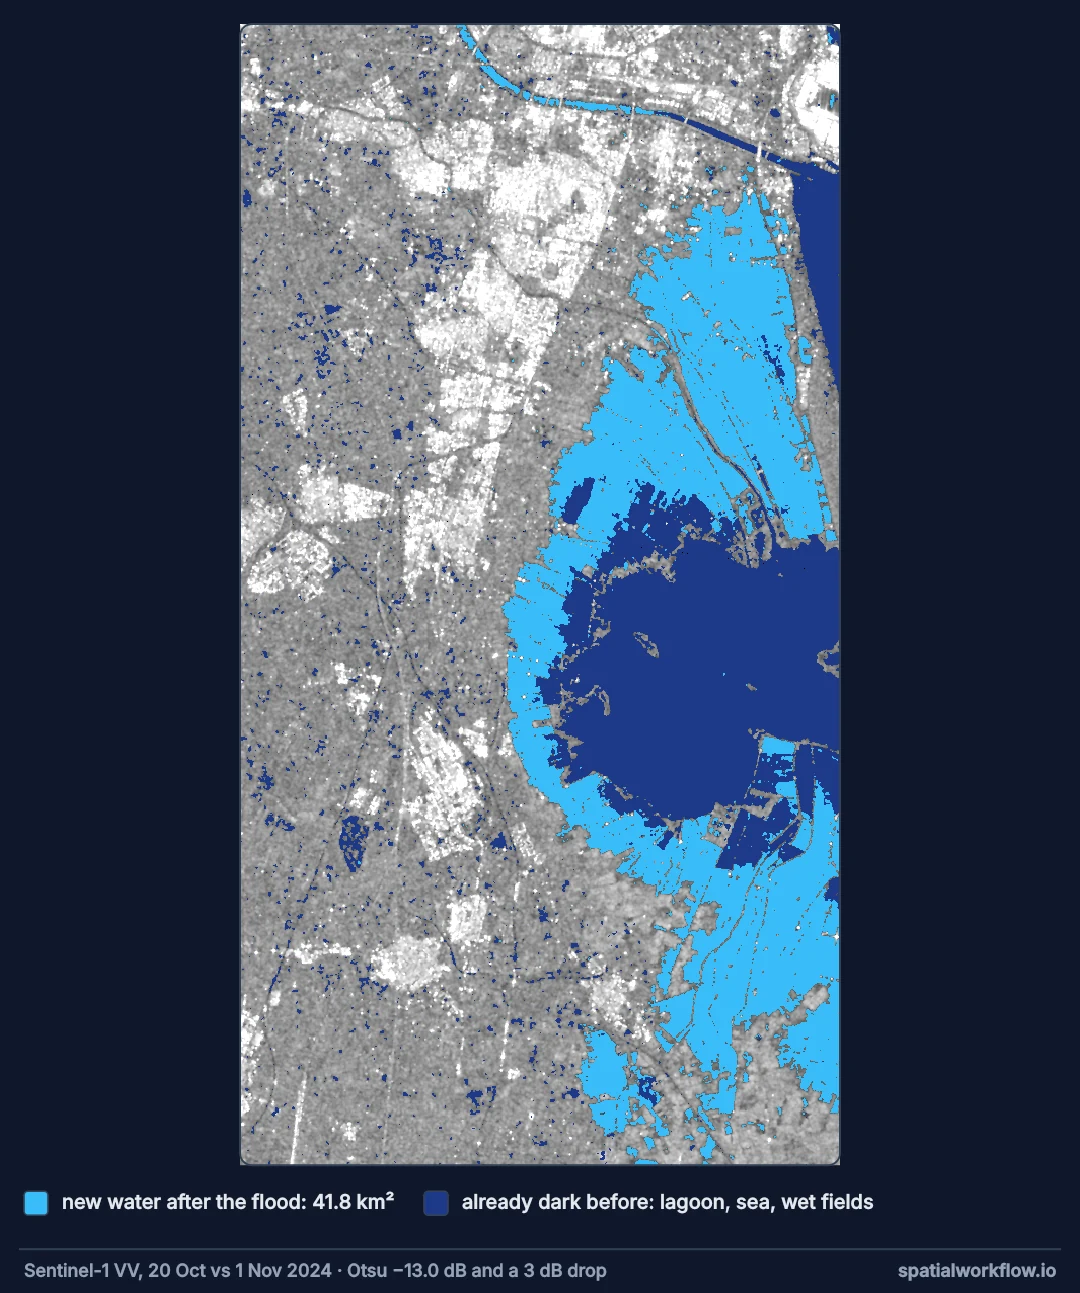
Matched pre- and post-event passes, a data-driven threshold
1. Find a post-event pass and a matching pre-event pass
Same relative orbit, as close in time as possible before the event. Different orbits change incidence angle and look direction, and with them the backscatter of everything that did not flood.
2. Filter speckle
A 5 × 5 Lee filter on linear intensity, before converting to decibels. An unfiltered threshold map is salt and pepper.
3. Choose the threshold from the data
Otsu's method finds the value that best separates two classes in a histogram. It needs both classes present in reasonable proportions; if the scene is mostly land, compute it on tiles that contain water and land, not on the whole image.
4. Test for change
New water is below the threshold after, above it before, and darker by a margin. The margin guards against noise near the threshold.
5. Remove permanent water and small patches
Anything that was water before is not flood. Patches of a handful of pixels are more likely speckle or a single dark field than water; a minimum mapping unit of about 0.1 ha removes them.
6. Say what the map cannot show
Flooded towns, flooded forests and water under standing crops do not appear dark to C-band radar. A SAR flood map is a map of open-water flooding.
Threshold sensitivity, clean-up and the towns
The data used on this page
Sentinel-1 radiometrically terrain-corrected backscatter (sentinel-1-rtc) from the Microsoft Planetary Computer, read through sar_io.py — the small module from the reading guide that searches, groups frames into passes and mosaics each pass onto a fixed grid.
%%writefile sar_io.py
"""Find, read and mosaic Sentinel-1 RTC scenes from Microsoft Planetary Computer."""
from collections import defaultdict

import numpy as np
import planetary_computer
import pystac_client
import rasterio
from rasterio.enums import Resampling
from rasterio.transform import from_origin
from rasterio.vrt import WarpedVRT
from rasterio.warp import transform_bounds

STAC = "https://planetarycomputer.microsoft.com/api/stac/v1"


def search(bbox, dates, orbit=None, direction=None, collection="sentinel-1-rtc"):
    """Items over bbox (lon/lat) in a date range, filtered by relative orbit and pass direction."""
    cat = pystac_client.Client.open(STAC, modifier=planetary_computer.sign_inplace)
    items = cat.search(collections=[collection], bbox=bbox, datetime=dates).item_collection()
    keep = [i for i in items
            if (orbit is None or i.properties["sat:relative_orbit"] == orbit)
            and (direction is None or i.properties["sat:orbit_state"] == direction)]
    return sorted(keep, key=lambda i: i.datetime)


def passes(items):
    """Group frames into passes: same day, same relative orbit."""
    groups = defaultdict(list)
    for i in items:
        groups[(i.datetime.date(), i.properties["sat:relative_orbit"])].append(i)
    return dict(sorted(groups.items()))


def grid(bbox, crs, res=10):
    """A fixed target grid: every pass is read onto this, so arrays line up."""
    left, bottom, right, top = transform_bounds(4326, crs, *bbox)
    width, height = int((right - left) // res), int((top - bottom) // res)
    return {"crs": crs, "transform": from_origin(left, top, res, res),
            "width": width, "height": height}


def read_pass(frames, band, g):
    """Mosaic one pass's frames for one band onto grid g. Linear power; NaN where no data."""
    out = np.full((g["height"], g["width"]), np.nan, dtype="float32")
    for item in frames:
        with rasterio.open(item.assets[band].href) as src, WarpedVRT(
                src, crs=g["crs"], transform=g["transform"], width=g["width"],
                height=g["height"], resampling=Resampling.bilinear, nodata=np.nan) as vrt:
            a = vrt.read(1)
        a[a <= 0] = np.nan                       # -32768 nodata and zero-padding
        fill = np.isnan(out) & np.isfinite(a)
        out[fill] = a[fill]
    return out


def to_db(linear):
    return 10 * np.log10(linear)
Overwriting sar_io.py
lee_filter comes from the speckle-filter guide, saved as sar_filters.py:
%%writefile sar_filters.py
"""The Lee speckle filter from the speckle-filter guide."""
import numpy as np
from scipy.ndimage import uniform_filter

def lee_filter(img, size=5, enl=4.4):
    """Lee filter on linear intensity. Smooths homogeneous areas, keeps edges.
    enl: equivalent number of looks of the input (4.4 for Sentinel-1 IW GRD/RTC)."""
    ok = np.isfinite(img)
    x = np.where(ok, img, 0.0)
    n = uniform_filter(ok.astype("float64"), size)
    mean = uniform_filter(x, size) / np.maximum(n, 1e-9)
    sq = uniform_filter(x * x, size) / np.maximum(n, 1e-9)
    var = np.maximum(sq - mean ** 2, 0)
    noise = (mean ** 2) / enl                    # variance speckle alone would produce
    weight = np.clip((var - noise) / np.maximum(var, 1e-12), 0, 1)
    out = mean + weight * (x - mean)
    return np.where(ok, out, np.nan)
Overwriting sar_filters.py
Example 1 — how much the threshold matters
for t in (thr, -15, -18, -20):
    nw = (post < t) & (pre >= t) & (post - pre < -3)
    print(f"threshold {t:6.1f} dB: new water {nw.sum() * 100 / 1e6:5.1f} km²")
threshold -13.0 dB: new water 41.8 km²
threshold -15.0 dB: new water 39.1 km²
threshold -18.0 dB: new water 31.6 km²
threshold -20.0 dB: new water 18.7 km²
Example 2 — clean up and measure
from scipy.ndimage import label
import pystac_client, planetary_computer, rasterio
from rasterio.enums import Resampling
from rasterio.vrt import WarpedVRT

cat = pystac_client.Client.open("https://planetarycomputer.microsoft.com/api/stac/v1",
                                modifier=planetary_computer.sign_inplace)
wc_item = next(cat.search(collections=["esa-worldcover"], bbox=bbox).items())
with rasterio.open(wc_item.assets["map"].href) as src, WarpedVRT(
        src, crs=g["crs"], transform=g["transform"], width=g["width"], height=g["height"],
        resampling=Resampling.nearest) as vrt:
    wc = vrt.read(1)

flood = new_water & (wc != 80)                          # not mapped as permanent water
lab, n = label(flood)
sizes = np.bincount(lab.ravel())
keep = sizes >= 10                                      # 10 pixels = 0.1 ha at 10 m
keep[0] = False
flood = keep[lab]
print(f"{n:,} patches before, {int(keep.sum()):,} kept; flood {flood.sum() * 100 / 1e6:.1f} km²")
for code, name in {40: "cropland", 90: "wetland", 30: "grassland", 50: "built-up", 10: "tree cover"}.items():
    print(f"  on {name:10} {np.sum(flood & (wc == code)) * 100 / 1e6:5.2f} km²")
588 patches before, 191 kept; flood 41.5 km²
on cropland 29.05 km²
on wetland 11.41 km²
on grassland 0.74 km²
on built-up 0.15 km²
on tree cover 0.06 km²
Of the 41.5 km² that survive the clean-up, 29 km² are on land WorldCover maps as cropland and 11 km² on herbaceous wetland — the paddies and marsh around the lagoon. Built-up land contributes 0.15 km².
Example 3 — the towns
built = wc == 50
d = post - pre
print(f"built-up pixels: median change {np.nanmedian(d[built]):+.2f} dB; "
      f"darker by 3 dB or more: {np.nanmean(d[built] < -3):.1%}")
print(f"cropland pixels: median change {np.nanmedian(d[wc == 40]):+.2f} dB; "
      f"darker by 3 dB or more: {np.nanmean(d[wc == 40] < -3):.1%}")
built-up pixels: median change +0.93 dB; darker by 3 dB or more: 2.5%
cropland pixels: median change +0.21 dB; darker by 3 dB or more: 34.4%
The towns west of the lagoon, where the flood caused most of its damage, show almost no darkening: built-up pixels got brighter on median, and only 2.5% of them darkened by 3 dB, against 34.4% of cropland. There are two reasons, and these two images cannot separate them: three days after the flood much of the water had drained from the streets, and where water does stand between buildings, it reflects the pulse into the walls and back to the sensor, keeping flooded streets as bright as dry ones or brighter.
Why the pre-event image matters most
Why the pre-event image matters more than the threshold
A single post-event image cannot tell a flood from a lake, a reservoir, a rice paddy, wet tarmac or radar shadow; all are dark. Every one of them except the flood is dark before the event too. Change detection removes them all at once, which no choice of threshold can do.
Why the rice fields are ambiguous
The paddies around the Albufera are flooded deliberately every autumn and winter, and they turn from land to water in radar at roughly the time of year this flood happened. The change detection is correct that they became water between 20 October and 1 November; attributing that to the flood needs local knowledge, a third date, or an independent source such as the Copernicus Emergency Management Service's delineation.
Why cities are missing
Flooded urban areas are one of the known blind spots of C-band flood mapping, even when the image is taken while the water is still there. Specular reflection off the water surface into building walls strengthens the double-bounce return, so streets under water can become brighter, not darker. Detecting urban flooding needs coherence from interferometric pairs, very high-resolution imagery, or other data entirely.
Wind, timing and validation
- Wind roughens water and can hide it; check the post-event weather.
- Timing. Floods recede; a pass three days after the peak maps what was left.
- VV over VH for water: the contrast is larger and VH is near the noise floor.
- Hand-picked thresholds from other studies rarely transfer; compute your own.
- HAND or slope masks remove dark pixels on hillsides that cannot hold water.
- Validate against an independent delineation before publishing an area.
Internal links
- How to filter speckle in Sentinel-1 images — the
lee_filterused here - A SAR flood map shows water where there is none — false positives
- How to detect change between two Sentinel-1 images — change detection in general
- Height above nearest drainage explained — a terrain mask for flood maps
- An inundation map floods inland areas that cannot flood — connectivity for modelled floods
- How to find Sentinel-1 scenes in Python — matching pre and post passes
FAQ
How do I map a flood with Sentinel-1?
Take a post-event and a pre-event image from the same orbit, filter speckle, threshold both, and map pixels that became dark.
What threshold should I use for water?
Compute one from your data, for example with Otsu's method on a region with both land and water. Values between −15 and −20 dB in VV are typical but not universal.
Why does my flood map include lakes and rivers?
Without a pre-event image, permanent water is indistinguishable from flood.
Can Sentinel-1 see flooded cities?
Poorly. Double bounce makes flooded streets bright, not dark.
Should I use VV or VH?
VV. It gives stronger water contrast.
How soon after a flood is data available?
Within hours to a day of the pass for near-real-time products; passes over a given area occur every few days.