
How to Calculate Fire Weather Indices in Python
On this page
Problem statement
Fire behaviour follows the weather: hot, dry air dries fuels, wind drives flames and carries embers, and the humidity that returns at night usually slows a fire down until morning. Fire weather indices combine these into one number that can be mapped, ranked and compared with what a fire actually did. The simplest widely used one, the Fosberg Fire Weather Index (FFWI), needs only temperature, relative humidity and wind speed. Hourly values of all three are available for any place on Earth from reanalysis, without an account.
This page computes the FFWI at the Park Fire's origin for three weeks around its start on 24 July 2024 from Open-Meteo's ERA5 archive. It looks at how humid the nights got, and compares hourly fire weather with the fire's radiative power measured by GOES-18.
Quick answer
Fetch hourly temperature (°F), humidity (%) and wind (mph), compute the equilibrium moisture content, damp it, and scale by wind:
def ffwi(t_f, rh, wind_mph):
    m = np.where(rh < 10, 0.03229 + 0.281073 * rh - 0.000578 * rh * t_f,
        np.where(rh < 50, 2.22749 + 0.160107 * rh - 0.01478 * t_f,
                 21.0606 + 0.005565 * rh ** 2 - 0.00035 * rh * t_f - 0.483199 * rh))   # equilibrium moisture content, %
    eta = 1 - 2 * (m / 30) + 1.5 * (m / 30) ** 2 - 0.5 * (m / 30) ** 3                  # moisture damping
    return eta * np.sqrt(1 + wind_mph ** 2) / 0.3002

wx["ffwi"] = ffwi(wx.temperature_2m, wx.relative_humidity_2m, wx.wind_speed_10m)
daily = wx.resample("D").agg({"temperature_2m": "max", "relative_humidity_2m": "min", "wind_gusts_10m": "max", "ffwi": "max"})
daily.index = daily.index.date
print(daily.loc[pd.Timestamp("2024-07-21").date():pd.Timestamp("2024-07-28").date()].round(1).to_string())
temperature_2m relative_humidity_2m wind_gusts_10m ffwi
2024-07-21 101.3 17 19.0 21.7
2024-07-22 106.3 15 18.8 21.2
2024-07-23 107.5 15 22.6 28.0
2024-07-24 103.6 15 40.3 36.9
2024-07-25 102.0 11 25.7 33.0
2024-07-26 101.6 10 26.4 31.5
2024-07-27 85.5 24 26.8 28.9
2024-07-28 91.1 18 22.6 25.6
Context, overnight recovery, what the fire did
1. Put the day in context
A high index means little without knowing what is normal for the place. Rank the days of the three-week window:
top = daily.loc[:pd.Timestamp("2024-08-04").date()].sort_values("ffwi", ascending=False).head(4)
print(top[["ffwi", "wind_gusts_10m"]].round(1).to_string())
print(f"window median of daily maximum FFWI: {daily.ffwi.loc[:pd.Timestamp('2024-08-04').date()].median():.1f}")
ffwi wind_gusts_10m
2024-07-24 36.9 40.3
2024-07-19 33.1 26.6
2024-07-25 33.0 25.7
2024-07-26 31.5 26.4
window median of daily maximum FFWI: 25.0
The fire's first day ranks first, with the strongest gusts of the three weeks. Its next two days follow close behind.
2. Check the overnight recovery
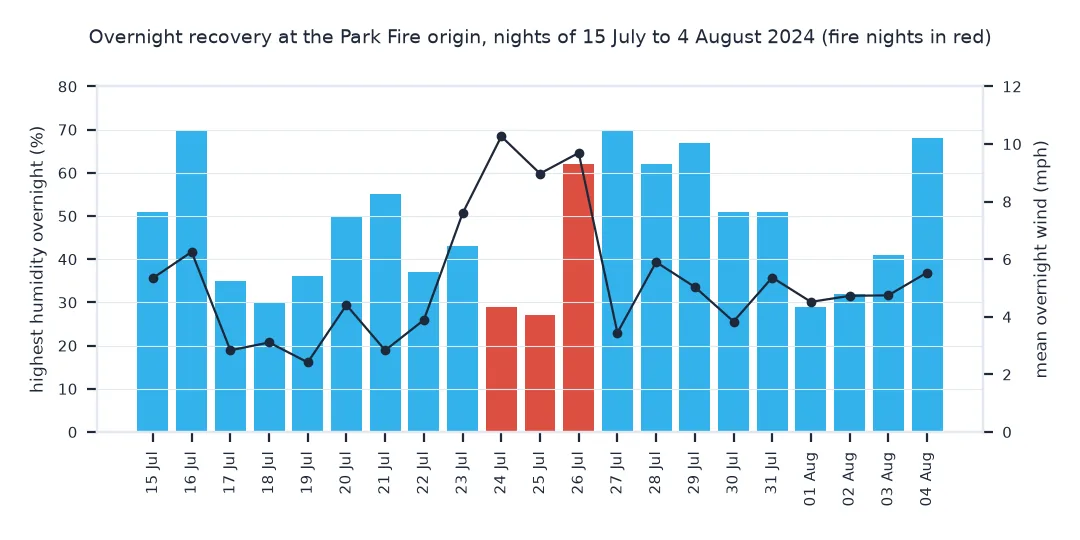
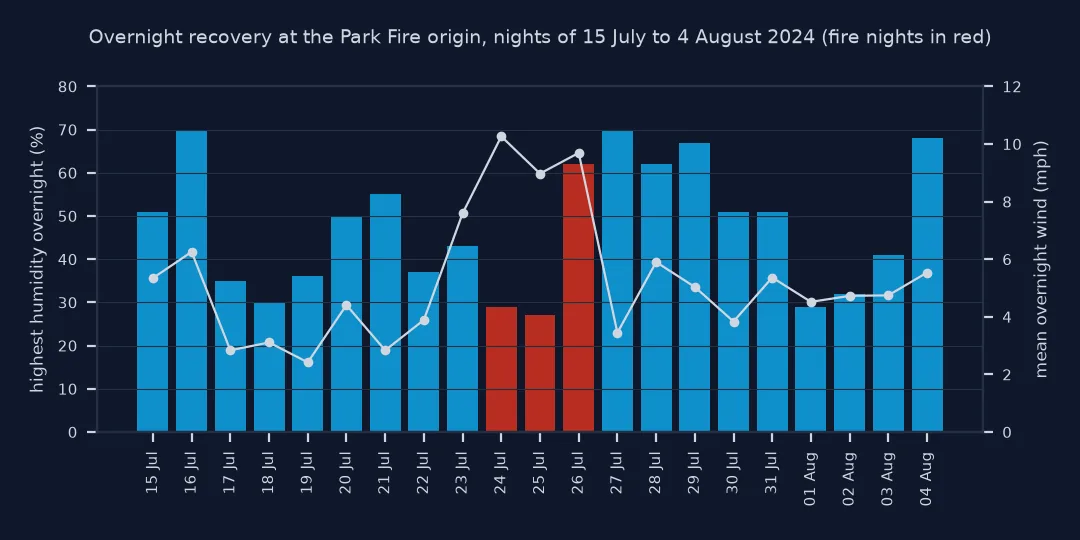
Humidity normally rises at night, fuels take up moisture and fires lie down. Poor recovery, a night that stays dry and windy, lets a fire keep running. Take each night from 22:00 to 08:00, labelled by the evening it starts:
night = wx[(wx.index.hour >= 22) | (wx.index.hour <= 8)]
nights = night.groupby((night.index - pd.Timedelta(hours=9)).date).agg(
    rh_max=("relative_humidity_2m", "max"), wind_mean=("wind_speed_10m", "mean"))
nights = nights.loc[pd.Timestamp("2024-07-15").date():pd.Timestamp("2024-08-04").date()]
print(nights.loc[pd.Timestamp("2024-07-21").date():pd.Timestamp("2024-07-27").date()].round(1).to_string())
print(f"driest nights in the window: {', '.join(f'{d:%d %b} ({r}%)' for d, r in nights.rh_max.nsmallest(3).items())}")
print(f"windiest nights: {', '.join(f'{d:%d %b} ({v:.1f} mph)' for d, v in nights.wind_mean.nlargest(3).items())}")
rh_max wind_mean
2024-07-21 55 2.8
2024-07-22 37 3.9
2024-07-23 43 7.6
2024-07-24 29 10.3
2024-07-25 27 9.0
2024-07-26 62 9.7
2024-07-27 70 3.4
driest nights in the window: 25 Jul (27%), 24 Jul (29%), 01 Aug (29%)
windiest nights: 24 Jul (10.3 mph), 26 Jul (9.7 mph), 25 Jul (9.0 mph)
The fire's first three nights were the three windiest of the window. On the first two, humidity never rose above 29%; on the third it reached 62%.
3. Compare with what the fire did
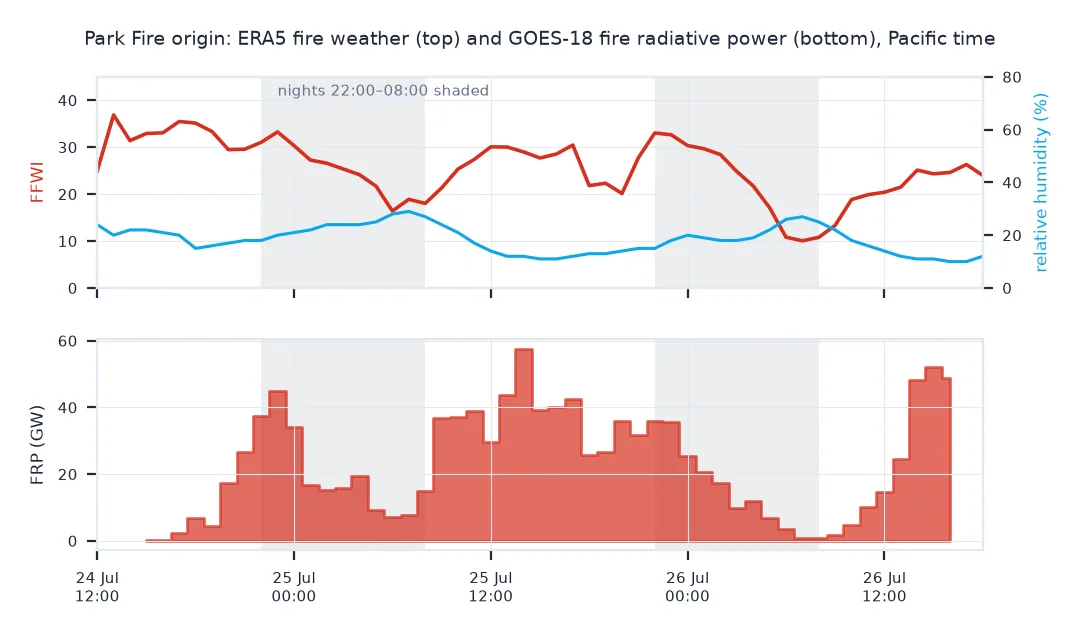
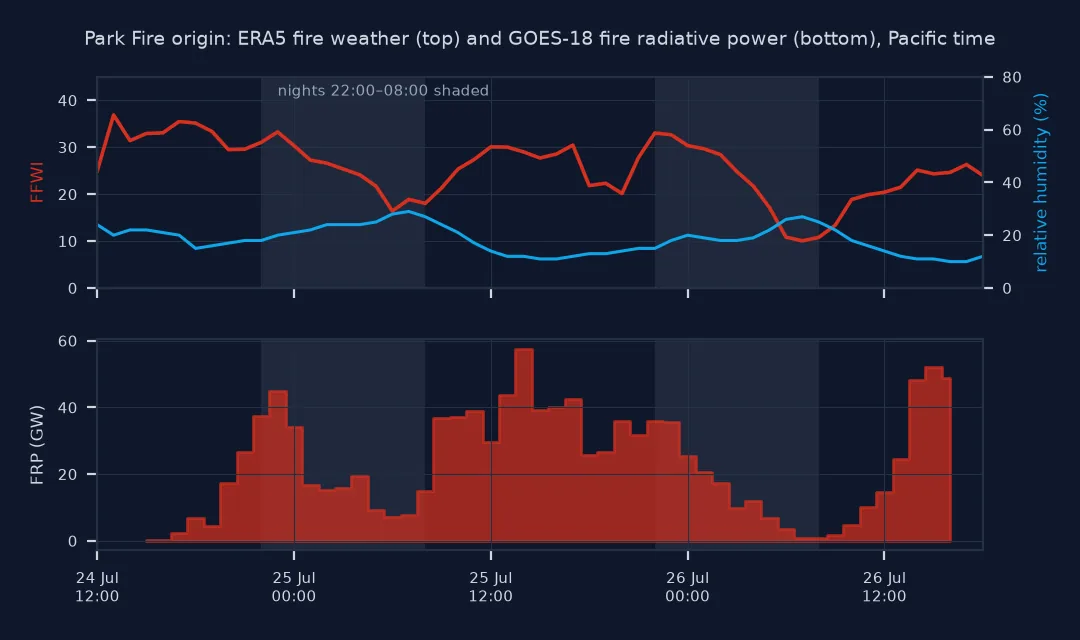
GOES-18 fire radiative power (FRP), summed over the fire every 15 minutes and averaged by hour, measures how hard the fire burned. Rank correlations show which weather variable tracked it most closely over its first two days:
both = wx.join(FRP.rename("frp"), how="inner")
corr = both[["relative_humidity_2m", "vapour_pressure_deficit", "ffwi", "wind_speed_10m"]].corrwith(both.frp, method="spearman")
print(f"{len(both)} hours; Spearman correlation with hourly FRP:")
print(corr.round(2).to_string())
50 hours; Spearman correlation with hourly FRP:
relative_humidity_2m -0.63
vapour_pressure_deficit 0.43
ffwi 0.29
wind_speed_10m 0.18
Humidity tracks the fire's power better than the combined index. FFWI gives wind a large weight, and on these days the fire's intensity followed the daily cycle of heat and dryness more closely than the wind. A growing fire also burns harder simply because it is bigger, which no weather index can see.
A surface hot-dry-windy proxy
The data used on this page
Hourly ERA5 reanalysis from the Open-Meteo historical weather API for the grid cell nearest the Park Fire's origin (39.80° N, 121.79° W), 14 July to 5 August 2024, in local time; and GOES-18 ABI fire detections (ABI-L2-FDCC) from NOAA's archive on AWS, one scan every 15 minutes from 21:00 UTC on 24 July to 23:45 UTC on 26 July.
import re
from pathlib import Path

import numpy as np
import pandas as pd
import requests
import xarray as xr
from pyproj import Proj

r = requests.get("https://archive-api.open-meteo.com/v1/archive", params=dict(
    latitude=39.80, longitude=-121.79, start_date="2024-07-14", end_date="2024-08-05",
    hourly="temperature_2m,relative_humidity_2m,wind_speed_10m,wind_gusts_10m,wind_direction_10m,vapour_pressure_deficit",
    timezone="America/Los_Angeles", temperature_unit="fahrenheit", wind_speed_unit="mph"), timeout=60).json()
wx = pd.DataFrame(r["hourly"])
wx.index = pd.to_datetime(wx.pop("time")).dt.tz_localize("America/Los_Angeles")
Path("data/fdc").mkdir(parents=True, exist_ok=True)
B = "https://noaa-goes18.s3.amazonaws.com/"
FILES = []
for day in (206, 207, 208):
    for h in range(21 if day == 206 else 0, 24):
        text = requests.get(B, params={"list-type": 2, "prefix": f"ABI-L2-FDCC/2024/{day}/{h:02d}/"}, timeout=60).text
        for k in re.findall(r"<Key>([^<]+)</Key>", text):
            if int(re.search(r"_s\d{9}(\d{2})", k).group(1)) % 15 < 5:
                f = Path("data/fdc", k.rsplit("/", 1)[1])
                if not f.exists():
                    f.write_bytes(requests.get(B + k, timeout=120).content)
                FILES.append(f)
with xr.open_dataset(FILES[0], engine="h5netcdf") as ds:
    p = ds.goes_imager_projection
    meanings = dict(zip(ds.Mask.attrs["flag_values"].tolist(), ds.Mask.attrs["flag_meanings"].split()))
    proj = Proj(proj="geos", h=p.perspective_point_height, lon_0=p.longitude_of_projection_origin, sweep=p.sweep_angle_axis,
                a=p.semi_major_axis, b=p.semi_minor_axis)
    x, y = ds.x.values * p.perspective_point_height, ds.y.values * p.perspective_point_height
codes = [c for c, n in meanings.items() if n.endswith("fire_pixel") and "no_fire" not in n]
bx, by = proj([-122.3, -121.3, -122.3, -121.3], [39.6, 39.6, 40.5, 40.5])
IX, IY = (x >= min(bx)) & (x <= max(bx)), (y >= min(by)) & (y <= max(by))
scans = {}
for f in FILES:
    with xr.open_dataset(f, engine="h5netcdf") as ds:
        fire = np.isin(ds.Mask.values[np.ix_(IY, IX)], codes)
        t = pd.Timestamp(ds.attrs["time_coverage_start"].rstrip("Z"), tz="UTC").tz_convert("America/Los_Angeles")
        scans[t] = float(np.nansum(np.where(fire, ds.Power.values[np.ix_(IY, IX)], 0)))
FRP = pd.Series(scans).sort_index().resample("h").mean().loc["2024-07-24 15:00":]
print(f"{len(wx)} hours of weather at {r['latitude']:.2f}, {r['longitude']:.2f} ({r['elevation']:.0f} m); "
      f"{len(FILES)} GOES scans, FRP peak {FRP.max() / 1000:.1f} GW")
552 hours of weather at 39.82, -121.84 (232 m); 204 GOES scans, FRP peak 57.6 GW
Example 1: a surface hot-dry-windy proxy
The Hot-Dry-Windy Index multiplies vapour pressure deficit by wind speed, both taken as the maximum in the lowest 500 m of the atmosphere. With only surface values, the same product is a proxy:
wx["hdw_proxy"] = wx.vapour_pressure_deficit * 10 * wx.wind_speed_10m * 0.44704      # hPa x m/s
d = wx.hdw_proxy.resample("D").max().loc[:"2024-08-04"]
print(f"highest days: {', '.join(f'{t:%d %b} {v:.0f}' for t, v in d.nlargest(3).items())}; window median {d.median():.0f}")
highest days: 24 Jul 361, 23 Jul 321, 19 Jul 313; window median 205
Fire weather indices are compact physics
Fire weather indices are compact physics. The FFWI turns temperature and humidity into the moisture content that fine dead fuels such as grass and needles would reach in equilibrium, converts that into a damping factor between 0 and 1, and multiplies by a wind term. It answers one question: how readily would fine fuels ignite and carry fire at this moment? It knows nothing about the fuels actually present, the terrain or the fire's own size.
Reanalysis such as ERA5 gives hourly weather for any grid cell, which makes indices like this easy to compute anywhere and for any past date. Its cells are about 25 km across, though, and it smooths local winds in canyons and on ridges, exactly where fires make their runs. For operations, weather stations such as RAWS and high-resolution forecasts are the standard. For mapping and for comparing days and seasons, reanalysis is consistent and free.
Units, local time and gusts
- Units: the FFWI equations use °F, % and mph. Ask Open-Meteo for those units, or convert before calling the function.
- Local time: Open-Meteo returns local clock times when
timezoneis set, sotz_localizewith the same zone is correct here. For UTC data usetz_convert. - Gusts vs mean wind: the FFWI uses sustained wind; gusts are worth reporting separately.
- Other indices: the Canadian Fire Weather Index system, the US National Fire Danger Rating System and the Australian Forest Fire Danger Index carry fuel-moisture memory from day to day; the FFWI does not.
- Grid cell: the nearest ERA5 cell may sit at a different elevation from the fire; Open-Meteo reports the cell's elevation (232 m here).
Internal links
- How to track a wildfire with GOES fire detections — the FRP used here
- How to map a wildfire's spread from GOES detections — the overnight runs seen as area
FAQ
What is the Fosberg Fire Weather Index?
An index from temperature, relative humidity and wind speed that estimates how readily fine fuels would ignite and spread fire, on a scale of about 0 to 100.
Where can I get historical weather for fire analysis?
Open-Meteo's archive API serves ERA5 reanalysis hourly for any location without a key. Weather stations such as RAWS give observations at fire-prone sites.
Why does overnight humidity matter for wildfires?
Fine fuels take up moisture when humidity rises at night, which slows fires. A dry, windy night lets a fire keep spreading.
Does a high fire weather index mean a fire will be large?
No. It describes conditions; a fire needs an ignition and fuel, and its size also depends on terrain and suppression.