
How to Build an Airline Route Network and Draw Great-Circle Routes in Python
On this page
Problem statement
An airline network is a graph: airports are nodes, routes are edges, and the number of flights on a route is its weight. Turning a year of flights into that graph is a few lines of pandas and networkx, and the graph answers questions a table cannot — which airports hold the network together, how many connections a trip between two random airports needs, which places depend on a single hub. Drawing it is a separate problem: routes are great circles on a curved Earth, and a straight line between two airports on a longitude–latitude map is not the path any aircraft flies.
This page builds the 2025 US domestic route network from the BTS on-time file, measures it, and draws it with the right curves.
Quick answer
Sort each flight's two airports so that A–B and B–A count as one route, count flights per route, and load the counts into an undirected weighted graph:
import networkx as nx

flown = flights[flights.Cancelled == 0]
pair = pd.DataFrame(np.sort(flown[["Origin", "Dest"]].values, axis=1), columns=["a", "b"])
routes = pair.value_counts().rename("flights").reset_index()
G = nx.Graph()
G.add_weighted_edges_from(routes[["a", "b", "flights"]].itertuples(index=False), weight="flights")
print(f"{G.number_of_nodes()} airports, {G.number_of_edges():,} routes, {nx.number_connected_components(G)} connected component(s)")
deg = pd.Series(dict(G.degree())).sort_values(ascending=False)
print("airports with the most nonstop destinations:", deg.head(5).to_dict())
352 airports, 3,480 routes, 1 connected component(s)
airports with the most nonstop destinations: {'DEN': 186, 'DFW': 185, 'ORD': 180, 'ATL': 151, 'CLT': 136}
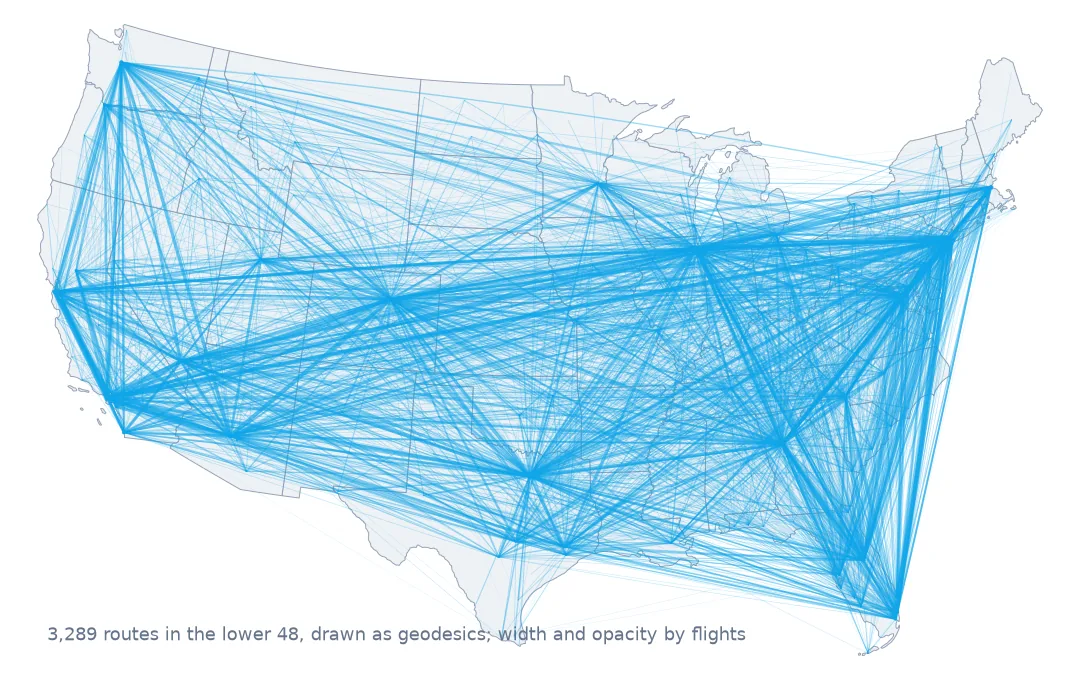
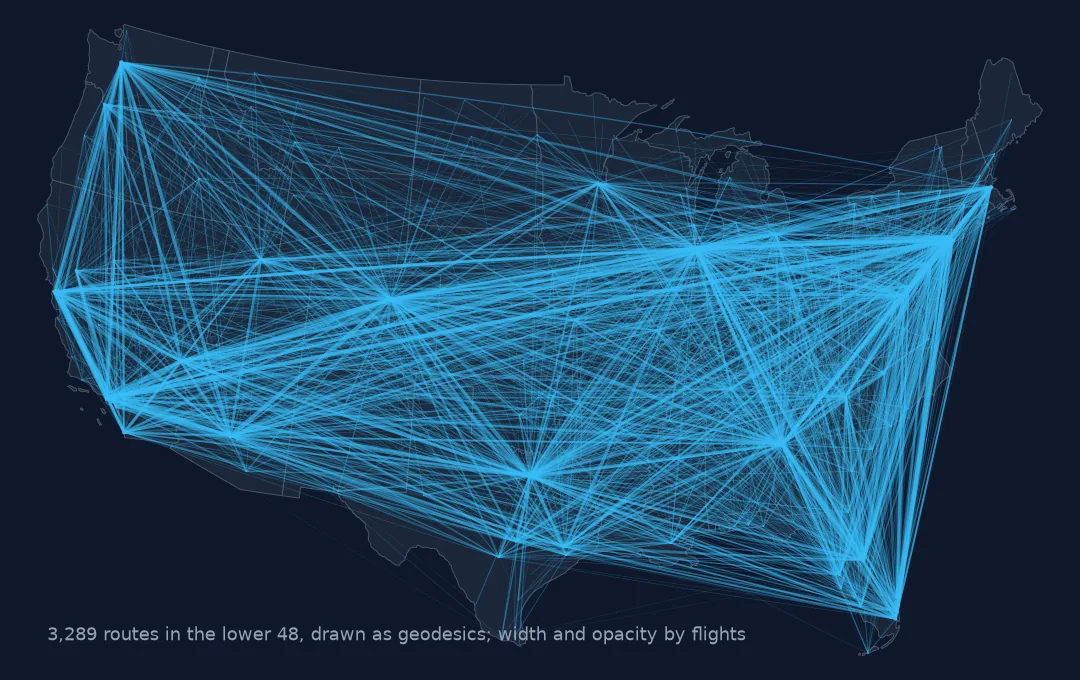
352 airports and 3,480 routes form a single connected network. Denver, Dallas–Fort Worth and Chicago O'Hare each fly nonstop to 180–186 others; Atlanta, with nearly as many flights, serves 151.
The network and how to measure it
1. Count routes, not flights
print(routes.head(5).to_string(index=False))
print(f"routes flown fewer than 52 times in the year: {(routes.flights < 52).sum()} of {len(routes)}")
directed = flown.groupby(["Origin", "Dest"]).size()
one_way = sum(1 for (o, d) in directed.index if (d, o) not in directed.index)
print(f"directed pairs: {len(directed):,}; flown in one direction only: {one_way}")
a b flights
LGA ORD 22476
LAX SFO 21593
HNL OGG 21206
JFK LAX 20340
DEN PHX 17942
routes flown fewer than 52 times in the year: 315 of 3480
directed pairs: 6,933; flown in one direction only: 27
The busiest routes are short and frequent: LaGuardia–O'Hare (22,476 flights in the year), Los Angeles–San Francisco and Honolulu–Kahului, each around sixty a day. At the other end, 315 routes were flown fewer than 52 times — less than weekly, mostly seasonal leisure routes. Directed pairs almost always come in matched pairs; only 27 of 6,933 were flown in one direction only.
2. Which airports hold the network together
bc = pd.Series(nx.betweenness_centrality(G)).sort_values(ascending=False)
strength = pd.Series(dict(G.degree(weight="flights")))
print(pd.DataFrame({"destinations": deg, "flights": strength, "betweenness": bc}).loc[bc.index[:6]].round(3).to_string())
destinations flights betweenness
DEN 186 630209 0.189
DFW 185 614062 0.171
ORD 180 642358 0.146
MSP 124 224020 0.066
ANC 34 37263 0.063
ATL 151 619584 0.057
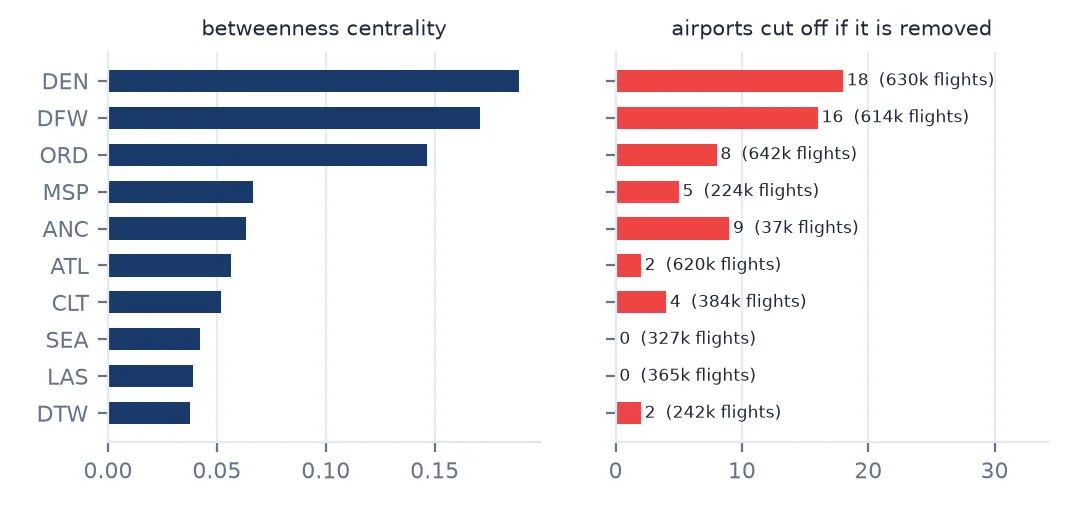
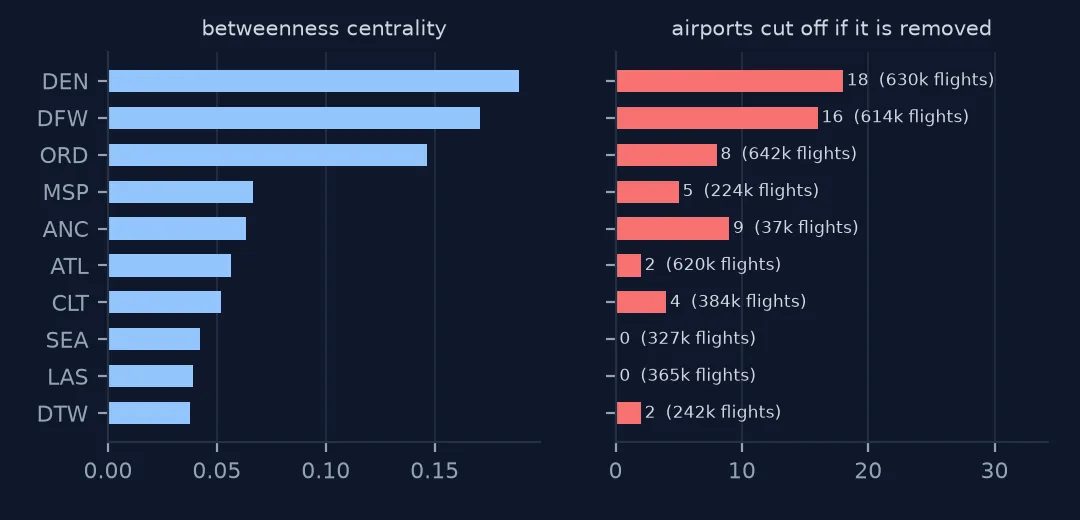
Betweenness — the share of shortest paths between all airport pairs that pass through an airport — ranks the network's connectors rather than its busiest airports. Denver, DFW and O'Hare lead because they link the small airports of the plains and mountains to everything else. Anchorage, with only 34 destinations, ranks above Atlanta: it is the only link between most of Alaska and the lower 48. Atlanta has 619,584 flights but most of its destinations are reachable through other hubs too.
3. How many hops between any two airports
hops = pd.Series([d for _, row in nx.all_pairs_shortest_path_length(G) for d in row.values() if d > 0])
print((hops.value_counts(normalize=True).sort_index() * 100).round(1).to_string())
print(f"diameter: {hops.max()} flights")
1 5.6
2 59.2
3 32.7
4 2.4
5 0.1
diameter: 5 flights
Only 5.6% of airport pairs have a nonstop flight; 59.2% need one connection and 32.7% two. The longest shortest path is five flights — a trip between remote airports at opposite ends of the network, each served by a single route.
4. Great circles, not straight lines
An aircraft follows the shortest path on the ellipsoid, the geodesic. pyproj.Geod.npts returns points along it:
from pyproj import Geod

geod = Geod(ellps="WGS84")
a, b = airports.loc["BOS"], airports.loc["SEA"]
pts = np.array(geod.npts(a.lon, a.lat, b.lon, b.lat, 50))
straight_lat = np.interp(pts[:, 0], [a.lon, b.lon], [a.lat, b.lat])
print(f"BOS-SEA: the great circle reaches {pts[:, 1].max():.1f}°N; a straight line on a lon/lat map stays below {max(a.lat, b.lat):.1f}°N, "
      f"up to {np.max(pts[:, 1] - straight_lat):.1f}° of latitude south of it")
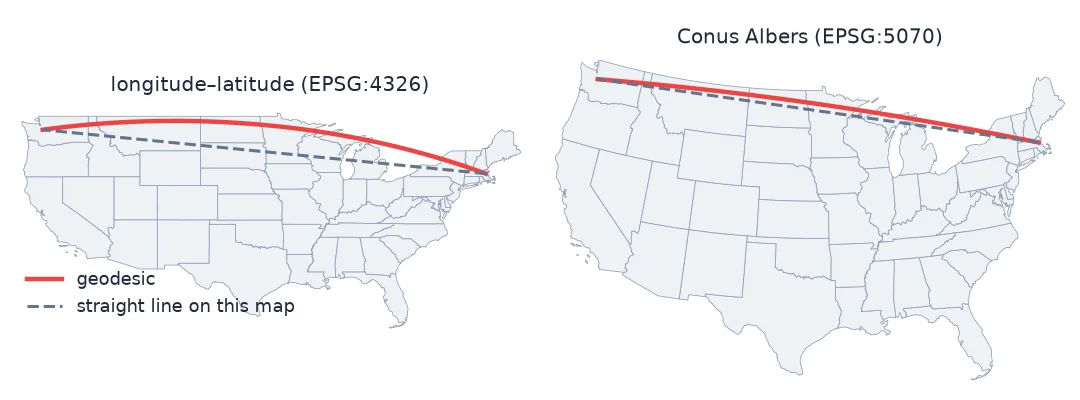
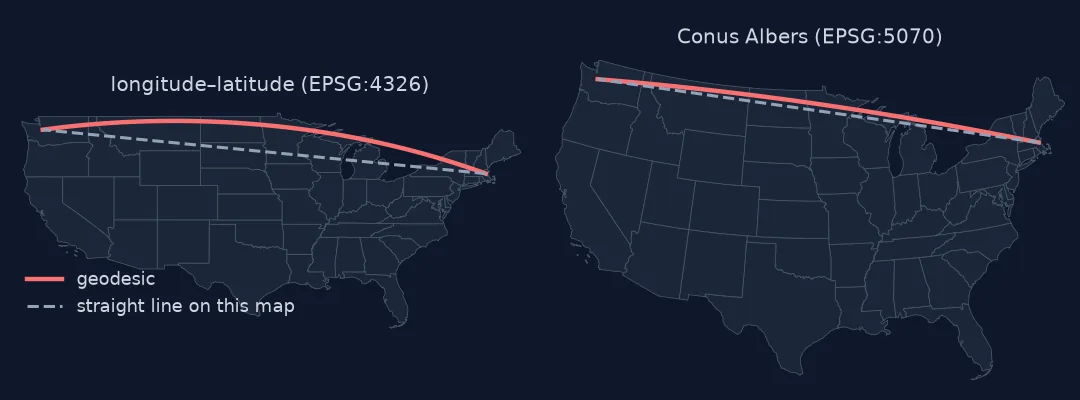
BOS-SEA: the great circle reaches 48.5°N; a straight line on a lon/lat map stays below 47.4°N, up to 1.0° of latitude south of it
Between Boston and Seattle the geodesic bends north to 48.5°N, close to the Canadian border, while a straight line drawn on a longitude–latitude map runs up to a full degree of latitude south of it. Route maps should draw densified geodesics, then project them.
5. Check the file's distances against the geodesic
r = routes.join(airports.add_suffix("_a"), on="a").join(airports.add_suffix("_b"), on="b")
r["geodesic_mi"] = geod.inv(r.lon_a.values, r.lat_a.values, r.lon_b.values, r.lat_b.values)[2] / 1609.344
listed = flown.assign(a=pair.a.values, b=pair.b.values).groupby(["a", "b"]).Distance.first()
r = r.join(listed, on=["a", "b"])
diff = r.Distance - r.geodesic_mi
print(f"file distance minus geodesic, miles: median {diff.median():.1f}, 99% within {diff.abs().quantile(0.99):.1f}, max {diff.abs().max():.1f}")
file distance minus geodesic, miles: median -0.0, 99% within 0.8, max 1.3
The file's Distance column agrees with the WGS84 geodesic between the OurAirports coordinates to within 0.8 miles for 99% of routes, and 1.3 at most: it is the great-circle distance, not the distance flown, which is longer by whatever routing and holding the flight needed.
Hubs and fragility
The data used on this page
The Bureau of Transportation Statistics Reporting Carrier On-Time Performance files for 2025, and airport coordinates from OurAirports in a copy saved on 15 October 2026.
from pathlib import Path
import zipfile

import numpy as np
import pandas as pd
import requests

Path("data").mkdir(exist_ok=True)
BTS = "https://transtats.bts.gov/PREZIP/On_Time_Reporting_Carrier_On_Time_Performance_1987_present_2025_{}.zip"
COLS = ["FlightDate", "Reporting_Airline", "Tail_Number", "Flight_Number_Reporting_Airline", "Origin", "Dest",
        "CRSDepTime", "DepTime", "DepDelay", "TaxiOut", "WheelsOff", "WheelsOn", "TaxiIn", "CRSArrTime", "ArrTime",
        "ArrDelay", "Cancelled", "CancellationCode", "Diverted", "CRSElapsedTime", "ActualElapsedTime", "AirTime",
        "Distance", "CarrierDelay", "WeatherDelay", "NASDelay", "SecurityDelay", "LateAircraftDelay"]
TEXT = {c: str for c in ["CRSDepTime", "DepTime", "WheelsOff", "WheelsOn", "CRSArrTime", "ArrTime", "CancellationCode",
                         "Tail_Number"]}


def read_month(m):
    f = Path(f"data/On_Time_Reporting_Carrier_On_Time_Performance_1987_present_2025_{m}.zip")
    if not f.exists():
        f.write_bytes(requests.get(BTS.format(m), timeout=900).content)
    with zipfile.ZipFile(f) as z:
        name = next(n for n in z.namelist() if n.endswith(".csv"))
        return pd.read_csv(z.open(name), usecols=COLS, dtype=TEXT, parse_dates=["FlightDate"], low_memory=False)


flights = pd.concat([read_month(m) for m in range(1, 13)], ignore_index=True)

# OurAirports is edited daily; this is the copy of 15 October 2026
# (live: https://davidmegginson.github.io/ourairports-data/airports.csv).
AIRPORTS = "ourairports-airports-2026-10-15.csv"
if not Path(f"data/{AIRPORTS}").exists():
    Path(f"data/{AIRPORTS}").write_bytes(requests.get(f"https://data.spatialworkflow.io/{AIRPORTS}", timeout=300).content)
ap = pd.read_csv(f"data/{AIRPORTS}", usecols=["ident", "iata_code", "name", "latitude_deg", "longitude_deg"])
by_iata = ap.dropna(subset=["iata_code"]).drop_duplicates("iata_code").set_index("iata_code")
by_ident = ap.set_index("ident")
codes = pd.Index(sorted(set(flights.Origin) | set(flights.Dest)))
KEEP = ["name", "latitude_deg", "longitude_deg"]
airports = by_iata.reindex(codes)[KEEP]
gap = airports.latitude_deg.isna().values
airports.loc[gap, KEEP] = by_ident.reindex("K" + codes[gap])[KEEP].values      # fall back to the US ident, K + code
airports = airports.rename(columns={"latitude_deg": "lat", "longitude_deg": "lon"})
print(f"{len(flights):,} flights, {len(codes)} airports, {airports.lat.isna().sum()} without coordinates")
7,001,619 flights, 352 airports, 0 without coordinates
Example 1: each airline's hubs
share = {}
for airline, g in flown.groupby("Reporting_Airline"):
    touch = pd.concat([g.Origin, g.Dest]).value_counts() / len(g)
    share[airline] = (touch.index[0], touch.iloc[0], touch.index[1], touch.iloc[1])
hubs = pd.DataFrame(share, index=["hub", "share", "second", "share 2"]).T.sort_values("share", ascending=False)
print(hubs.to_string(formatters={"share": "{:.0%}".format, "share 2": "{:.0%}".format}))
hub share second share 2
HA HNL 81% OGG 33%
AS SEA 62% PDX 17%
DL ATL 46% MSP 13%
MQ DFW 44% ORD 31%
OH CLT 40% DCA 33%
B6 BOS 34% JFK 31%
AA DFW 33% CLT 24%
YX LGA 31% BOS 18%
UA DEN 27% ORD 24%
NK FLL 23% MCO 19%
F9 DEN 23% MCO 18%
OO DEN 18% ORD 16%
G4 SFB 16% PIE 14%
WN DEN 13% LAS 13%
Network carriers concentrate on a few airports: 46% of Delta's flights touch Atlanta, 44% of Envoy's touch DFW, and Hawaiian's 81% touch Honolulu. Southwest is the exception, with no airport in more than 13% of its flights — the point-to-point pattern that makes its network the hardest to summarise as hubs.
Example 2: remove a hub and see what breaks
for hub in ["DEN", "ATL", "ORD", "DFW"]:
    H = G.copy(); H.remove_node(hub)
    parts = sorted(nx.connected_components(H), key=len)
    stranded = [n for c in parts[:-1] for n in c]
    print(f"without {hub}: {len(stranded)} airports cut off {sorted(stranded)[:6]}")
without DEN: 18 airports cut off ['BFF', 'COD', 'CPR', 'CYS', 'DDC', 'DVL']
without ATL: 2 airports cut off ['ABY', 'DHN']
without ORD: 8 airports cut off ['ALO', 'CMX', 'CWA', 'DEC', 'EAU', 'FOD']
without DFW: 16 airports cut off ['ABI', 'BPT', 'BRO', 'FSM', 'GCK', 'GGG']
Removing a hub from the graph shows which airports depend on it alone. Without Denver, 18 airports — Cody, Casper, Cheyenne, Dodge City among them — lose every connection; without DFW, 16. Atlanta, the busiest airport, strands only 2, because the airports it serves have other options. Volume and fragility are different things, and betweenness, not flight count, is the better predictor of the second.
Two kinds of geometry
The network has a topology and a geography, and this page uses each for what it does well. Topology — who connects to whom — ignores distance entirely: betweenness and hop counts treat a short hop and a coast-to-coast flight as the same edge. That is right for "how many connections does a trip need" and wrong for "how far does it go"; weighting edges by distance or time answers the second.
Geography is where the drawing goes wrong. A route between two points is a geodesic, and on a plane map in longitude and latitude the geodesic is a curve, bending towards the pole for any long east–west route. Drawing it means densifying the line along the geodesic first and projecting the points second. The same applies to any long line on a map — a migration flow, a shipping lane, a cable — but air routes are where the error is largest and most visible.
Pitfalls with route networks
- Directed or undirected. Merge A–B and B–A for a route map; keep them apart for flows.
- Weight by flights, seats or distance depending on the question; the file has flights only.
- Small routes matter for connectivity. A route flown weekly can be an airport's only link.
- Draw geodesics, then project. Straight lines on a longitude–latitude map are not routes.
Distanceis great-circle distance, not the path flown.
Internal links
- How to load and clean a year of US flight data — where the flights come from
- How to see the jet stream in flight times — the same routes, flown in each direction
- Street networks as graphs explained — the same graph ideas on a street network
- How to calculate haversine distance in Python — sphere against ellipsoid
FAQ
How many airline routes are there in the US?
The 2025 BTS on-time file has 3,480 airport pairs with at least one flight, between 352 airports, from the large reporting carriers.
Which US airport is the most important connector?
By betweenness centrality, Denver (0.189), then Dallas–Fort Worth and Chicago O'Hare. Removing Denver cuts 18 airports off the network.