
Forest Loss Trend Not Comparable Over Time
On this page
Problem statement
The chart shows forest loss rising steeply after 2013, and the report says deforestation accelerated. Or it compares 2023 with 2005 and concludes loss has tripled. Or two analyses of the same region and year, a year apart, disagree. All three can come from treating an annual loss series as if every year had been measured the same way. Global Forest Change has been extended and reprocessed release by release, with improved inputs and algorithms; the providers themselves advise caution when comparing early and late parts of the record.
A trend in the data is a trend in the forest plus a trend in the measurement. Separating them means comparing like with like and checking against independent sources.
Quick answer
Fix the version, compare periods measured the same way, and cross-check with an independent series:
import numpy as np, rasterio
from rasterio.windows import from_bounds

W, S, E, N = -63.0, -10.8, -62.5, -10.3
PX_HA = 0.00025 * 111_320 * np.cos(np.radians(-10.55)) * 0.00025 * 110_574 / 1e4   # ~0.076 ha
def loss_series(v):
    with rasterio.open(f"/vsicurl/https://storage.googleapis.com/earthenginepartners-hansen/"
                       f"{v}/Hansen_{v}_lossyear_10S_070W.tif") as src:
        ly = src.read(1, window=from_bounds(W, S, E, N, src.transform))
    with rasterio.open(f"/vsicurl/https://storage.googleapis.com/earthenginepartners-hansen/"
                       f"{v}/Hansen_{v}_treecover2000_10S_070W.tif") as src:
        tc = src.read(1, window=from_bounds(W, S, E, N, src.transform))
    f = tc > 30
    last = int(v.split("-")[1]) - 2000
    return {2000 + y: (f & (ly == y)).sum() * PX_HA for y in range(1, last + 1)}

v12 = loss_series("GFC-2024-v1.12")
v11 = loss_series("GFC-2023-v1.11")
print(f"{'year':<6}{'v1.11':>9}{'v1.12':>9}")
for y in (2002, 2006, 2010, 2014, 2018, 2021, 2022, 2023, 2024):
    print(f"{y:<6}{v11.get(y, float('nan')):>9,.0f}{v12[y]:>9,.0f}")
year v1.11 v1.12
2002 9,667 9,667
2006 7,110 7,110
2010 530 530
2014 1,047 1,047
2018 1,649 1,649
2021 1,741 1,741
2022 3,991 3,991
2023 1,240 1,240
2024 nan 1,645
Here the two releases agree exactly for every year they share. Where two releases give the same numbers for a year, that year was not reprocessed; where they differ, the older figure has been superseded. A trend assembled from figures quoted in different reports mixes releases.
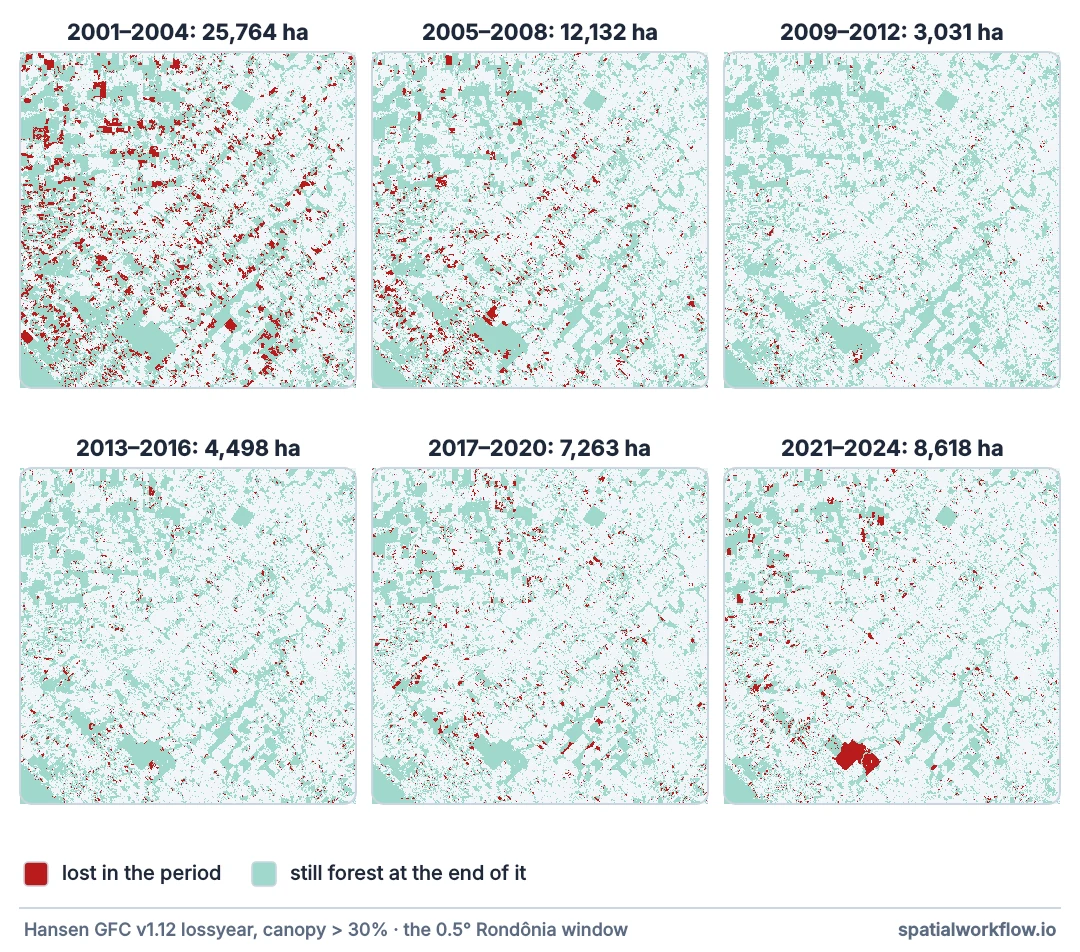
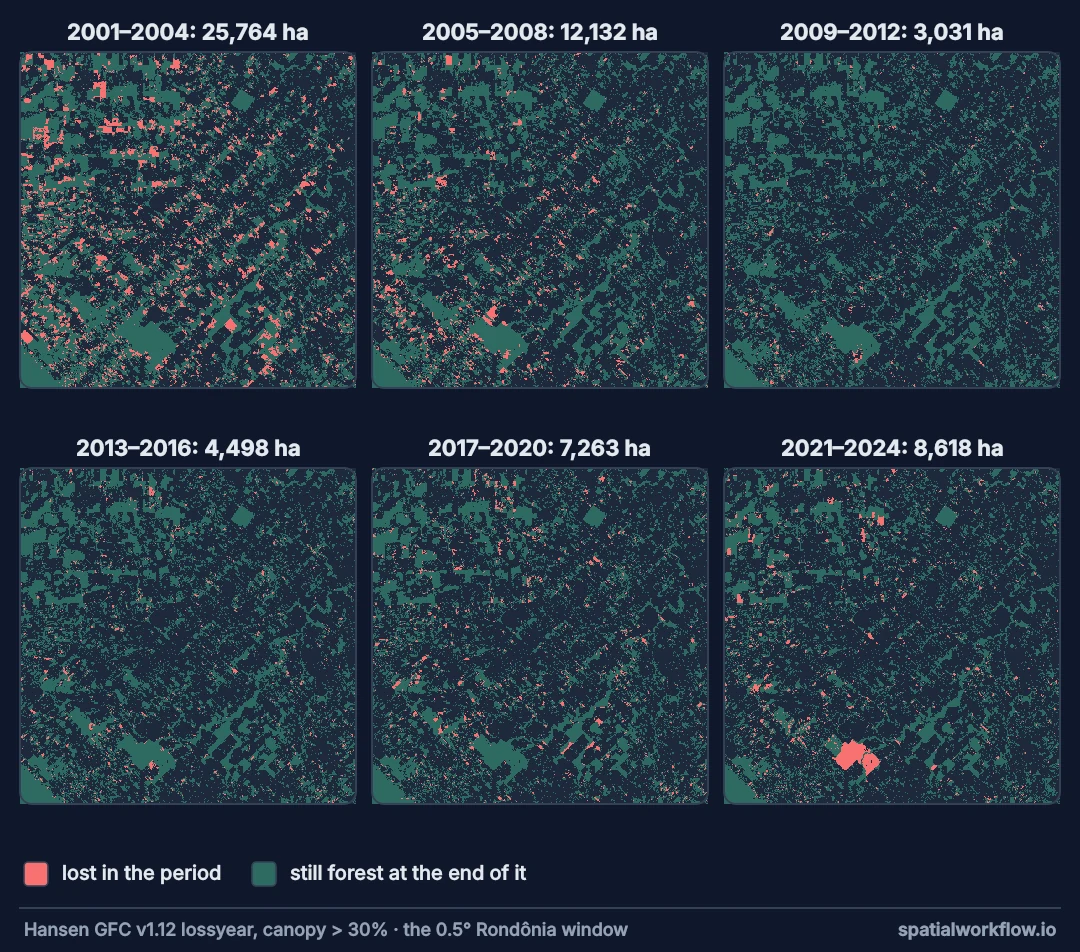
One release, release notes, consistent periods
1. Use one release for the whole series
Take every year from the same version. Do not append this year's figure from the new release to last year's series from the old one.
2. Read the release notes
Each GFC release documents what was reprocessed and which methodological changes apply to which years. Those boundaries are where a trend needs caution.
3. Compare within consistent periods
Compare averages of several years within a period measured the same way — for example two five-year periods after a method change — rather than single years across it.
4. Cross-check with an independent series
National monitoring systems (Brazil's PRODES for the Amazon), sample-based estimates, or a different product. Agreement in direction is reassuring; disagreement flags measurement change.
5. Report the version and the caveat
"Loss fell from X to Y (GFC-2024-v1.12; the providers caution against comparing years processed with different methods)" is honest. "Loss tripled" is not, if part of the tripling is the method.
Multi-year means and release differences
Example 1 — multi-year means instead of single years
def period_mean(s, a, b):
    return np.mean([s[y] for y in range(a, b + 1)])
for (a, b) in ((2001, 2005), (2006, 2010), (2011, 2015), (2016, 2020), (2021, 2024)):
    print(f"{a}–{b}: mean {period_mean(v12, a, b):7,.0f} ha/yr")
2001–2005: mean 5,665 ha/yr
2006–2010: mean 2,130 ha/yr
2011–2015: mean 894 ha/yr
2016–2020: mean 1,849 ha/yr
2021–2024: mean 2,154 ha/yr
Five-year means smooth the year-to-year noise and make changes of level visible: loss fell more than sixfold from 2001–05 to 2011–15, then more than doubled. They do not remove method changes, but they make them easier to spot as steps.
Example 2 — where the releases differ
diff = {y: v12[y] - v11[y] for y in v11}
changed = {y: d for y, d in diff.items() if abs(d) > 0.01 * max(v11[y], 1)}
print(f"years with >1% difference between releases: {sorted(changed) or 'none'}")
print(f"total 2001–2023: v1.11 {sum(v11.values()):,.0f} ha, "
      f"v1.12 {sum(v12[y] for y in v11):,.0f} ha")
years with >1% difference between releases: none
total 2001–2023: v1.11 59,660 ha, v1.12 59,660 ha
This is the check to run before combining figures from different reports: which years did the newer release change, and by how much?
Example 3 — the shape of the series against its own noise
vals = np.array([v12[y] for y in range(2001, 2025)])
diffs = np.diff(vals)
print(f"year-to-year change: median |Δ| {np.median(np.abs(diffs)):,.0f} ha, "
      f"largest {np.abs(diffs).max():,.0f} ha ({2002 + int(np.abs(diffs).argmax())})")
print(f"ratio of 2016–24 mean to 2001–09 mean: "
      f"{vals[15:].mean() / vals[:9].mean():.2f}")
year-to-year change: median |Δ| 854 ha, largest 6,049 ha (2007)
ratio of 2016–24 mean to 2001–09 mean: 0.46
In a small window, single-year swings are large relative to the mean. Statements about trends need several years on each side and the version caveat attached.
Why the method changed
Why the method changed
Global Forest Change was first published for 2000–2012 and then extended year by year. Later years benefit from better Landsat data (Landsat 8 from 2013), improved cloud masking and refined algorithms; some releases reprocessed parts of the record. The result is a better dataset overall and a less homogeneous time series.
Why single years are noisy
Annual loss depends on the weather (fire years), prices, policy and enforcement, and on how many clear observations the sensor got that year. In a small area, one large clearing or one cloudy year moves the annual figure substantially.
Why independent series help
National systems such as PRODES map clear-cut deforestation of primary forest with a consistent method and visual interpretation. They measure a narrower thing, but their consistency makes them a good check on the direction of trends in the global product.
Fire years, recent years and primary forest
- Fire years (2016, 2019–2020 in parts of the Amazon) raise loss through burning, not only clearing.
- Recent years are the most likely to be revised in the next release.
- Primary forest loss subsets are affected by the same method changes.
- Area vs rate: a declining absolute loss can hide a rising rate on the remaining forest.
- Regional differences: method changes affect regions differently, depending on cloudiness and forest type.
Internal links
- Global Forest Change explained — versions and methods
- How to calculate forest loss by year for a region — building the series
- Deforestation rates explained — rates across periods
- Forest loss and gain misread — the other GFC pitfalls
- How to detect new forest clearing with Sentinel-2 — an independent check
- How to analyse an air quality time series — trends that are steps, in another domain
FAQ
Can I compare Hansen forest loss between 2005 and 2023?
With caution: methods improved over the record. Compare multi-year periods and cite the version.
Why do numbers for the same year differ between reports?
They used different releases; later releases reprocess recent years.
Should I mix figures from different GFC versions?
No. Take the whole series from one release.
How do I check whether a trend is real?
Compare with an independent series such as a national monitoring system, and look for steps at known method changes.
Why are annual figures so variable?
Weather, fire, policy and data availability all vary year to year; small areas amplify the noise.
Which version should I use?
The latest, consistently, with the version named in every figure.