
Forest Threshold Changes Everything
On this page
Problem statement
Your forest area for a region is half the figure in a published report, or twice it. Your deforestation rate for a savanna landscape is ten times someone else's. You and the other source used the same Hansen data. The difference is one number: the tree-cover threshold that turns a canopy percentage into a forest/non-forest map. In closed tropical forest it barely matters. In savanna, woodland, plantations and mosaics of regrowth it decides the answer.
Quick answer
Compute forest area and loss across a range of thresholds and look at the curve before choosing:
import numpy as np, rasterio
from rasterio.windows import from_bounds

def curves(tile, bounds, v="GFC-2024-v1.12"):
    arrs = {}
    for layer in ("treecover2000", "lossyear"):
        with rasterio.open(f"/vsicurl/https://storage.googleapis.com/earthenginepartners-hansen/"
                           f"{v}/Hansen_{v}_{layer}_{tile}.tif") as src:
            arrs[layer] = src.read(1, window=from_bounds(*bounds, src.transform))
    tc, ly = arrs["treecover2000"], arrs["lossyear"]
    rows = []
    for t in (10, 20, 30, 40, 50, 75):
        f = tc > t
        rows.append((t, f.mean(), (f & (ly > 0)).sum() / max(f.sum(), 1)))
    return rows

places = {"Rondônia (Amazon)": ("10S_070W", (-63.0, -10.6, -62.9, -10.5)),
          "Cerrado near Brasília": ("10S_050W", (-47.9, -15.9, -47.8, -15.8)),
          "Mato Grosso transition": ("10S_060W", (-55.6, -12.6, -55.5, -12.5))}
for name, (tile, b) in places.items():
    print(name)
    for t, share, lost in curves(tile, b):
        print(f"   > {t:>2}% canopy: forest {share:5.1%} of land, {lost:5.1%} of it lost 2001–24")
Rondônia (Amazon)
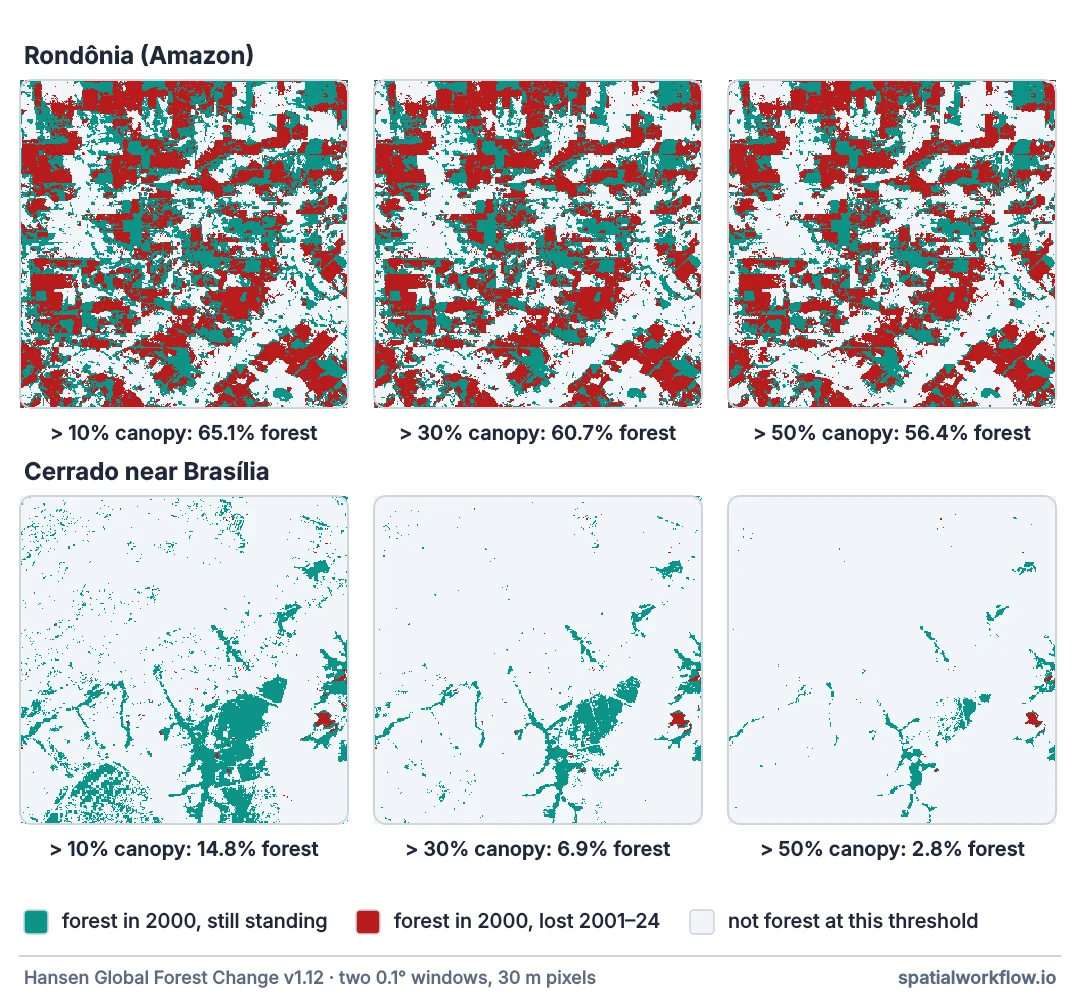
> 10% canopy: forest 65.1% of land, 52.4% of it lost 2001–24
> 20% canopy: forest 62.5% of land, 54.2% of it lost 2001–24
> 30% canopy: forest 60.7% of land, 55.6% of it lost 2001–24
> 40% canopy: forest 59.2% of land, 56.8% of it lost 2001–24
> 50% canopy: forest 56.4% of land, 58.9% of it lost 2001–24
> 75% canopy: forest 47.5% of land, 64.8% of it lost 2001–24
Cerrado near Brasília
> 10% canopy: forest 14.8% of land, 2.8% of it lost 2001–24
> 20% canopy: forest 9.4% of land, 3.7% of it lost 2001–24
> 30% canopy: forest 6.9% of land, 4.6% of it lost 2001–24
> 40% canopy: forest 5.4% of land, 5.1% of it lost 2001–24
> 50% canopy: forest 2.8% of land, 6.9% of it lost 2001–24
> 75% canopy: forest 0.7% of land, 4.5% of it lost 2001–24
Mato Grosso transition
> 10% canopy: forest 53.9% of land, 28.0% of it lost 2001–24
> 20% canopy: forest 53.6% of land, 28.0% of it lost 2001–24
> 30% canopy: forest 53.3% of land, 28.0% of it lost 2001–24
> 40% canopy: forest 53.0% of land, 28.0% of it lost 2001–24
> 50% canopy: forest 52.2% of land, 27.9% of it lost 2001–24
> 75% canopy: forest 47.6% of land, 27.7% of it lost 2001–24
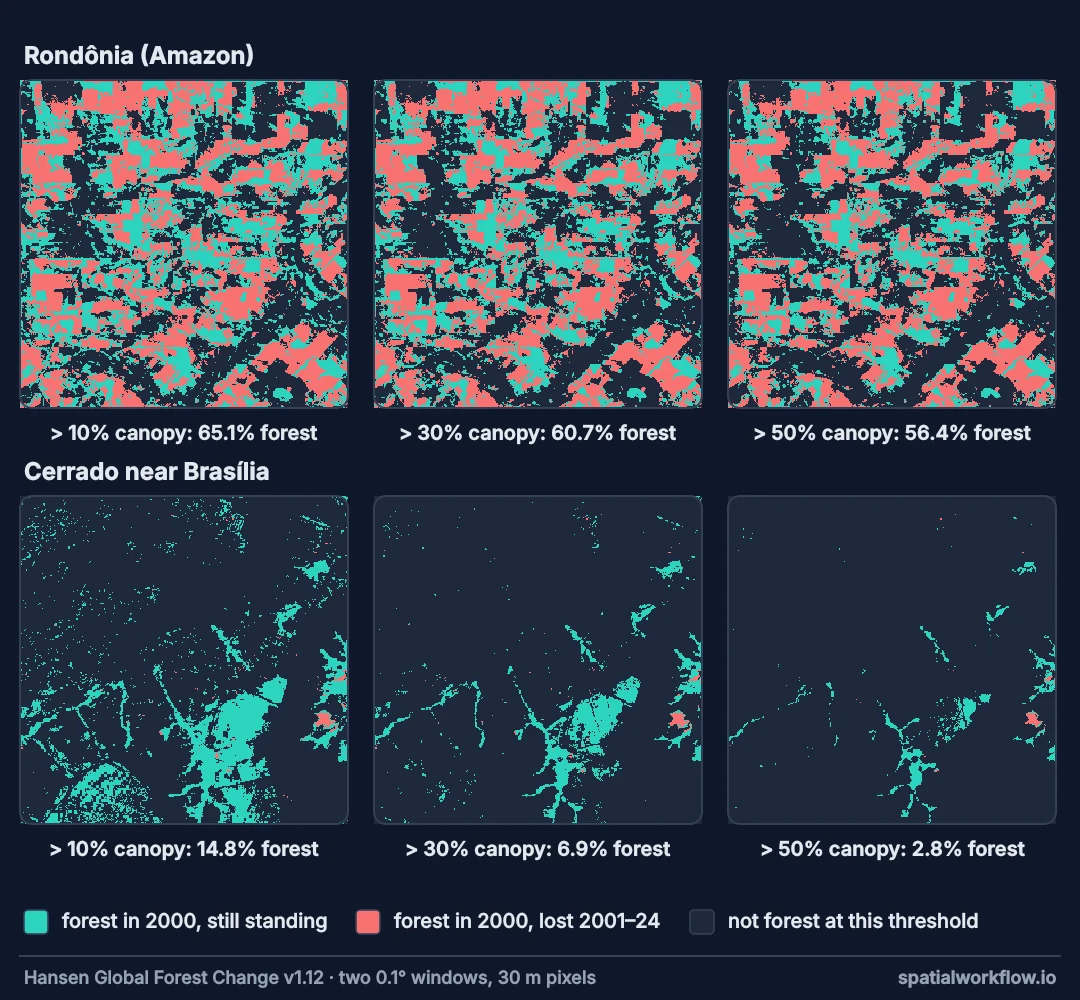
In the Amazon window the forest share falls by nine points between 10% and 50%, from 65% to 56% of the land. In the Cerrado it falls fivefold, from 15% to 3%: most "forest" at 10% is open woodland that a 30% threshold does not count at all. In the Mato Grosso transition window it hardly moves.
Find each source's threshold, then plot area against it
1. Find the threshold each source used
Reports rarely hide it but often bury it: Global Forest Watch's default dashboards use 30%; FAO's definition corresponds to 10%; many national systems use their own.
2. Plot area and loss against the threshold
A flat curve means the landscape is either dense forest or clearly not; the threshold is harmless. A steep curve means intermediate cover is common and the threshold is a decision, not a detail.
3. Choose from the definition, not from the result
Pick the threshold that matches the definition the question is framed in — legal, FAO, national — and keep it for every comparison.
4. Report the sensitivity
Give the result at the chosen threshold and at one or two others. Readers can then see how much of the conclusion depends on the definition.
5. Consider a different product for open ecosystems
For savannas, tree cover percentages and woodland classes from ecosystem-specific maps may describe the landscape better than a forest/non-forest cut.
The distribution behind the curve
Example 1 — the distribution behind the curve
for name, (tile, b) in places.items():
    with rasterio.open(f"/vsicurl/https://storage.googleapis.com/earthenginepartners-hansen/"
                       f"GFC-2024-v1.12/Hansen_GFC-2024-v1.12_treecover2000_{tile}.tif") as src:
        tc = src.read(1, window=from_bounds(*b, src.transform))
    hist = np.histogram(tc, bins=[0, 10, 30, 50, 75, 101])[0] / tc.size
    print(f"{name:<24} " + " ".join(f"{lab}:{h:4.0%}" for lab, h in
                                     zip(("0–10", "10–30", "30–50", "50–75", "75+"), hist)))
Rondônia (Amazon) 0–10: 35% 10–30: 4% 30–50: 4% 50–75: 9% 75+: 48%
Cerrado near Brasília 0–10: 85% 10–30: 8% 30–50: 4% 50–75: 2% 75+: 1%
Mato Grosso transition 0–10: 46% 10–30: 1% 30–50: 1% 50–75: 5% 75+: 48%
The threshold matters in proportion to how much land sits in the 10–50% range. Closed forest puts almost everything above 75%; savanna puts most of it between 10 and 50.
Example 2 — the rate moves too
tile, b = places["Mato Grosso transition"]
for t in (10, 30, 50):
    rows = dict((r[0], r[2]) for r in curves(tile, b))
    print(f"threshold {t}%: {rows[t]:.1%} of the 2000 forest lost by 2024")
threshold 10%: 28.0% of the 2000 forest lost by 2024
threshold 30%: 28.0% of the 2000 forest lost by 2024
threshold 50%: 27.9% of the 2000 forest lost by 2024
In the transition window the relative loss barely moves, because almost no land sits between 10% and 50% canopy. Elsewhere it does: in Rondônia the share of the baseline lost rises from 52% at a 10% threshold to 59% at 50%, and in the Cerrado it more than doubles over the same range. A relative loss rate changes with the threshold because different kinds of land enter the baseline and are cleared at different rates.
Example 3 — record the definition with the result
result = {"forest_ha": None, "definition": {"product": "Hansen GFC-2024-v1.12",
          "canopy_threshold_pct": 30, "minimum_area_ha": 0, "baseline_year": 2000}}
print(result["definition"])
{'product': 'Hansen GFC-2024-v1.12', 'canopy_threshold_pct': 30, 'minimum_area_ha': 0, 'baseline_year': 2000}
Storing the definition next to the number is the cheapest insurance against the most common forest-statistics disagreement.
Why landscapes differ in sensitivity
Why landscapes differ in sensitivity
Tree cover in a closed forest landscape is bimodal: nearly 100% under the canopy, nearly 0% in the clearings. Any threshold between splits them the same way. Savannas and mosaics are unimodal around intermediate values, so the threshold slices through the middle of the distribution.
Why dashboards default to 30%
Thirty percent is a common compromise that captures closed and semi-closed forest while excluding most open woodland. It is a convention, and a defensible one for tropical forest; it is a poor fit for dry forests and savannas, which it largely excludes.
Why comparisons across biomes are fragile
A single threshold treats a 25% canopy in the Cerrado and a 25% canopy of a degraded Amazon forest the same way, although ecologically they are very different. Biome-specific thresholds or continuous analysis of tree cover avoid forcing one cut on all landscapes.
Mapping units, plantations and other products
- Minimum mapping unit interacts with the threshold: low thresholds admit many small patches.
- Loss on non-forest: loss pixels below the threshold are still in the data; decide whether they count.
- Plantations have high canopy and cyclical loss regardless of threshold.
- Tree cover year: the threshold applies to 2000 cover; later forest is 2000 forest minus loss.
- Other products have their own implicit thresholds baked into their classes.
Internal links
- Forest definitions explained — thresholds and minimum areas
- How to compare land cover products for forest — definitions inside classes
- Deforestation rates explained — how baselines move rates
- How to read Hansen Global Forest Change data — the tree cover layer
- Forest area wrong in degrees — the other common area error
- Global Forest Change explained — what the data measure
FAQ
Why is my forest area different from Global Forest Watch?
Probably a different canopy threshold; their default is 30%.
Which threshold should I use?
The one in your forest definition — often 10% for FAO comparability or 30% for closed forest. State it.
Why does the threshold matter more in savannas?
Most savanna land has intermediate tree cover, exactly where thresholds cut.
Does the threshold change deforestation rates?
Yes; it changes both the baseline and which clearings count.
Can I avoid choosing a threshold?
Analyse tree cover as a continuous variable, or report results across several thresholds.
What about minimum area?
Apply it after the threshold; it removes small patches that low thresholds admit.