
Forest Loss and Gain Misread
On this page
Problem statement
The analysis subtracted the gain layer from the loss layer and reported net forest change. Or it counted "forest in 2015" as all pixels with more than 30% cover in 2000 and a loss year after 2015, and got more forest than the region's land. Or it reported a pixel lost in 2005 and regrown by 2012 as forest again in 2024. Each follows from reading the Global Forest Change layers as a complete forest history, which they are not.
Three facts prevent all of these: loss records only the first stand-replacing event per pixel; gain is a single undated flag for 2000–2012; and a lossyear of 0 means "no loss detected", not "no data".
Quick answer
Keep loss and gain separate, derive forest at a date from the 2000 baseline and loss only, and never subtract gain from loss:
import numpy as np, rasterio
from rasterio.windows import from_bounds

V, TILE = "GFC-2024-v1.12", "10S_070W"
W, S, E, N = -63.0, -10.8, -62.5, -10.3
def layer(name):
    with rasterio.open(f"/vsicurl/https://storage.googleapis.com/earthenginepartners-hansen/"
                       f"{V}/Hansen_{V}_{name}_{TILE}.tif") as src:
        return src.read(1, window=from_bounds(W, S, E, N, src.transform))
tc, ly, gain, dm = (layer(n) for n in ("treecover2000", "lossyear", "gain", "datamask"))
px_ha = 0.00025 * 111_320 * np.cos(np.radians(10.55)) * 0.00025 * 110_574 / 1e4   # ~27.4 × 27.6 m

forest2000 = (tc > 30) & (dm == 1)
loss = forest2000 & (ly > 0)
g = gain == 1
print(f"forest 2000: {forest2000.sum() * px_ha:,.0f} ha")
print(f"loss 2001–2024 on it: {loss.sum() * px_ha:,.0f} ha")
print(f"gain 2000–2012 (anywhere): {g.sum() * px_ha:,.0f} ha")
print(f"'net change' = gain − loss: {(g.sum() - loss.sum()) * px_ha:,.0f} ha   <- not a valid quantity")
print(f"gain pixels that also have a loss year: {(g & (ly > 0)).sum() * px_ha:,.0f} ha")
forest 2000: 139,689 ha
loss 2001–2024 on it: 61,306 ha
gain 2000–2012 (anywhere): 2,183 ha
'net change' = gain − loss: -59,122 ha <- not a valid quantity
gain pixels that also have a loss year: 1,281 ha
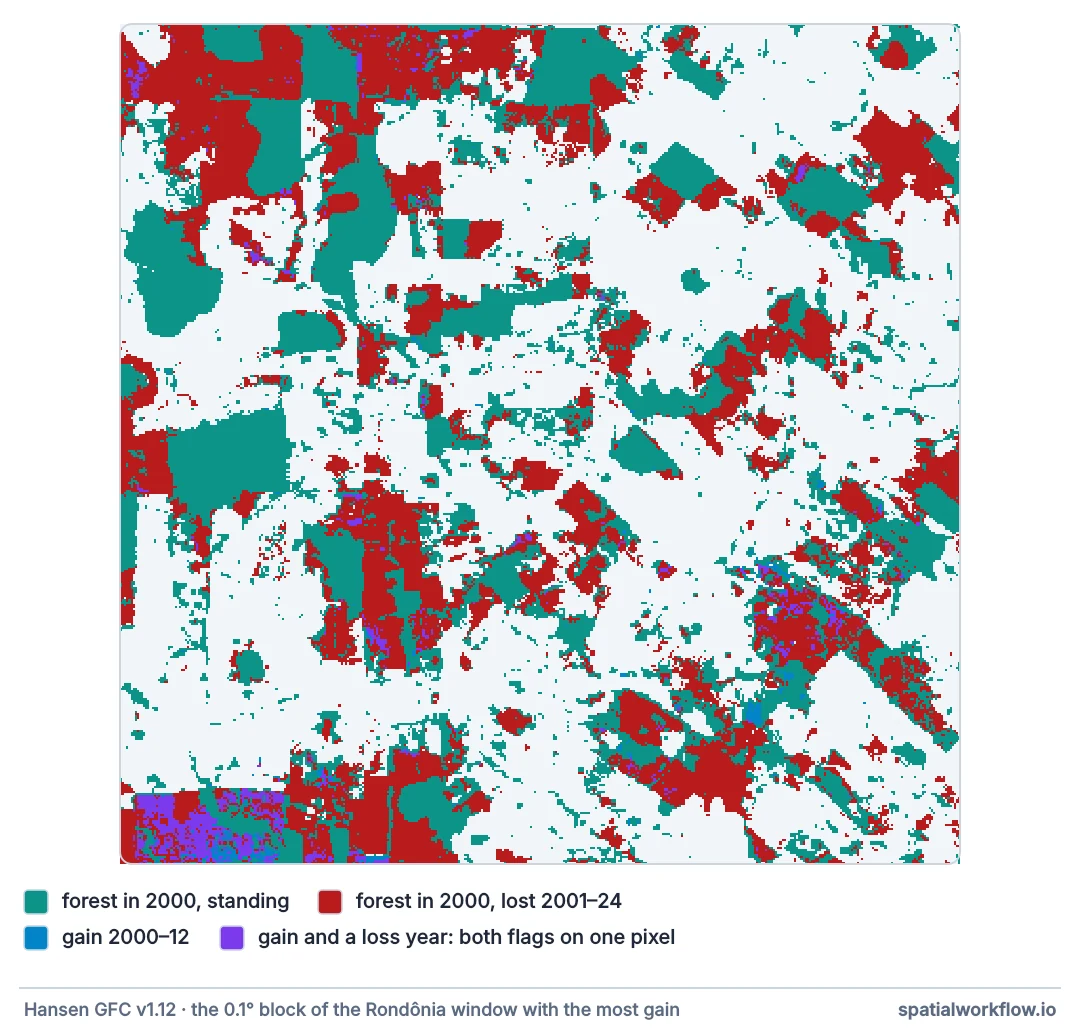
The subtraction mixes a 2000–2012 flag with a 2001–2024 record, measured by different methods over different periods. The result has a unit and no meaning — and more than half of the gain area here, 1,281 of 2,183 ha, is on pixels that also carry a loss year, so the two layers are not even describing separate land.
Forest at a date from the baseline, gain as older
1. Derive forest at a date from the baseline
Forest in year Y is forest in 2000 minus pixels lost in 2001…Y. Nothing in the data adds forest back after 2012.
2. Treat gain as a separate, older signal
Gain marks pixels where tree cover established between 2000 and 2012. It has no year and is not updated. Use it to describe regrowth in that period, not to offset later loss.
3. Remember loss is recorded once
A pixel cleared, regrown and cleared again shows only the first loss. Loss statistics undercount repeated clearing of regrowth.
4. Read 0 as "no loss detected"
Water and no-data are in datamask, not in lossyear. Mask with datamask before counting non-loss as forest.
5. For net change, use a product built for it
Land cover time series or dedicated forest-extent products model gains and losses consistently over time.
Forest at a date, done wrong and right
Example 1 — forest at a date, done wrong and right
def forest_in(year):
    return forest2000 & ((ly == 0) | (ly > year - 2000))
wrong = forest2000 & (ly > 2015 - 2000)                  # forgets the pixels never lost
print(f"forest 2015, correct: {forest_in(2015).sum() * px_ha:,.0f} ha")
print(f"forest 2015, 'loss after 2015' only: {wrong.sum() * px_ha:,.0f} ha")
forest 2015, correct: 96,245 ha
forest 2015, 'loss after 2015' only: 17,862 ha
Pixels with lossyear 0 were never lost and are the bulk of remaining forest; a condition that only looks at later loss years leaves them out.
Example 2 — regrowth the data cannot see
early = forest2000 & (ly >= 1) & (ly <= 5)
print(f"forest cleared 2001–05: {early.sum() * px_ha:,.0f} ha")
print(f"flagged as gain 2000–12: {(early & g).sum() * px_ha:,.0f} ha "
      f"({(early & g).sum() / early.sum():.1%})")
print("regrowth after 2012, and second clearings of it, are not in the data at all")
forest cleared 2001–05: 28,323 ha
flagged as gain 2000–12: 513 ha (1.8%)
regrowth after 2012, and second clearings of it, are not in the data at all
Only a small share of early clearings carries the gain flag; whether the rest stayed pasture or regrew after 2012 cannot be read from these layers. A canopy height map or land cover time series can answer it.
Example 3 — the datamask
print(f"pixels: land {np.mean(dm == 1):.1%}, water {np.mean(dm == 2):.1%}, no data {np.mean(dm == 0):.1%}")
print(f"'not lost' including water: {(ly == 0).mean():.1%}; on land only: {((ly == 0) & (dm == 1)).mean():.1%}")
pixels: land 100.0%, water 0.0%, no data 0.0%
'not lost' including water: 78.6%; on land only: 78.6%
This window happens to contain no mapped water, so the two shares agree to the decimal — which is exactly how the land mask gets forgotten: code tested on a dry window gives the right answer. Water pixels have a loss year of 0 too, and on a window with rivers or reservoirs, counting "never lost" without the land mask adds them to the unchanged forest.
Why gain stops in 2012
Why gain stops in 2012
Detecting new canopy needs years of growth to register in Landsat time series. The original analysis mapped gain for its 12-year window; later releases extended loss annually but did not extend gain in the same way. Regrowth has since been mapped in separate products with different methods.
Why only one loss per pixel
The loss layer stores a single year per pixel — the first detected stand-replacement event. Encoding repeated events would need a different data structure. The consequence is that land in rotation — shifting cultivation, plantations, repeatedly burned regrowth — is undercounted after its first event.
Why net change needs consistent methods
Net change is the difference between two forest extents measured the same way. Loss and gain here are measured differently, over different periods, and gain is incomplete. Their difference is not a forest extent change.
Same-pixel loss and gain, and plantation cycles
- Loss and gain on the same pixel is possible: gain before 2012, loss after.
- Plantation cycles appear as loss once, then nothing, whatever happens later.
- Version updates can change loss years for recent years; they do not add gain.
- Tree cover 2010 exists in some releases as a separate layer with its own caveats.
- Forest extent products from national monitoring systems usually include regrowth rules.
Internal links
- Global Forest Change explained — the layers and their definitions
- How to use global canopy height maps — seeing regrowth
- Deforestation rates explained — gross and net
- How to read Hansen Global Forest Change data — reading the layers
- Forest loss trend not comparable over time — the other time caveat
- Land cover products explained — products with gain and loss
FAQ
Can I compute net forest change from Hansen gain and loss?
No. Gain is an undated 2000–2012 flag; loss is annual from 2001. Their difference is not meaningful.
How do I get forest cover in a given year?
Forest in 2000 above your threshold, minus pixels with a loss year up to that year.
Does lossyear 0 mean forest?
It means no loss was detected. Combine it with the 2000 baseline and the land mask.
Can a pixel be lost twice?
Only the first loss is recorded.
Does the data show regrowth after 2012?
No. Use canopy height or land cover time series.
What does the gain layer mean?
Tree cover gain detected between 2000 and 2012, without a year.