
Satellite NO2 Map Mostly Empty
On this page
Problem statement
The Sentinel-5P NO2 map of the city for last month is mostly blank cells, or a speckle of values with holes between them, or — after "fixing" the quality filter — full but with a smear of implausibly high values along one edge. The day-by-day maps are worse: most days have nothing at all.
This is the normal state of passive satellite retrievals over a cloudy region, compounded by a few avoidable mistakes: a grid finer than the pixels, night-side passes counted as missing days, duplicate processing streams, and a quality threshold lowered to fill the gaps with exactly the retrievals the threshold exists to remove.
Quick answer
Separate the unavoidable gaps (cloud) from the avoidable ones, and aggregate over enough time to fill the rest:
import numpy as np, pandas as pd, xarray as xr, fsspec, pystac_client, planetary_computer

BBOX = (-0.6, 51.25, 0.35, 51.75)
cat = pystac_client.Client.open("https://planetarycomputer.microsoft.com/api/stac/v1")
found = list(cat.search(collections=["sentinel-5p-l2-netcdf"], bbox=list(BBOX),
                        datetime="2023-01-01/2023-12-31").items())
no2 = [i for i in found if i.properties["s5p:product_name"] == "no2"]
modes = pd.Series([i.properties["s5p:processing_mode"] for i in no2]).value_counts().to_dict()
day = [i for i in no2 if i.properties["s5p:processing_mode"] == "NRTI" and 9 <= i.datetime.hour <= 15]
night = [i for i in no2 if i.properties["s5p:processing_mode"] == "NRTI" and not 9 <= i.datetime.hour <= 15]
print(f"all Sentinel-5P items over London in 2023: {len(found):,}")
print(f"NO2 items: {len(no2)} — by processing mode {modes}")
print(f"NRTI daytime granules: {len(day)}; NRTI night-side granules: {len(night)}")
all Sentinel-5P items over London in 2023: 14,577
NO2 items: 1468 — by processing mode {'NRTI': 765, 'OFFL': 703}
NRTI daytime granules: 644; NRTI night-side granules: 121
Before any pixel is read, most of what a naive search returns is the wrong product, a second copy of the same pass, or a night-side pass on which NO2 is never retrieved.
Remove impossible data, measure cloud loss, match the grid
1. Remove what can never have data
Filter to the NO2 product, one processing mode, and daytime overpasses. Night-side granules are not missing data; they are not NO2 observations at all.
2. Measure the cloud loss, month by month
Count the share of pixels passing qa_value ≥ 0.75 per pass and per month. That is the physical ceiling on coverage; the only remedy is a longer averaging window.
3. Match the grid to the pixels
Pixels are about 5.5 × 3.5 km. A 1 km grid binned by pixel centre leaves most cells empty even on a clear day. Use cells at least as large as the pixels, or regrid by area using pixel corners.
4. Aggregate in time before space
A monthly or seasonal mean per cell, with its count, is the standard product. Single days are for case studies of clear, anticyclonic episodes.
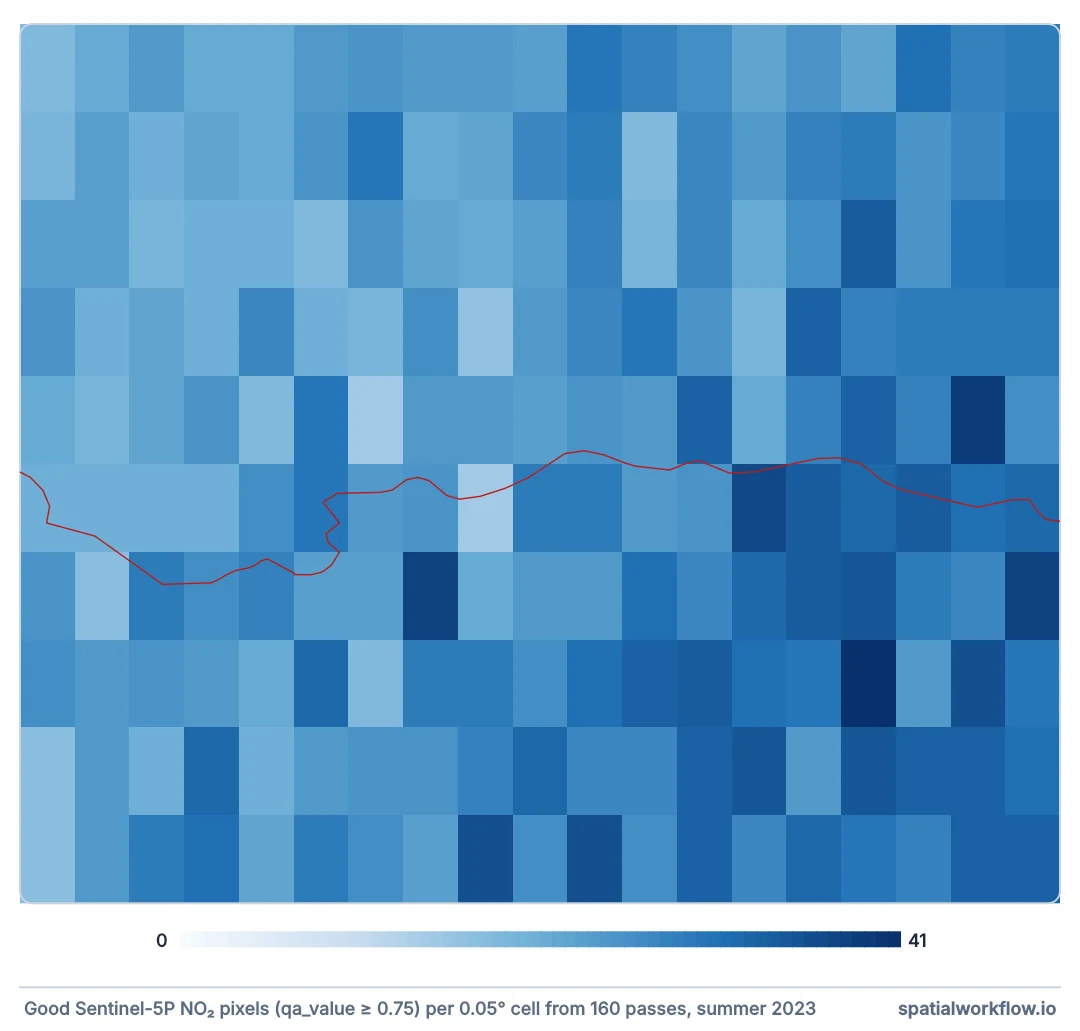
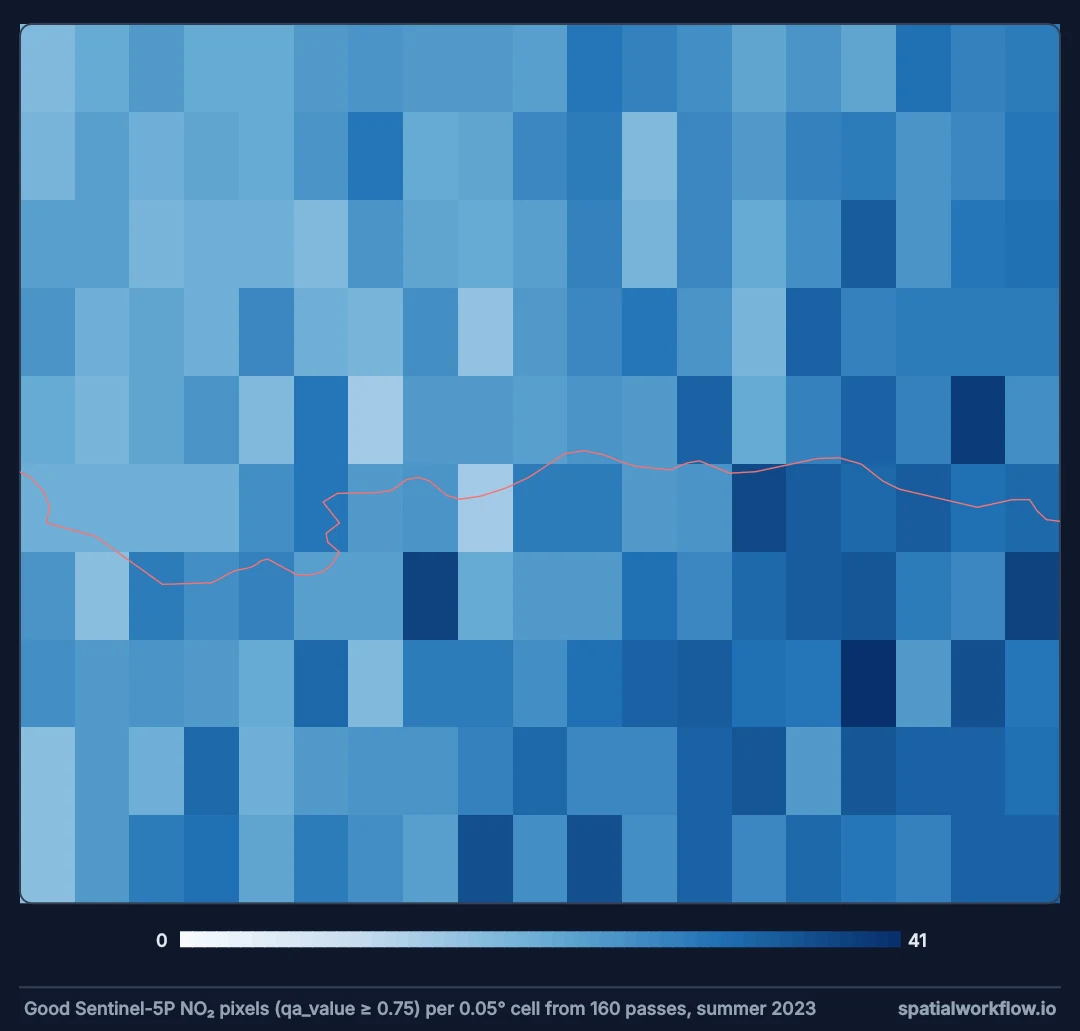
qa_value ≥ 0.75, and the median cell 26. A seasonal map is an average of a few dozen clear mornings, and a single day is mostly empty.5. Do not lower the quality threshold to fill gaps
Pixels between 0.5 and 0.75 are partly cloudy or otherwise compromised. Including them fills the map with values biased by cloud — often high over bright cloud edges.
The monthly cloud ceiling over London
Example 1 — the cloud ceiling, by month
import gc

fs = fsspec.filesystem("http")

def qa_of(item):
    with fs.open(planetary_computer.sign(item.assets["no2"].href), block_size=4 * 2**20, cache_type="blockcache") as f:
        with xr.open_dataset(f, group="PRODUCT", engine="h5netcdf") as ds:
            lat, lon = ds.latitude[0].values, ds.longitude[0].values
            inside = (lat > BBOX[1]) & (lat < BBOX[3]) & (lon > BBOX[0]) & (lon < BBOX[2])
            rows = np.where(inside.any(axis=1))[0]
            if len(rows) == 0:
                return None
            sl = slice(rows.min(), rows.max() + 1)
            return pd.DataFrame({"qa": ds.qa_value[0, sl].values[inside[sl]], "time": item.datetime})

frames = []
for item in day:
    q = qa_of(item)
    if q is not None:
        frames.append(q)
    gc.collect()        # each closed granule sits in a reference cycle: without this, a year of them took 12 GB
px = pd.concat(frames, ignore_index=True)
per_pass = px.groupby("time").qa.apply(lambda q: (q >= 0.75).mean())
print(f"usable share over all pixels: {(px.qa >= 0.75).mean():.0%} "
      f"(at qa ≥ 0.5: {(px.qa >= 0.5).mean():.0%})")
print(f"passes with no usable pixel: {(per_pass == 0).mean():.0%}; "
      f"passes more than half usable: {(per_pass > 0.5).mean():.0%}")
monthly = per_pass.groupby(per_pass.index.month).mean()
print("mean usable share by month:", " ".join(f"{m}:{v:.0%}" for m, v in monthly.items()))
usable share over all pixels: 31% (at qa ≥ 0.5: 75%)
passes with no usable pixel: 41%; passes more than half usable: 27%
mean usable share by month: 1:25% 2:29% 3:11% 4:26% 5:28% 6:52% 7:10% 8:28% 9:34% 10:39% 11:38% 12:20%
More than a third of London's daytime passes have no usable pixel at all, and the monthly share swings with the weather. A July map and a June map of the same city rest on very different numbers of days.
Example 2 — the grid finer than the pixels
print(f"{'cell size':>10}{'cells':>7}{'empty on a typical clear pass':>31}")
clear = per_pass[per_pass > 0.5].index[0]
with fs.open(planetary_computer.sign([i for i in day if i.datetime == clear][0].assets["no2"].href),
             block_size=4 * 2**20, cache_type="blockcache") as f:
    ds = xr.open_dataset(f, group="PRODUCT", engine="h5netcdf")
    lat, lon, qa = ds.latitude[0].values, ds.longitude[0].values, ds.qa_value[0].values
ok = (lat > BBOX[1]) & (lat < BBOX[3]) & (lon > BBOX[0]) & (lon < BBOX[2]) & (qa >= 0.75)
for res in (0.01, 0.025, 0.05, 0.1):
    nx, ny = int(np.ceil(0.95 / res)), int(np.ceil(0.5 / res))
    filled = set(zip(((lat[ok] - BBOX[1]) // res).astype(int), ((lon[ok] - BBOX[0]) // res).astype(int)))
    print(f"{res:>8}°{nx * ny:>7}{1 - len(filled) / (nx * ny):>30.0%}")
cell size cells empty on a typical clear pass
0.01° 4750 98%
0.025° 760 86%
0.05° 190 42%
0.1° 50 12%
Binning by pixel centre, a 0.01° grid is 98% holes on a clear day — the pixels are simply bigger than the cells. At 0.05° the same pass fills 58% of the grid, at 0.1° almost all of it.
Example 3 — what a lower threshold adds
low = px[(px.qa >= 0.5) & (px.qa < 0.75)]
print(f"pixels gained by lowering the threshold to 0.5: {len(low):,} "
      f"({len(low) / (px.qa >= 0.75).sum():.1f}× the usable set)")
print("they are the pixels the product marks as cloud-affected or otherwise compromised;")
print("the gain in coverage is a gain in biased retrievals, not in observations")
pixels gained by lowering the threshold to 0.5: 28,699 (1.4× the usable set)
they are the pixels the product marks as cloud-affected or otherwise compromised;
the gain in coverage is a gain in biased retrievals, not in observations
Lowering the threshold more than doubles the pixels — every one of them a retrieval the product itself does not recommend for this use.
Why cloud is fatal to NO2 retrievals
Why cloud is fatal to NO2 retrievals
Most urban NO2 sits in the lowest kilometre. A cloud above it blocks the satellite's view of that layer; the retrieval then sees the NO2 above the cloud and has to guess what is below. qa_value drops for exactly that reason, and no processing recovers what the cloud hid.
Why centre-binning leaves holes
Each pixel's value is assigned to the one cell containing its centre. When cells are smaller than pixels, most cells contain no centre, even though the pixel footprints cover them completely. Area-weighted regridding spreads each pixel over the cells it overlaps and fills the grid honestly.
Why the average of clear days is its own statistic
Clear days are not a random sample: they are often high-pressure days with weak winds and strong photochemistry. A satellite climatology is a climatology of clear afternoons, and comparing it with an all-hours ground mean compares two different things.
Snow, swath edges and oversampling
- Snow in winter lowers
qa_valueat northern sites even under clear skies. - Swath edges have larger pixels and more geometric distortion; some studies exclude the outermost rows.
- Orbit overlap at high latitudes gives two daytime passes on some days; average them rather than counting two days.
- Oversampling: averaging many overlapping pixels over a long period recovers detail finer than one pixel — the principle behind high-resolution satellite NO2 climatologies.
- Geostationary instruments (Sentinel-4, TEMPO) give several observations per day and more chances between clouds.
Internal links
- How to map Sentinel-5P NO2 in Python — the full workflow
- Satellite NO2 explained — what the column means
- Cloud masking explained — the same problem in optical imagery
- Air quality data gaps and negative values — gaps in ground data
- How to download satellite imagery from STAC — catalogue searching
- Raster resampling explained — grids finer than their data
FAQ
Why is my Sentinel-5P NO2 map mostly empty?
Clouds remove most pixels on most days, and a grid finer than the 5.5 × 3.5 km pixels leaves cells without a pixel centre.
Should I lower the qa_value threshold?
No. Pixels between 0.5 and 0.75 are cloud-affected; they fill the map with biased values.
Why do some granules have no data at all?
Night-side passes intersect the area but carry no NO2 retrieval. Filter by overpass time.
Why do I see each day twice?
The catalogue has both near-real-time and offline versions of each pass. Use one.
How long should I average?
At least a month for a city in a cloudy climate, and report the number of observations per cell.
What grid size should I use?
At least the pixel size (about 0.05° at mid-latitudes), or area-weighted regridding for finer grids.